
Abstract
Abstract
Screening for hub genes associated with gastric cancer and elucidating possible molecular mechanisms of gastric cancer. Five gastric cancer-related gene expression profiles were extracted from the GEO database, and differentially expressed genes (DEGs) were obtained using GEO2R. Gene ontology (GO) enrichment analyses were performed by DAVID, and protein–protein interaction (PPI) network of the DEGs was constructed by STRING and Cytoscape software. Survival value for hub gene comes from the Kaplan–Meier plotter platform. In addition, potential miRNAs of hub genes were predicted by miRWalk. Four hundred seventy-six DEGs were identified in the five expression profiles, these genes are mainly involved in extracellular matrix (ECM)-receptor interaction, chemical carcinogenesis, gastric acid secretion, and PI3K-Akt signaling pathway. Combined with the results of the PPI network and CytoHubba, six hub genes were screened: SERPINH1, NPY, PTGDR, GPER, ADHFE1, and AKR1C1. These genes are highly expressed in gastric cancer tissues, and the overexpression level of these genes is associated with poor survival. A series of miRNAs such as hsa-miRNA-92a-1, hsa-miRNA-647, and hsa-miRNA-507 may play a key role in hub gene regulation. Our studies indicate that SERPINH1, NPY, PTGDR, GPER, ADHFE1, and AKR1C1 may be potential biomarkers and therapeutic targets for gastric cancer in the future.
1. Background
Gastric cancer is a common malignant tumor of the digestive tract, ranking fourth in the world for oncology (Jemal et al., 2010; Wong et al., 2011). The incidence of gastric cancer is concealed and difficult to detect in early stage. Previous studies have shown that Helicobacter pylori infection is one of the risk factors for gastric cancer (Yip and Teoh, 2018; Shi et al., 2019). Current epidemiology and related studies have found that lifestyle, infection factors, environmental factors, genetic factors, and abnormal gene expression are closely related to the occurrence of gastric cancer (Jia et al., 2010; Boland and Yurgelun, 2017). The pathogenesis of gastric cancer is complicated, and the specific causes and pathogenesis need further study. With the rapid development of molecular biology, especially the wide application of chip technology, more and more experimental platforms use molecular biology technology to screen genes closely related to tumorigenesis. It is easier to elucidate the pathogenesis of tumor by combining chip data with bioinformatics.
In this study, we reanalyzed the mRNA expression profile of gastric cancer in the National Center for Biotechnology Information (NCBI) database, and screened out the differentially expressed genes (DEGs) that were expressed in more than three expression profiles. The DEGs provided a theoretical basis for the further study of the diagnostic markers and pathogenesis of gastric cancer.
2. Methods
2.1. Microarray data source
Data sets of mRNA expression profiles associated with gastric cancer were downloaded from the GEO database of the NCBI. In this study, five different gastric cancer gene expression profiles (GSE79973, GSE103236, GSE54129, GSE26942, and GSE26899) were used for comparative analysis of gastric cancer and paracancerous samples.
2.2. Identification of differentially expressed genes
The DEGs in gastric cancer and paracancerous tissues were screened and analyzed by using the GEO2R tool of GEO database. GEO2R is a data set analysis tool based on t-test or ANOVA. The two groups of data under the same experimental conditions were compared, and the DEGs were screened between cancer and paracancerous tissues. In this study, the DEGs were analyzed using p < 0.01 and LogFc < −1 or LogFc >1 as screening conditions.
2.3. Gene ontology and Kyoto Encyclopedia of Genes and Genomes (KEGG) pathway analysis of differentially expressed genes
Gene ontology (GO) analysis and KEGG pathway analysis were performed on DEGs by using the DAVID (https://david.ncifcrf.gov/home.jsp) online analysis tool. The research includes the biological processes (BP), molecular functions (MF), cellular components (CC), and KEGG signaling pathways. In addition, the cutoff value for screening was set at p < 0.01.
2.4. Protein–protein interaction network construction and hub gene identification
DEGs were uploaded to an online software STRING (http://string-db.org/) to produce a protein–protein interaction (PPI) network graph, and the interaction between these DEGs was analyzed. The protein interaction network of DEGs was constructed by Cytoscape software. Protein interaction patterns and hub genes were screened from protein interaction networks. Genes with 10 or more gene degrees in the PPI network were deemed as hub genes.
2.5. Survival analysis of hub genes
Hub genes were uploaded to the online software Kaplan–Meier Plotter (http://kmplot.com) to analyze the correlation between the hub genes and the survival time of gastric cancer patients. The hazard ratio (HR) is given with 95% confidence interval and the logarithmic rank p value is calculated.
2.6. MiRNA screening to regulate hub genes
Six hub genes associated with gastric cancer were imported into the miRWalk2.0 website for screening miRNAs that regulate target genes. MiRNA identified by miRWalk, miRanda, miRDB, RNA22, and TargetScan prediction tools is included as the potential regulatory miRNA of hub genes.
3. Results
3.1. Identification of differentially expressed genes
In this study, we analyzed 5 different gastric cancer gene expression profiles, involving 432 gastric cancer samples and 64 paracancerous cancers tissues (Table 1). Using GEO2R to analyze gene expression profiles, there were 611 DEGs in GSE26899, 436 DEGs in GSE26942, 5258 DEGs in GSE54129, 2570 DEGs in GSE79973, and 1769 DEGs in GSE103236 (Fig. 1). Sixty-six genes were differentially expressed in 5 gene expression profiles. In this study, genes with differential expression of more than three expression profiles were included as inclusion criteria, and 476 DEGs were screened (Table 2).
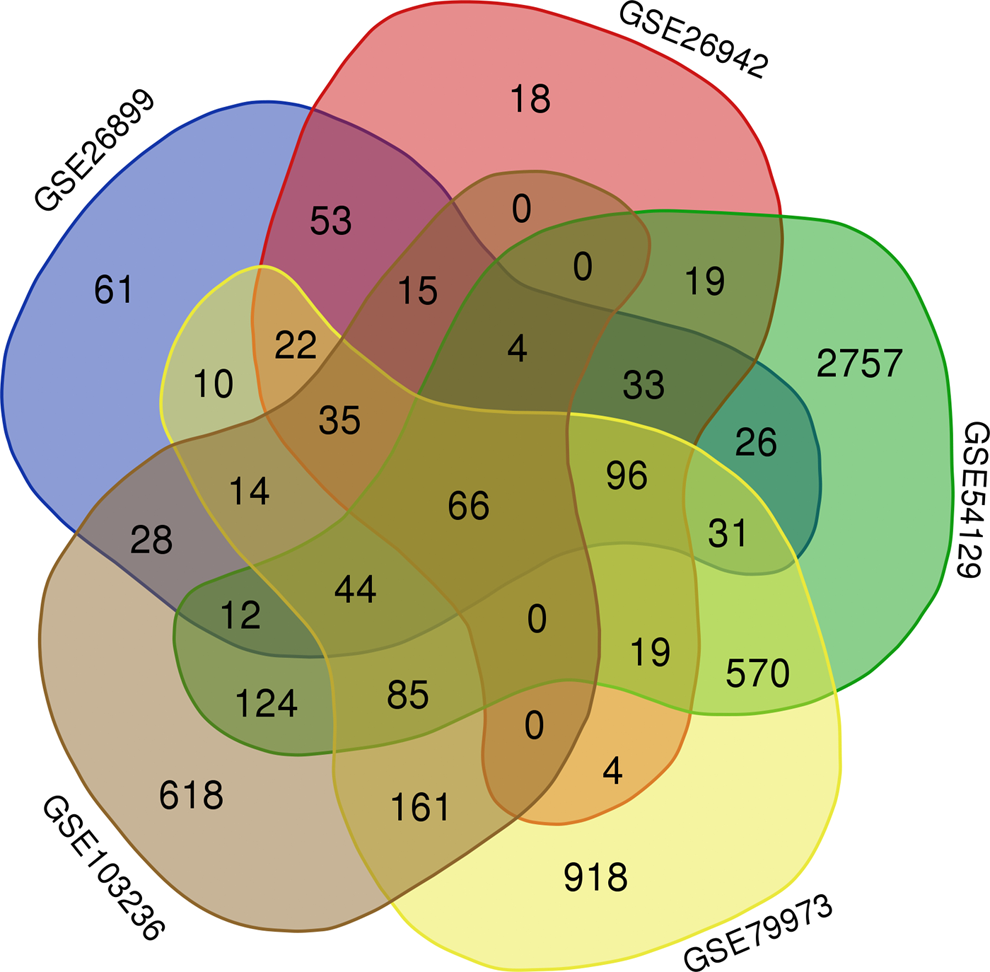
Venn diagram for the DEGs between gastric cancer and paracancer tissues in five different gene expression profiles. DEGs, differentially expressed genes.
Details for GEO Gastric Cancer Data
Screening for Differentially Expressed Genes in Gastric Cancer by Integrating Microarray Combinations
3.2. Gene ontology and KEGG pathway analysis of differentially expressed genes
Four hundred seventy-six DEGs in gastric cancer and paracancer tissues were uploaded to DAVID's website. Signal pathway enrichment analysis revealed that these DEGs are mainly involved in extracellular matrix (ECM)-receptor interaction, protein digestion and absorption, chemical carcinogenesis, gastric acid secretion, PI3K-Akt signaling pathway, and glycolysis/gluconeogenesis. GO analysis showed that DEGs were mainly involved in cell adhesion, endoderm cell differentiation, angiogenesis regulation, cell and cell adhesion, regulation of cell proliferation, and regulation of gene expression, and closely related to the cell receptor and ECM (Fig. 2).
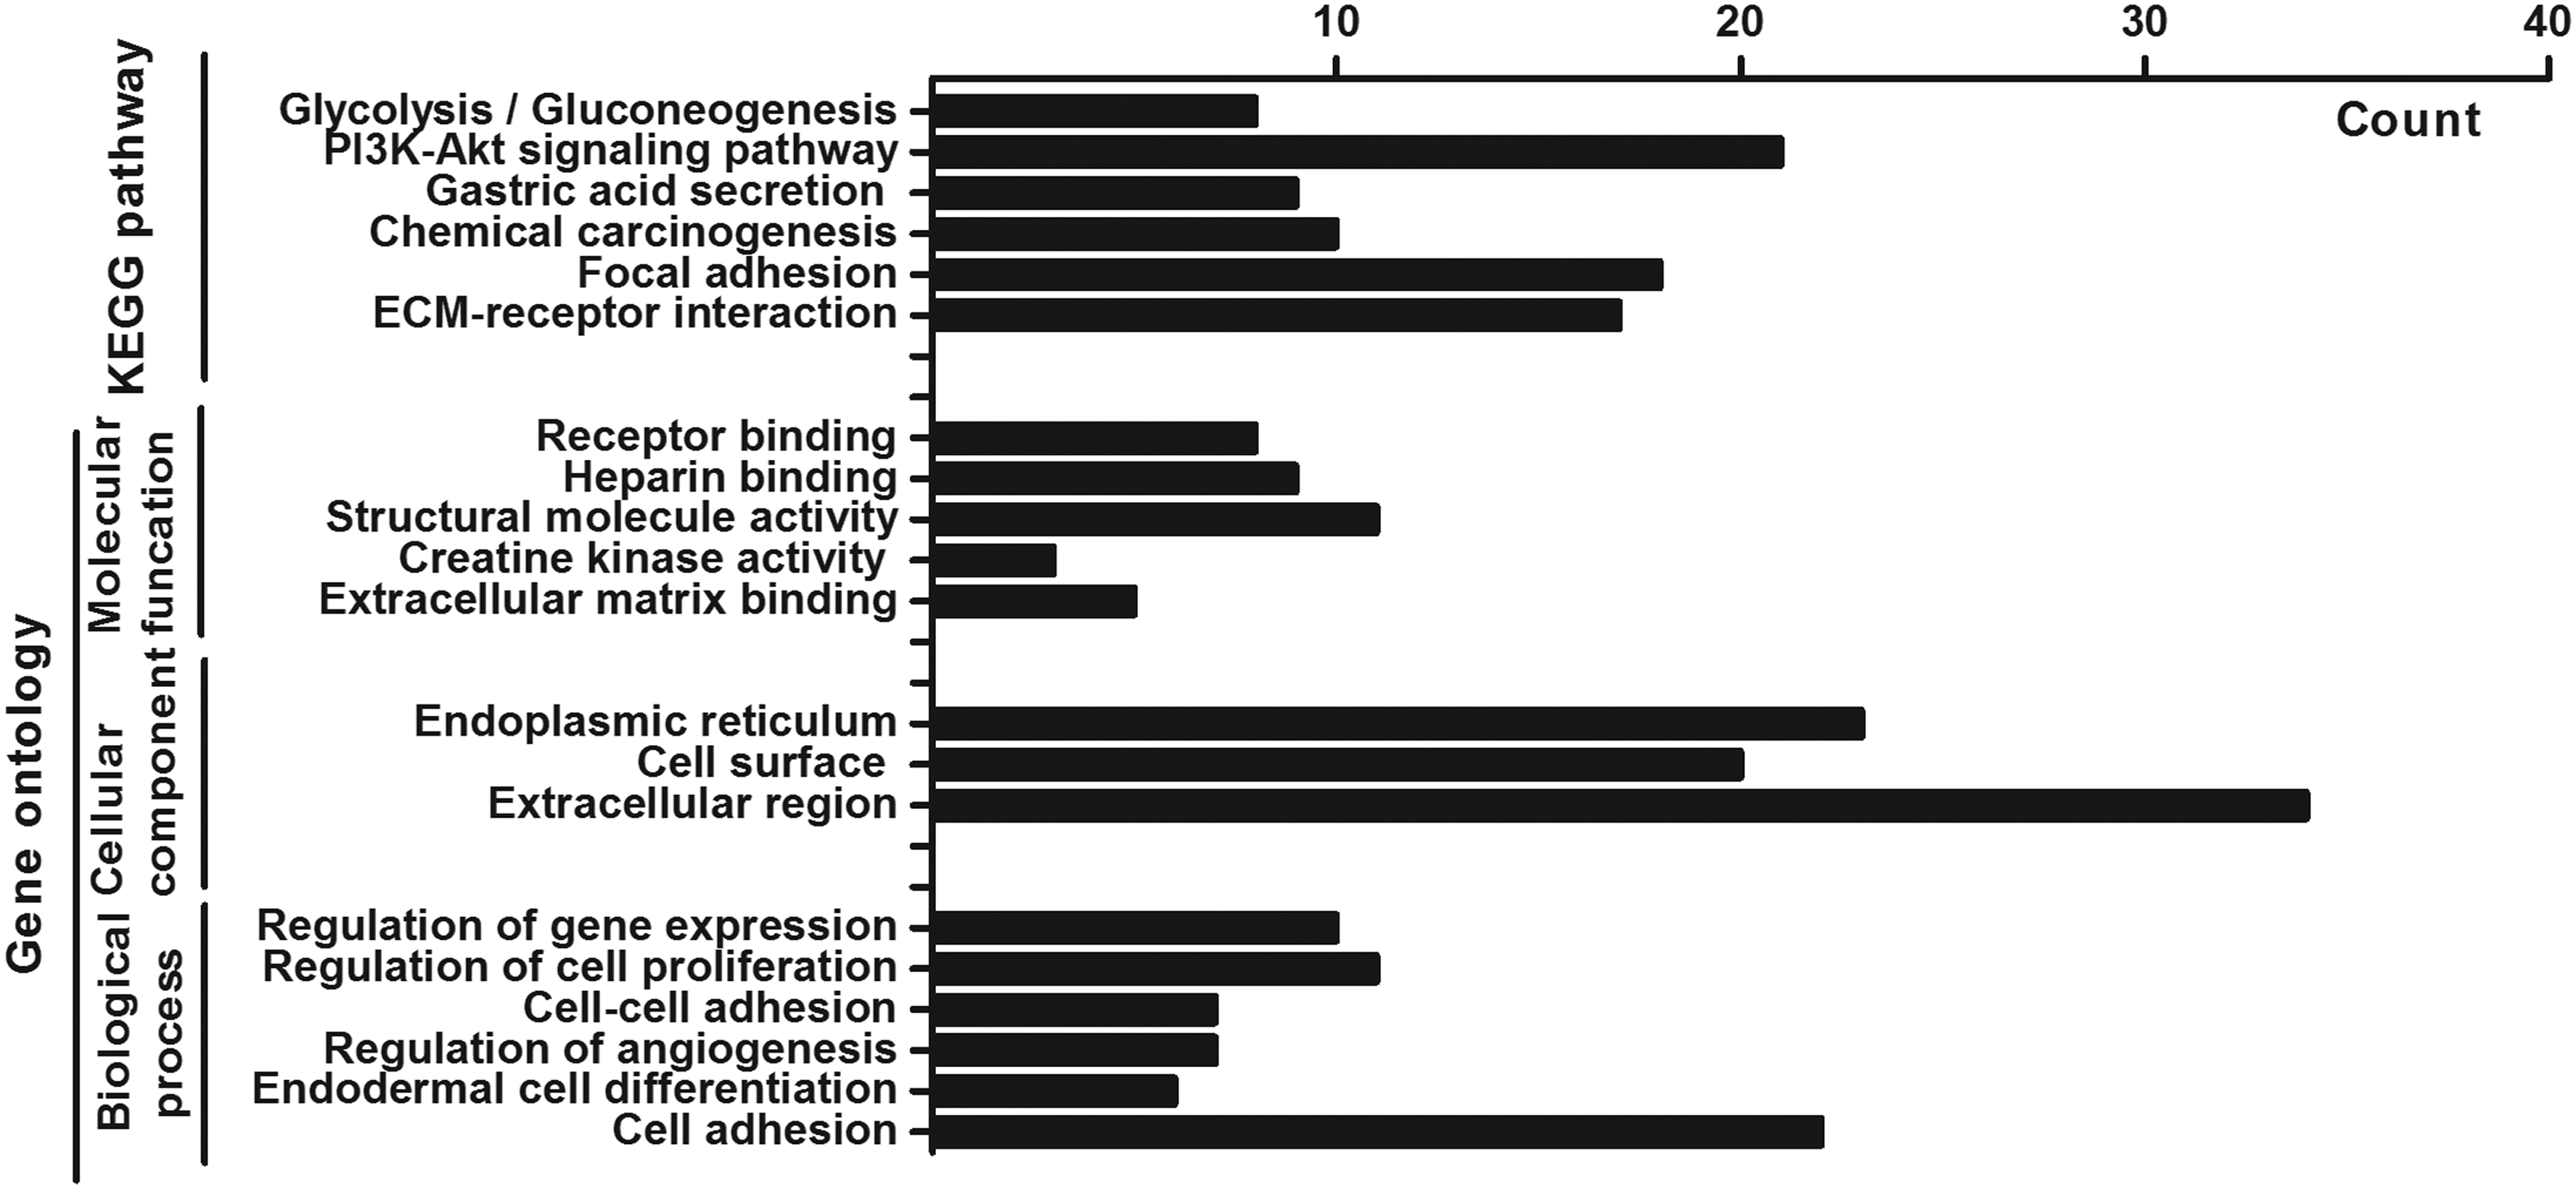
Gene ontology and pathway enrichment analysis of DEGs.
3.3. Protein–protein interaction network construction and analysis of modules
Using MCODE to analyze the entire PPI network, three higher scoring modules were selected. The score of model 1 is 15.867, which contains 16 hub genes, including SERPINH1, COL5A2, COL18A1, COL4A2, COL4A1, COL8A1, COL6A3, P4HA3, COL11A1, COL10A1, COL3A1, COL4A5, COL1A1, COL5A1, COL1A2, and COL12A1 (Fig. 3A). The score of mode 2 was 6.0, which contained 14 hub genes, including ITGA2, NPY, PTGDR, GPER, MMP7, FGA, FGG, IL8, ISLR, PLAU, C5, FPR3, SSTR1, and SST (Fig. 3B). Mode 3 has a score of 5.143 and contains 29 hub genes as follows: CLDN7, CHGA, RDH12, MT1E, MT1H, ATP4A, MT1M, ADH1A, ALDH1A1, CCKBR, NQO1, ADHFE1, ACACB, AKR1C4, CLDN18, MT1F, DHCR24, CLDN1, ADH7, MT1G, CLDN3, HDC, CLDN23, AGXT2L1, AKR1C3, AKR1C1, FBP2, ALDOB, and FBP1 (Fig. 3C). KEGG analysis of 59 hub genes revealed that these genes are closely related to protein digestion and absorption, ECM-receptor interaction, focal adhesion, and PI3K-Akt signaling pathway (Table 3).
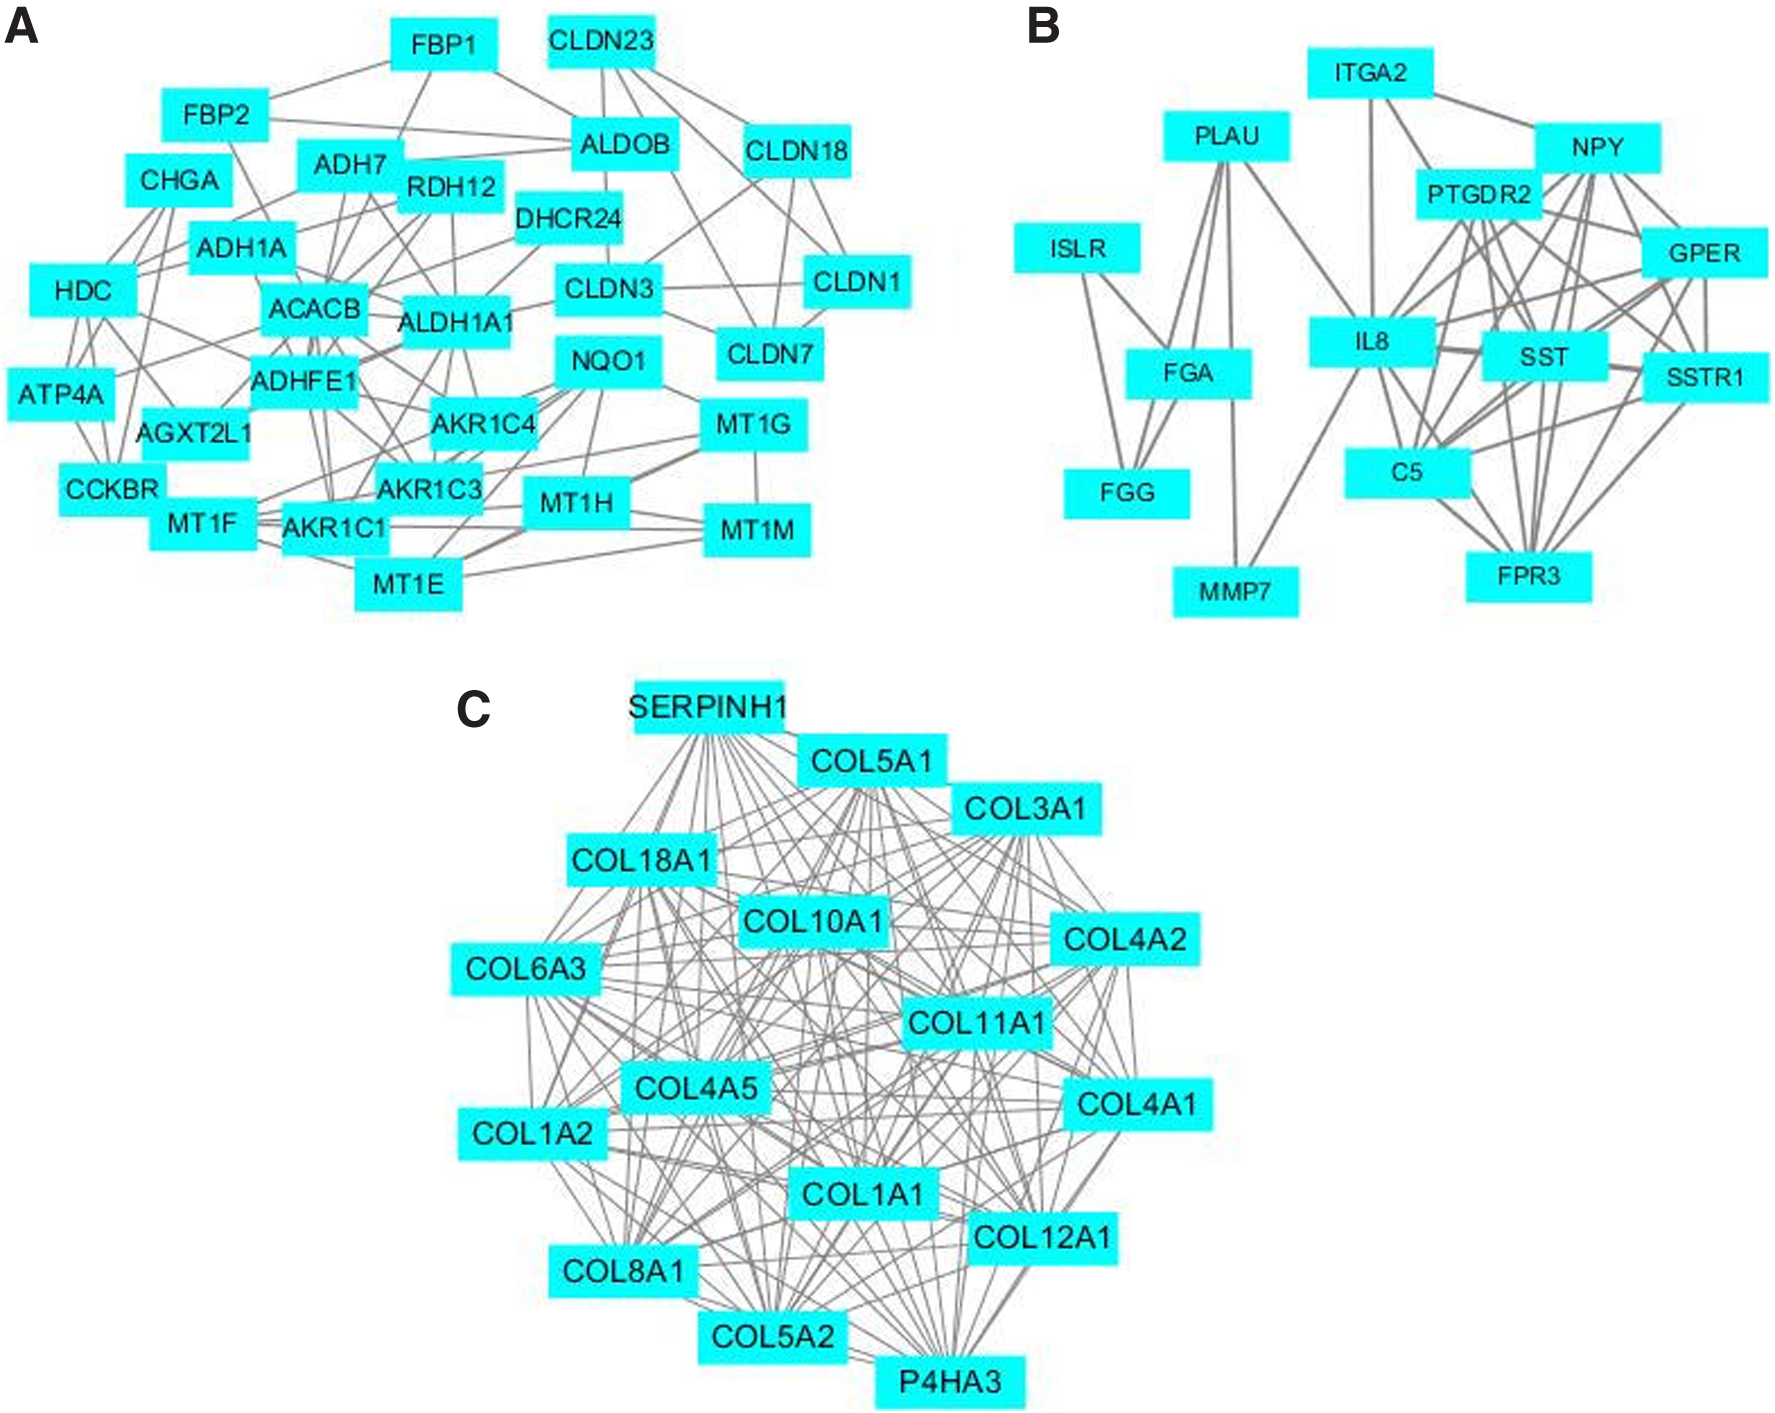
Top three modules from the protein–protein interaction network.
KEGG Pathway Enrichment Analysis of the Genes in Module
ECM, extracellular matrix.
3.4. Survival analysis of hub gene
To further evaluate the prognostic value of hub genes, we analyzed the survival curves of each gene. On the Kaplan–Meier plotter analysis platform, 876 gastric cancer cases were analyzed for survival analysis of hub genes. Among the 59 genes, 22 genes were not significantly correlated with the prognosis of gastric cancer, 31 genes had been reported to be significantly correlated with the occurrence of gastric cancer, and 6 genes were associated with the prognosis of gastric cancer and had not been reported (Fig. 4).
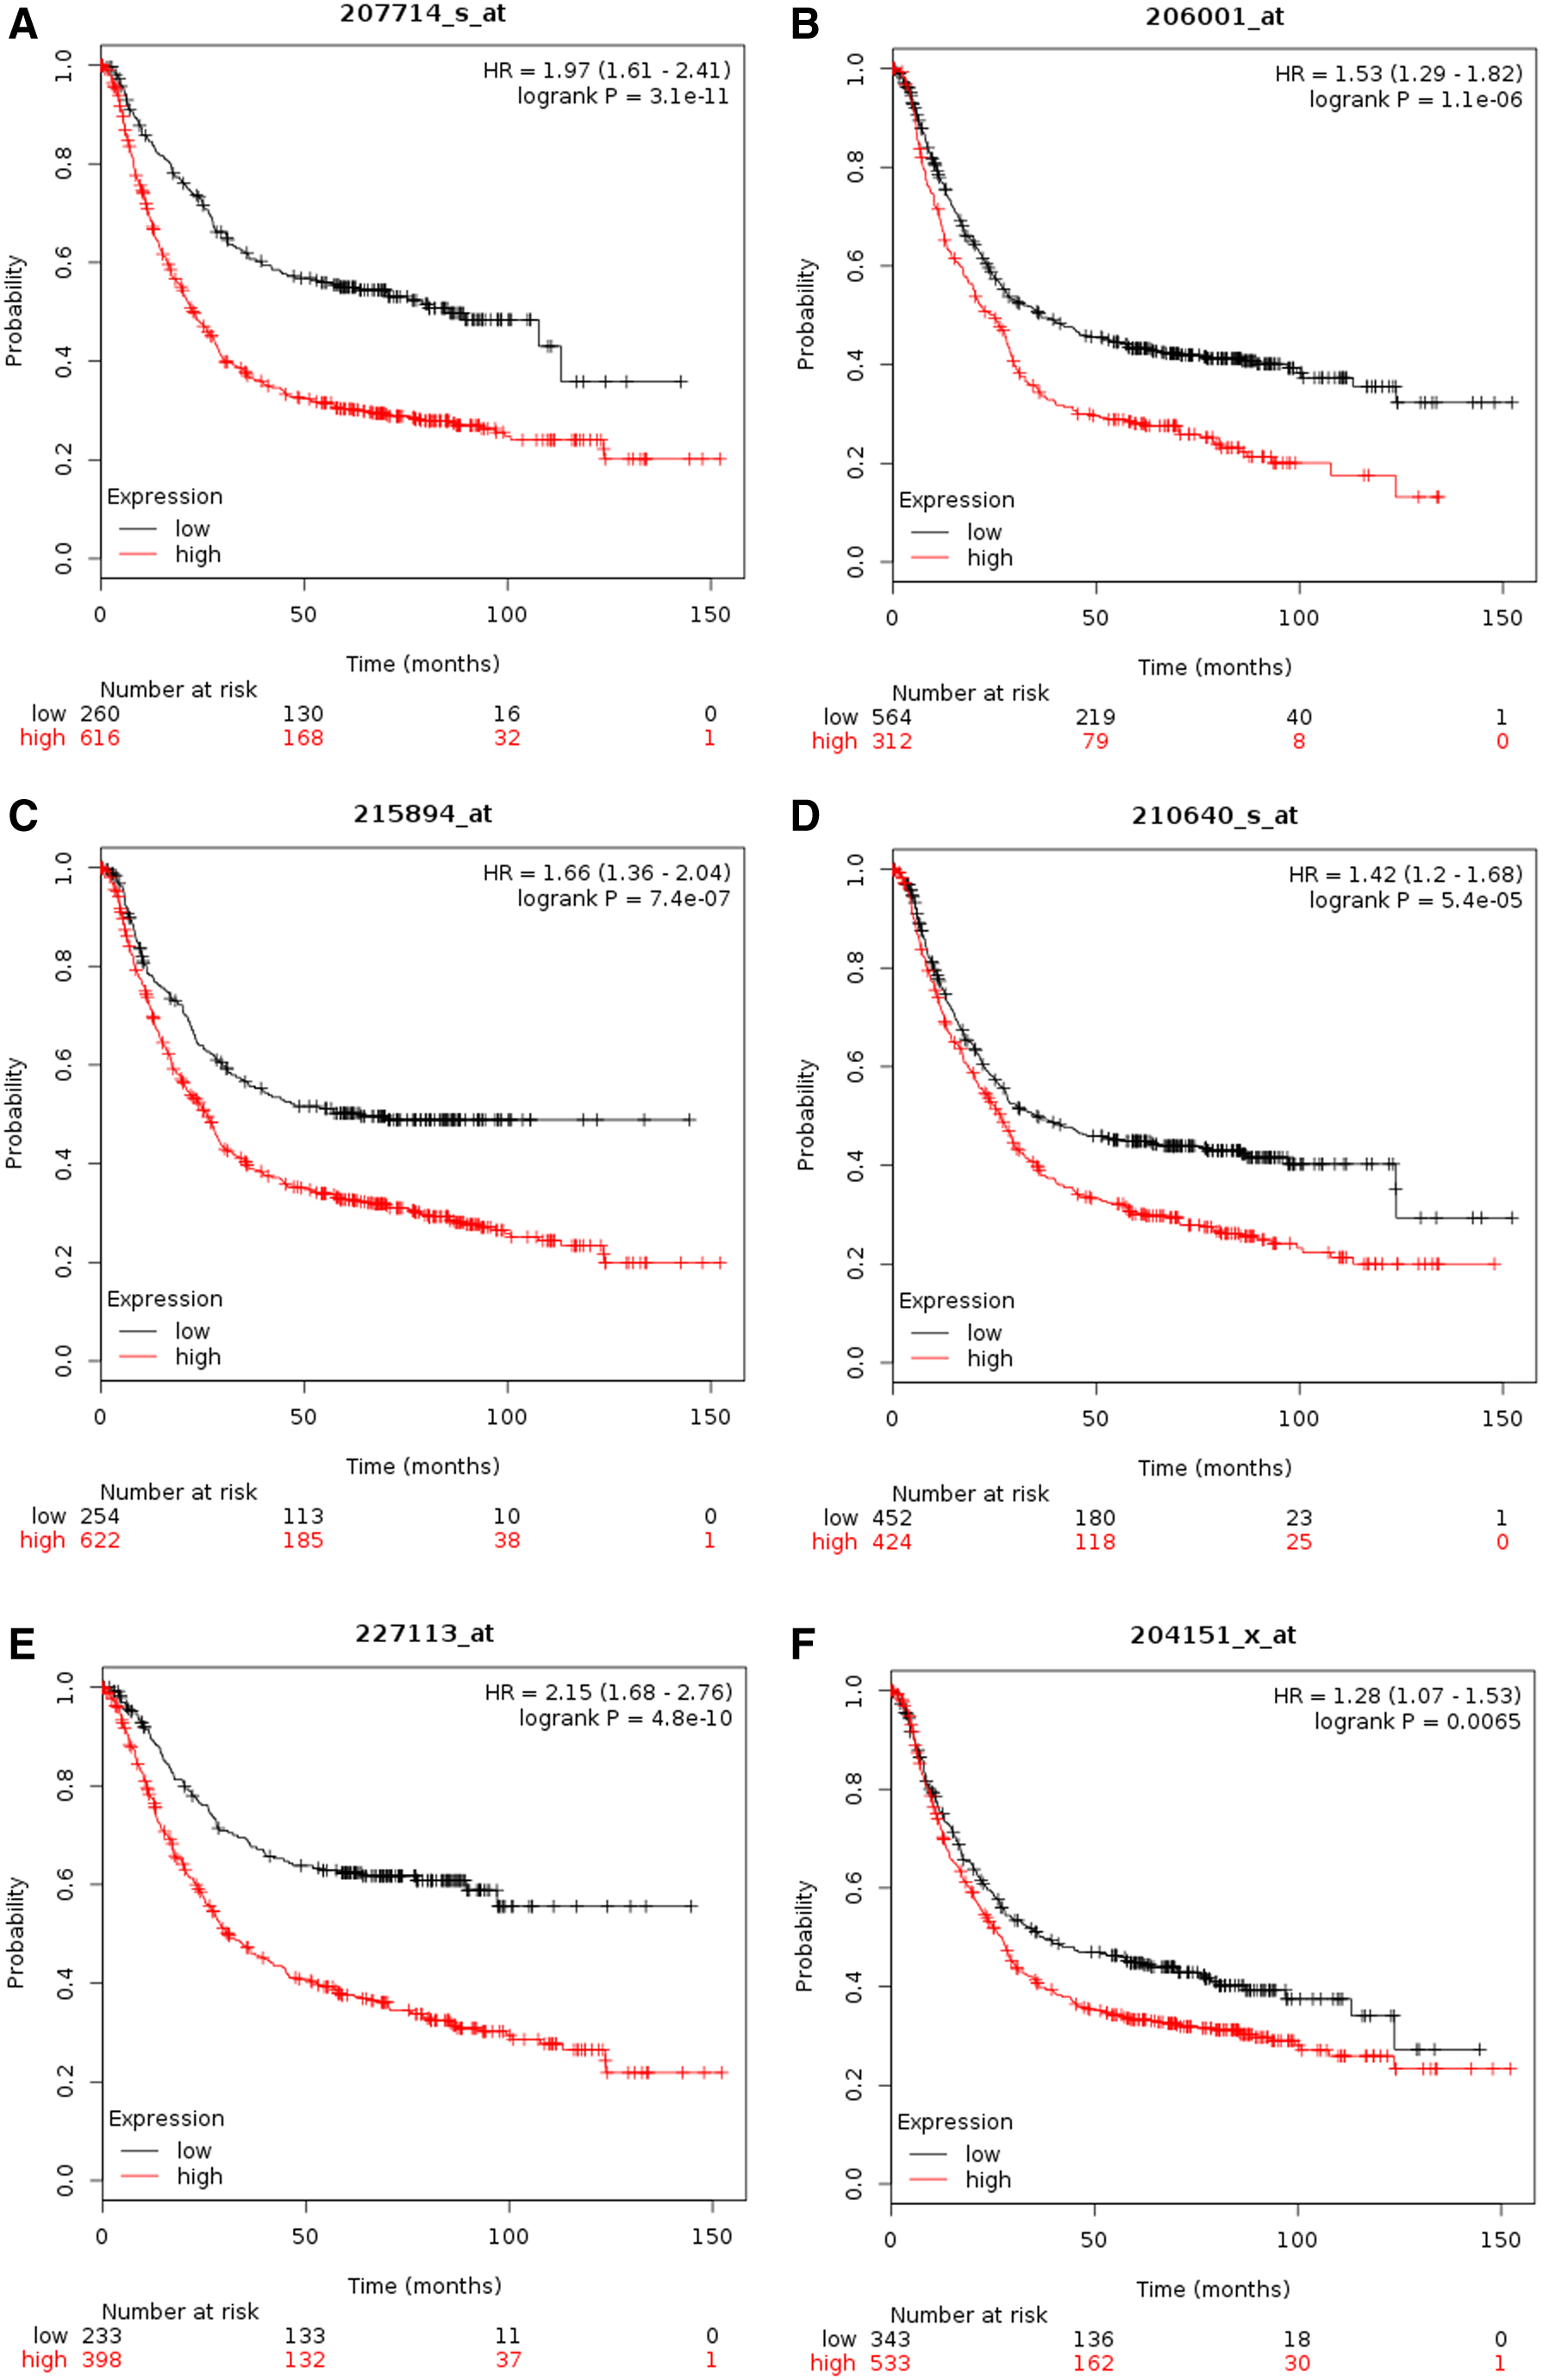
Kaplan–Meier overall survival analysis for six hub genes expressed in GC patient samples.
3.5. miRNA screening of regulatory hub genes
The potential miRNAs of the six hub genes were predicted using the miRWalk2.0 website. As showed in Table 4, top three predicted miRNAs of hub genes were displayed according to the prediction program numbers.
Hub Genes and Their Predicted miRNAs
4. Discussion
Gastric cancer is one of the most deadly tumors in the world, with 5-year survival rate of only 20%–40% (Shah and Kelsen, 2010). The occurrence and development of gastric cancer are a very complicated process, so it is particularly important to study the molecular mechanism of gastric cancer from the molecular level with genomics, proteomics, metabolomics, and other methods. Based on the rapid development of gene chip and sequencing platform in disease research, it provides a good technical method for us to study the pathogenesis of gastric cancer.
In this study, we screened out 59 hub genes from 5 different gene expression profiles. These genes mainly involved in protein digestion and absorption, ECM-receptor interaction, focal adhesion, PI3K Akt signaling pathway, and other signaling pathways. Among these DEGs, SERPINH1, NPY, PTGDR, GPER, ADHFE1, and AKR1C1 genes were significantly correlated with gastric cancer survival, which has not been reported in the literature.
The pathogenesis of cancer is multifactorial and involves multiple signaling cascades. SERPINH1, also known as Hsp47, is an important chaperone protein required for correctly folding and secreting collagen, and its expression level is closely related to the occurrence of tumors (Durate and Bonatto, 2018). Previous research found high expression in renal clear cell carcinoma, and lung cancer (Yamamoto et al., 2013; Kamikawaji et al., 2016; Qi et al., 2018). Yamamoto et al. (2013) believed that the high expression of SERPINH1 was closely related to the migration and invasion of cervical squamous cells. Zhao et al. (2014) used small interfering RNA to knock out the expression of HSP47 in glioma cells, and the growth, migration, and invasion of glioma cells were inhibited in vitro. Using predictive software, the differential expression of SERPINH1 may be regulated by hsa-miRNA-92a-1, hsa-miRNA-30c-1, and hsa-miRNA-1265.
NPY gene encodes neuropeptides, which widely express the central nervous system and affect the physiological processes such as stress response, circadian rhythm, and cardiovascular function. Jeppsson et al. (2017) believed that NPY promotes inflammatory tumorigenesis by enhancing epithelial cell proliferation. Abnormal expression of NPY and related receptors in prostate cancer is closely related to tumor development (Rasiah et al., 2006; Ruscica et al., 2006). At present, the correlation between NPY and gastric cancer has not been reported. Hsa-miRNA-647, hsa-miRNA-363, and hsa-miRNA-586 may bind to the 3′ UTR of genes to regulate NYP expression.
PTGDR encodes a superfamily of guanine nucleotide binding protein-coupled receptors (GPCR) that respond to extracellular signals and activate intracellular signaling pathways. Ooki et al. (2017) found that methylation of PTGDR promoter can be used as a biomarker for early detection of cancer in nonsmall-cell lung cancer. Methylation of promoter of PTGDR gene is also associated with colorectal carcinogenesis (Kalmár et al., 2015). PTGDR may be the target of hsa-miRNA-507, hsa-miRNA-1301, and hsa-miRNA-20b through prediction.
GPER gene encodes multiple membrane proteins, which are located in the endoplasmic reticulum. Current studies have found that GPER inhibits angiogenesis of breast cancer and is associated with the prognosis of breast cancer (Wang et al., 2018). As a mechanical regulator, GPER protein is involved in the regulation of pancreatic stellate cells and tumor microenvironment, as well as the regulation of adrenal cortical cancer and colorectal cancer (Casaburi et al., 2017; Liu et al., 2017; Cortes et al., 2019). The MiRWalk2.0 website predicted that the expression of GPER gene may be regulated by hsa-miRNA-644, hsa-miRNA-1226, and hsa-miRNA-10a.
ADHFE1 encodes hydroxyacid/oxoacid hydrogenase, which promotes the oxidation of 4-hydroxybutyric acid in mammalian tissues. ADHFE1 is a breast cancer oncogene that reduces patient survival (Mishra et al., 2018). The expression of ADHFE1 protein was negatively correlated with methylation of DNA promoter and negatively correlated with the degree of differentiation of colorectal cancer (Tae et al., 2013). The expression of ADHFE1 is regulated by hsa-miRNA-630, hsa-miRNA-372, and hsa-miRNA-106a.
AKR1C1 gene encodes the aldo/keto reductase superfamily member, which converts aldehydes and ketones to alcohols using NADH or NADPH as cofactors. Matsumoto et al. found that the AKR1C1 protein plays an important role in regulating bladder cancer metastasis and drug resistance (Matsumoto et al., 2016). High expression of AKR1C1 promoted the migration and proliferation of lung cancer cells (Tian et al., 2016; Zhu et al., 2018). In primary human breast cancer, AKR1C1 expression is an independent prognostic marker (Wenners et al., 2016). Numerous miRNAs such as hsa-miRNA-944, hsa-miRNA-1226, and hsa-miRNA-597 play a regulatory role in the expression of AKR1C1.
In conclusion, according to the biological information, we identified some hub genes in gastric cancer. These genes play an important role, but have not been reported before. This study provides a new biomarker for the study of gastric cancer.
Footnotes
Acknowledgment
This work was supported by the Science Study of Guangxi Health Commission (Z20180228).
Author Disclosure Statement
The authors declare they have no competing financial interests.