




Abstract
Glioblastoma (GBM) is a most aggressive primary cancer in brain with poor prognosis. This study aimed to identify novel tumor biomarkers with independent prognostic values in GBMs. The DNA methylation profiles were downloaded from The Cancer Genome Atlas and Gene Expression Omnibus database. Differential methylated genes (DMGs) were screened from recurrent GBM samples using limma package in R software. Functional enrichment analysis was performed to identify major biological processes and signaling pathways. Furthermore, critical DMGs associated with the prognosis of GBM were screened according to univariate and multivariate cox regression analysis. A risk score-based prognostic model was constructed for these DMGs and prediction ability of this model was validated in training and validation data set. In total, 495 DMGs were identified between recurrent samples and disease-free samples, including 356 significantly hypermethylated and 139 hypomethylated genes. Functional and pathway items for these DMGs were mainly related to sensory organ development, neuroactive ligand–receptor interaction, pathways in cancer, etc. Five genes with abnormal methylation level were significantly correlated with prognosis according to survival analysis, such as ALX1, KANK1, NUDT12, SNED1, and SVOP. Finally, the risk model provided an effective ability for prognosis prediction both in training and validation data set. We constructed a novel prognostic model for survival prediction of GBMs. In addition, we identified five DMGs as critical prognostic biomarkers in GBM progression.
1. Introduction
Glioblastoma (GBM) is a most aggressive primary cancer derived from brain. GBM represents ∼45%–50% of all primary malignant brain tumors and every year ∼3/100,000 individuals develop this disease in the United States (Gallego, 2015). Currently, treatment methods involved are surgery, radiotherapy, and adjuvant temozolomide chemotherapy. Despite great progress has been achieved over the past decade, there are still large cohorts of GBMs suffering a poor prognosis with median survival time <12 months and 5-year survival rate <5% (Young et al., 2015). Therefore, it is necessary to investigate novel therapeutic methods for early diagnosis and prognosis of GBM.
DNA methylation is a common epigenetic modification in eukaryotic genome. Prior researches have demonstrated aberrant methylation can result in abnormality of gene expression, increasing genomic and chromosomal instability, and thus promoting tumor genesis and development (Davis and Uthus, 2004; Zhang et al., 2015). For example, the most studied of hypermethylation genes are human mutL homolog 1 (hMLH1) in colorectal cancer and BRCA1 in breast cancer (Herman et al., 1998; Wu et al., 2015). Hypermethylation of BRCA1 can result in inactivation of gene function and improve the risk of breast cancer (Esteller et al., 2000). Aberrant hypermethylation of cytosine–phosphate–guanine (CpG) islands in hMLH1 promoter regions also affected DNA stability and resulted in tumorigenesis in human colorectal cancer (Zhang et al., 2017). Since the changes of methylation status usually become an earlier event compared with gene mutation, thus DNA methylation pattern has served as a powerful tool to provide potential biomarkers for diagnosis, prognosis, and individual therapy in cancers (Delpu et al., 2013). The understanding of DNA methylation in cancer development will be helpful for disease diagnosis, treatment, and prognosis. Furthermore, CpG islands serve as primary sites of DNA methylation and hypermethylation of CpG island in promoter regions play a vital role in gene inactivation and tumorigenesis (Sibaji et al., 2011).
CpG islands are series of DNA segment roughly 1000 base-pair length. Methylation of CpG islands can suppress transcription factor binding and always silence gene expression (Mohn et al., 2008; Moore et al., 2013). Currently, a study identified novel six-CpG signature as independent prognostic indicator for GBMs (Yin et al., 2018). The bioinformatic analysis in another article showed several differential expressed genes with methylated status detected and the eight-gene signature exhibited independently prognostic value for GBM patients (Wang et al., 2017). However, the tumor-specific targets were still fewer identified and validated in clinical GBMs. Thus, more studies are needed to identify reliable therapeutic gene targets for prognosis prediction.
In this study, the GBM data sets downloaded from The Cancer Genome Atlas (TCGA) database were analyzed to screen differential methylated genes (DMGs) between recurrent and disease-free tumor samples. Gene Ontology (GO) and Kyoto Encyclopedia of Genes and Genomes (KEGG) functional analysis were performed to identify related biological process and signaling pathway enriched by these DMGs. Moreover, univariate and multivariable cox regression analyses were performed to identify major DMGs with independent prognostic values. A risk score-based prognostic model was constructed for survival prediction of patients. Finally, identification of DMGs in our study might provide novel biomarkers for prognosis prediction in GBMs.
2. Methods
1.1. GBMs data from TCGA and Gene Expression Omnibus database
The DNA methylation profiles were downloaded from TCGA database (https://gdc-portal.nci.nih.gov), including 155 GBMs samples. The microarray data were tested on the platform of Illumina Infinium Human Methylation 450 BeadChip. After data normalization, a total of 107 individuals labeled with disease-free status information (Disease Free and Recurred/Progressed) were considered as training data set. Furthermore, the methylation data set under access number GSE60274 (Kurscheid et al., 2015) were downloaded from NCBI Gene Expression Omnibus (www.ncbi.nlm.nih.gov/geo) database, including 77 GBM tumor samples. A total of 62 samples with corresponding prognosis information were selected as validation data set.
1.2. Identification of DMGs
The tumor samples in TCGA training set were divided into disease free and recurred/progressed group according to clinical information. DNA methylated sites were annotated according to platform information, and only genes with methylation sites in CpG region were reserved. DMGs were screened between two groups of samples using limma package Version 3.34.7 (Ritchie et al., 2015; https://bioconductor.org/packages/release/bioc/html/limma.html) in R3.4.1 software. False discovery rate (FDR) <0.05 and |log2FC|>0.263 (1.2-fold) were selected as the threshold.
1.3. Correlation analysis between methylation and expression status of DMGs
The GBM individual tumor samples with methylation status were screened out. The overall relationship between methylation and expression level was first analyzed for these DMGs. While the Pearson correlation coefficient (PCC) was often used to characterize the relationship between two continuous variables, we calculated the PCC value to analyze the correlation between methylation and expression levels using cor test function in R software (https://stat.ethz.ch/R-manual/R-devel/library/stats/html/cor.test.html). The DMGs with a negative PCC value were screened as critical genes and functional analysis was performed by using the Database for Annotation, Visualization, and Integrated Discovery (DAVID) version 6.8 (Da et al., 2009; Wei et al., 2009; https://david.ncifcrf.gov) online tools to annotate related biological process and signaling pathway.
1.4. Construction of prognostic model for critical DMGs
As for these DMGs, the correlation between methylated status and disease-free survival times were analyzed according to univariate and multivariate cox regression analyses in survival package version 2.41-1 (Goel et al., 2010; Wang et al., 2016; http://bioconductor.org/packages/survivalr). The log-rank test was used and if p value was <0.05, the DMGs were considered as a critical gene associated with survival outcomes of GBM patients.
The correlation coefficient of critical DMGs was calculated. A risk score prognostic model was constructed based on DMGs methylation status. The risk score of each sample was calculated as follows:
After setting the median RS value as a cutoff point, the individuals in training data sets were divided into high-risk and low-risk groups. The Kaplan–Meier survival analysis was performed using survival package version 2.41-1 in R3.4.1 software to evaluate the correlation between risk model and survival times both in training data set and validation data set GSE60274.
3. Results
3.1. DMG screening
Based on the annotation information of Illumina 450K methylation platform, a total of 16,502 unique DNA methylation loci were identified containing CpGs region. After analysis of disease status, these samples were divided into disease-free group and recurred/progressed group, which contain 25 and 82 samples, respectively. The limma package was used to integrate the DMGs between two groups, and finally 495 DMGs with CpGs region were identified, including 356 significantly hypermethylated and 139 hypomethylated genes. The volcano in Figure 1A represented the distribution of these genes. The Kernel density curve based on Log2 value of DMGs was shown in Figure 1B. Furthermore, the bidirectional hierarchical clustering analysis was performed (Fig. 1C) and the heatmap represented the DMG methylation level. The results showed that these tumor samples could be significantly divided into two different groups.
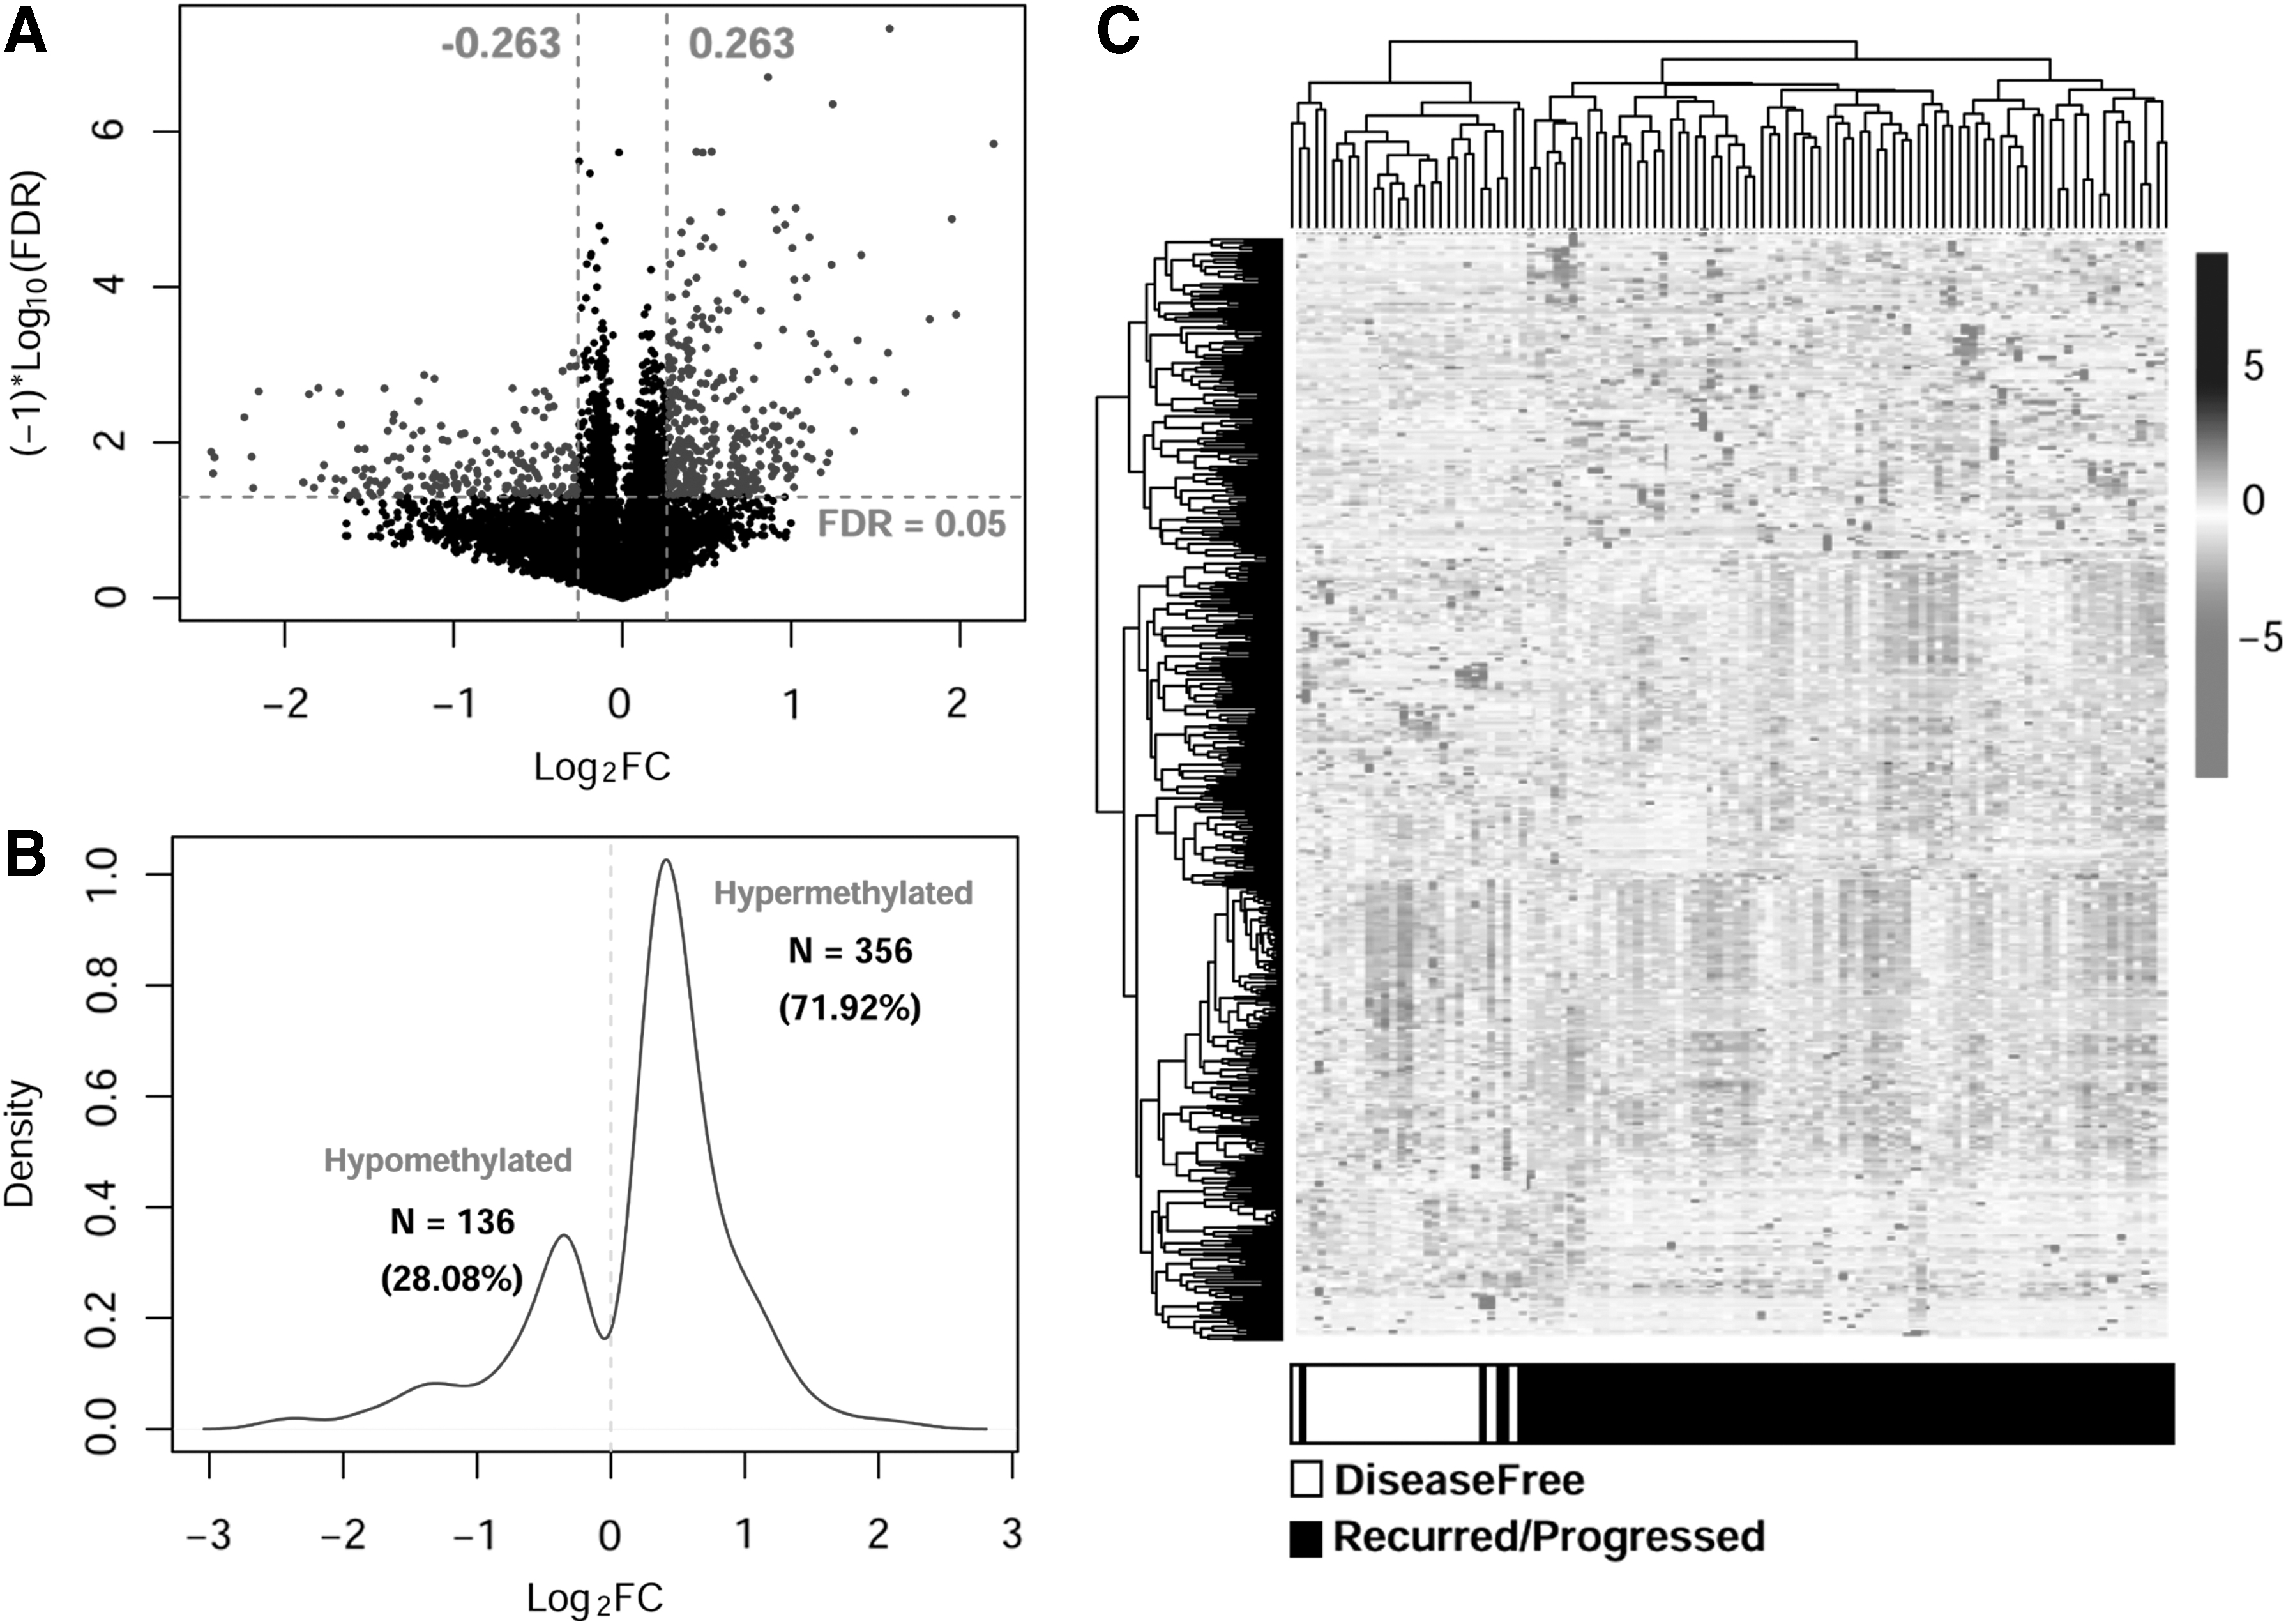
Screening the DMGs with CpG site in glioblastoma.
3.2. Functional enrichment analysis for DMGs
As for these DMGs, the correlation analysis was performed between methylation level and expression level in corresponding samples (Fig. 2). Overall, the expression levels of most DMGs presented a negative correlation to methylation level (PCC = −2435, p < 0.001). Interestingly, there were 246 DMGs that inconsistently exhibited the expression level and methylated level.
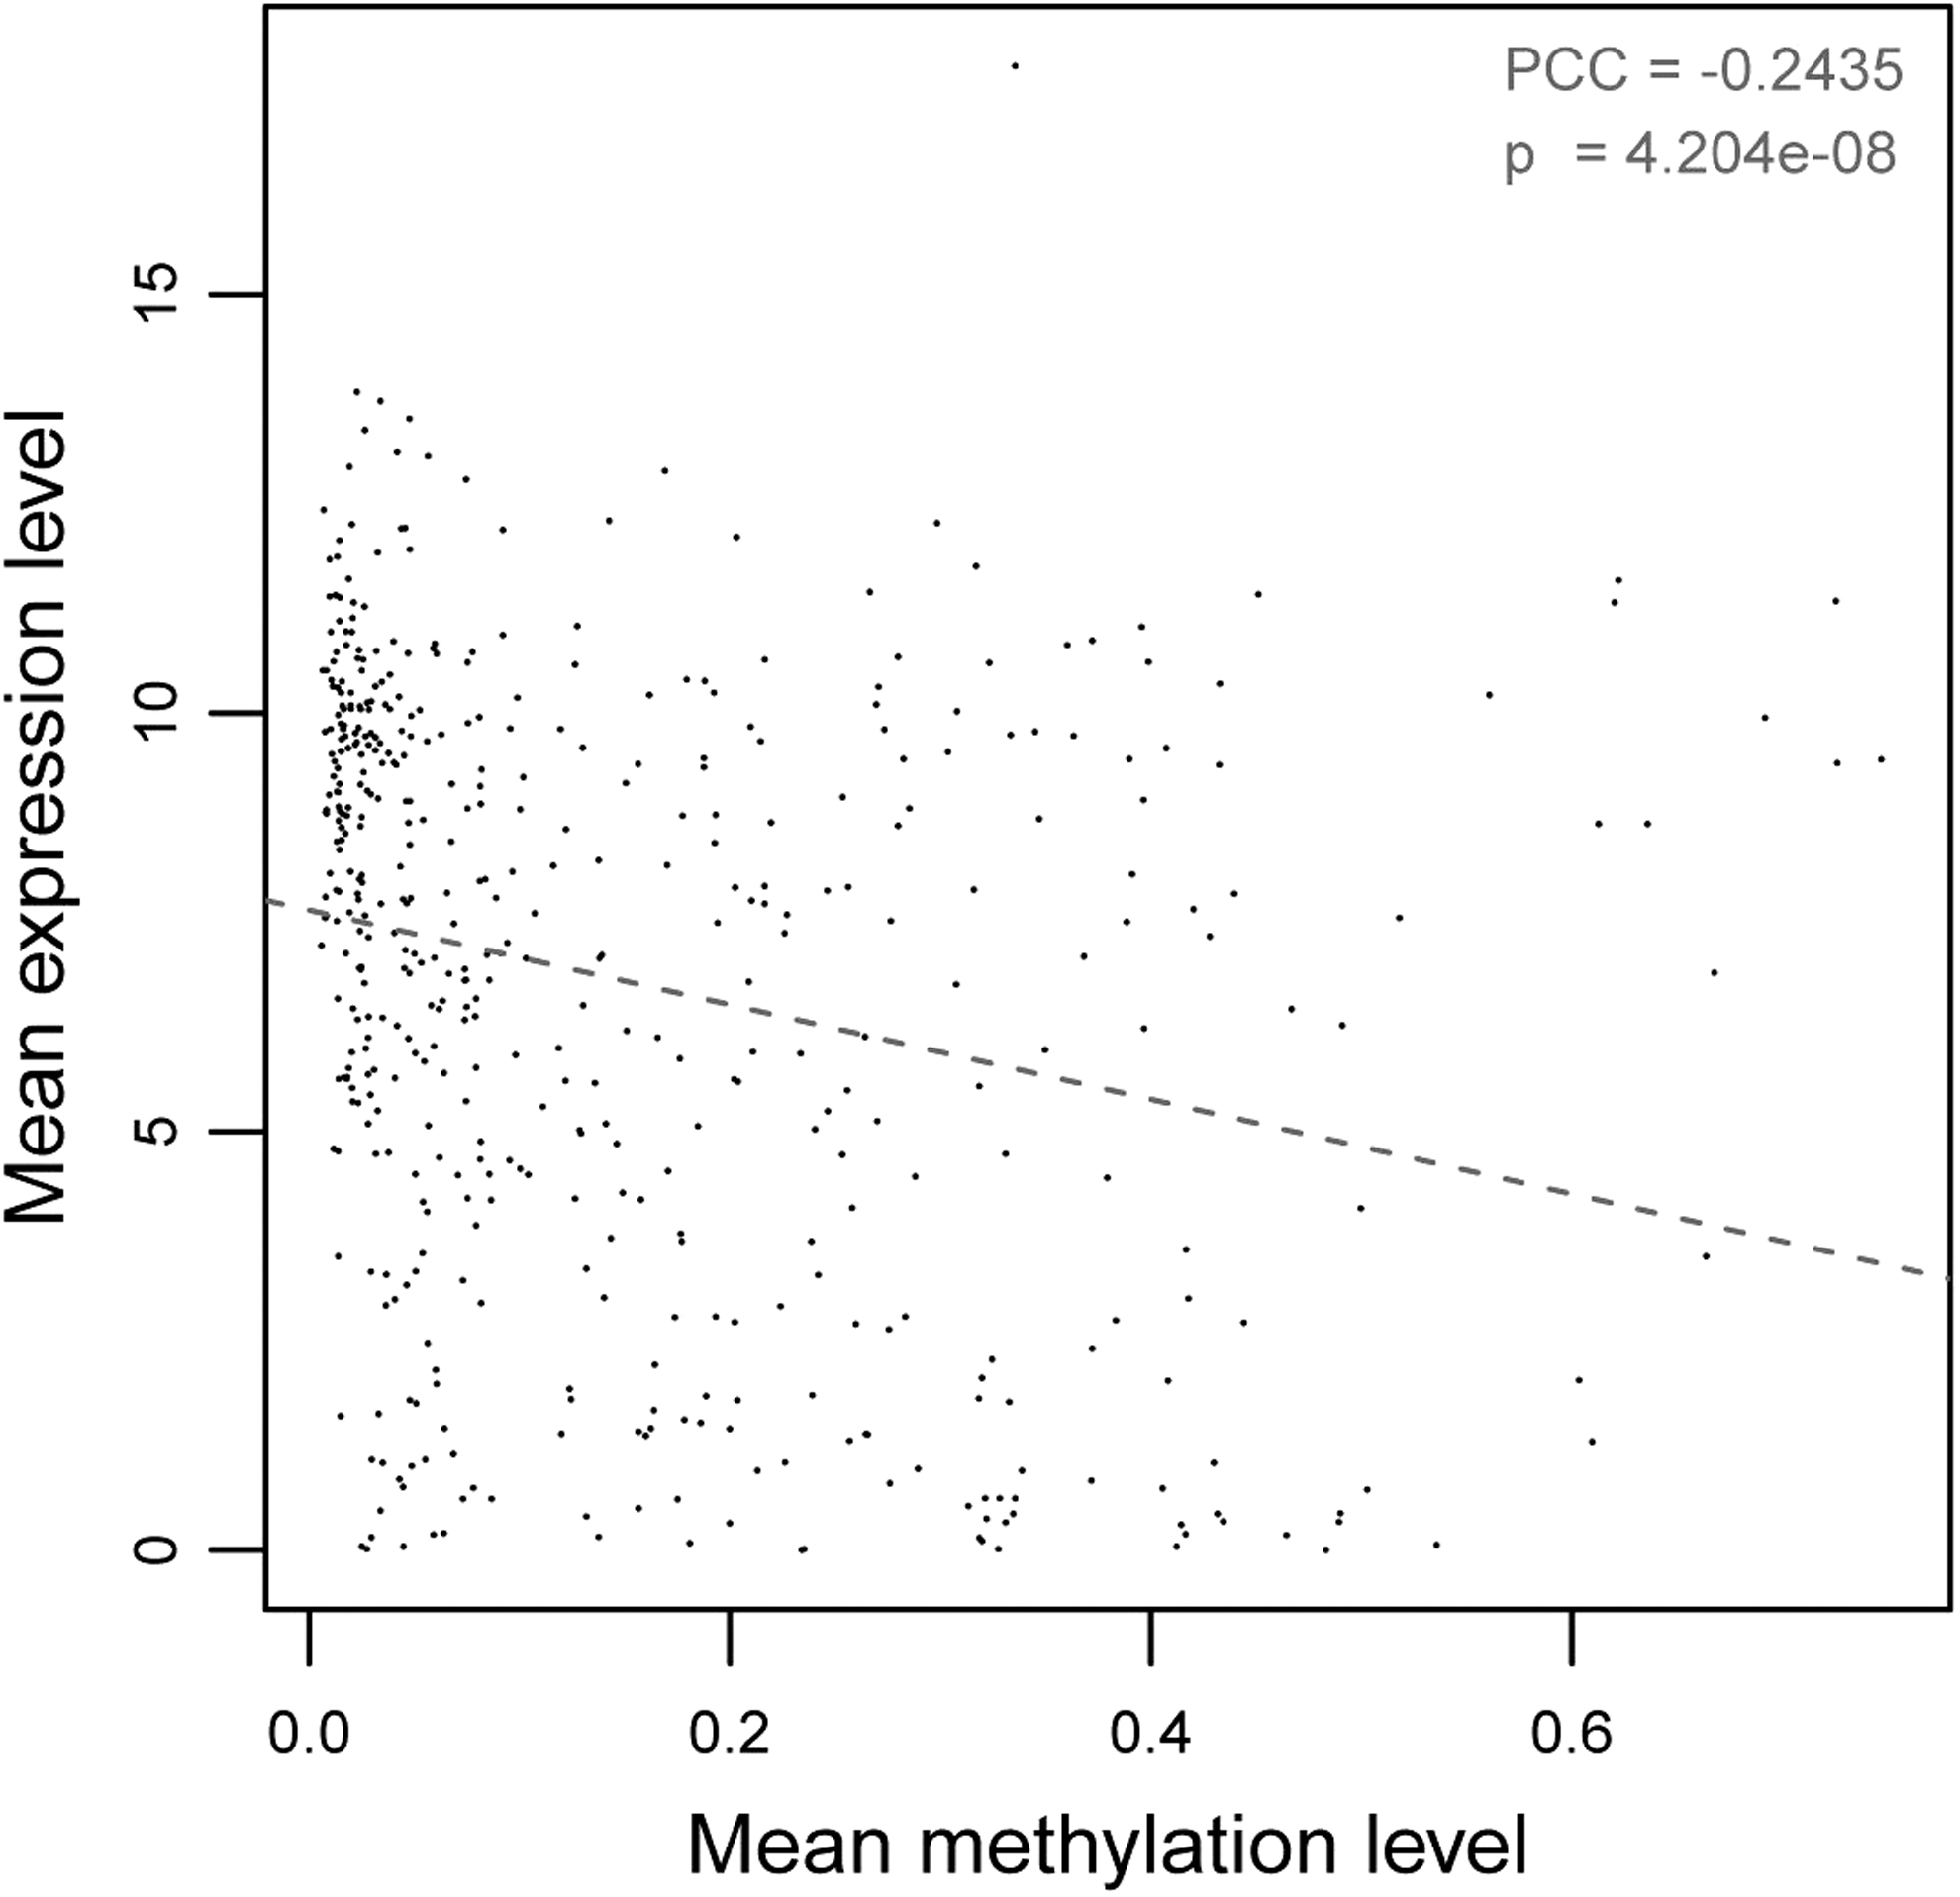
The scatter diagram visualizes the overall correlation analysis between methylation and expression levels of DMGs. The horizontal axis represents the median methylation level, whereas vertical axis represents the median expression level. The line refers to trend line of dot distribution. PCC, Pearson correlation coefficient of methylation and expression level.
Moreover, GO terms and KEGG pathway enrichment analysis were performed for these DMGs using DAVID online tools. A total of 19 biological processes and 5 signaling pathways were identified associated with GBM progression (Fig. 3). GO functional and KEGG pathway analysis was performed using DAVID online tool. The results showed that these DMGs were mainly involved in 19 GO terms and 5 pathways (Table 1). Biological process included negative regulation of gene expression (GO: 0010629, p = 3.20E-02), cell death (GO: 0008219, p = 4.81E-02), sensory organ development (GO: 0007423, p = 2.04E-04), etc. KEGG pathways were associated with neuroactive ligand–receptor interaction (hsa04080: p = 1.46E-02), pathways in cancer (hsa05200: p = 3.08E-02), calcium signaling pathway (hsa04020: p = 9.82E-03), etc.
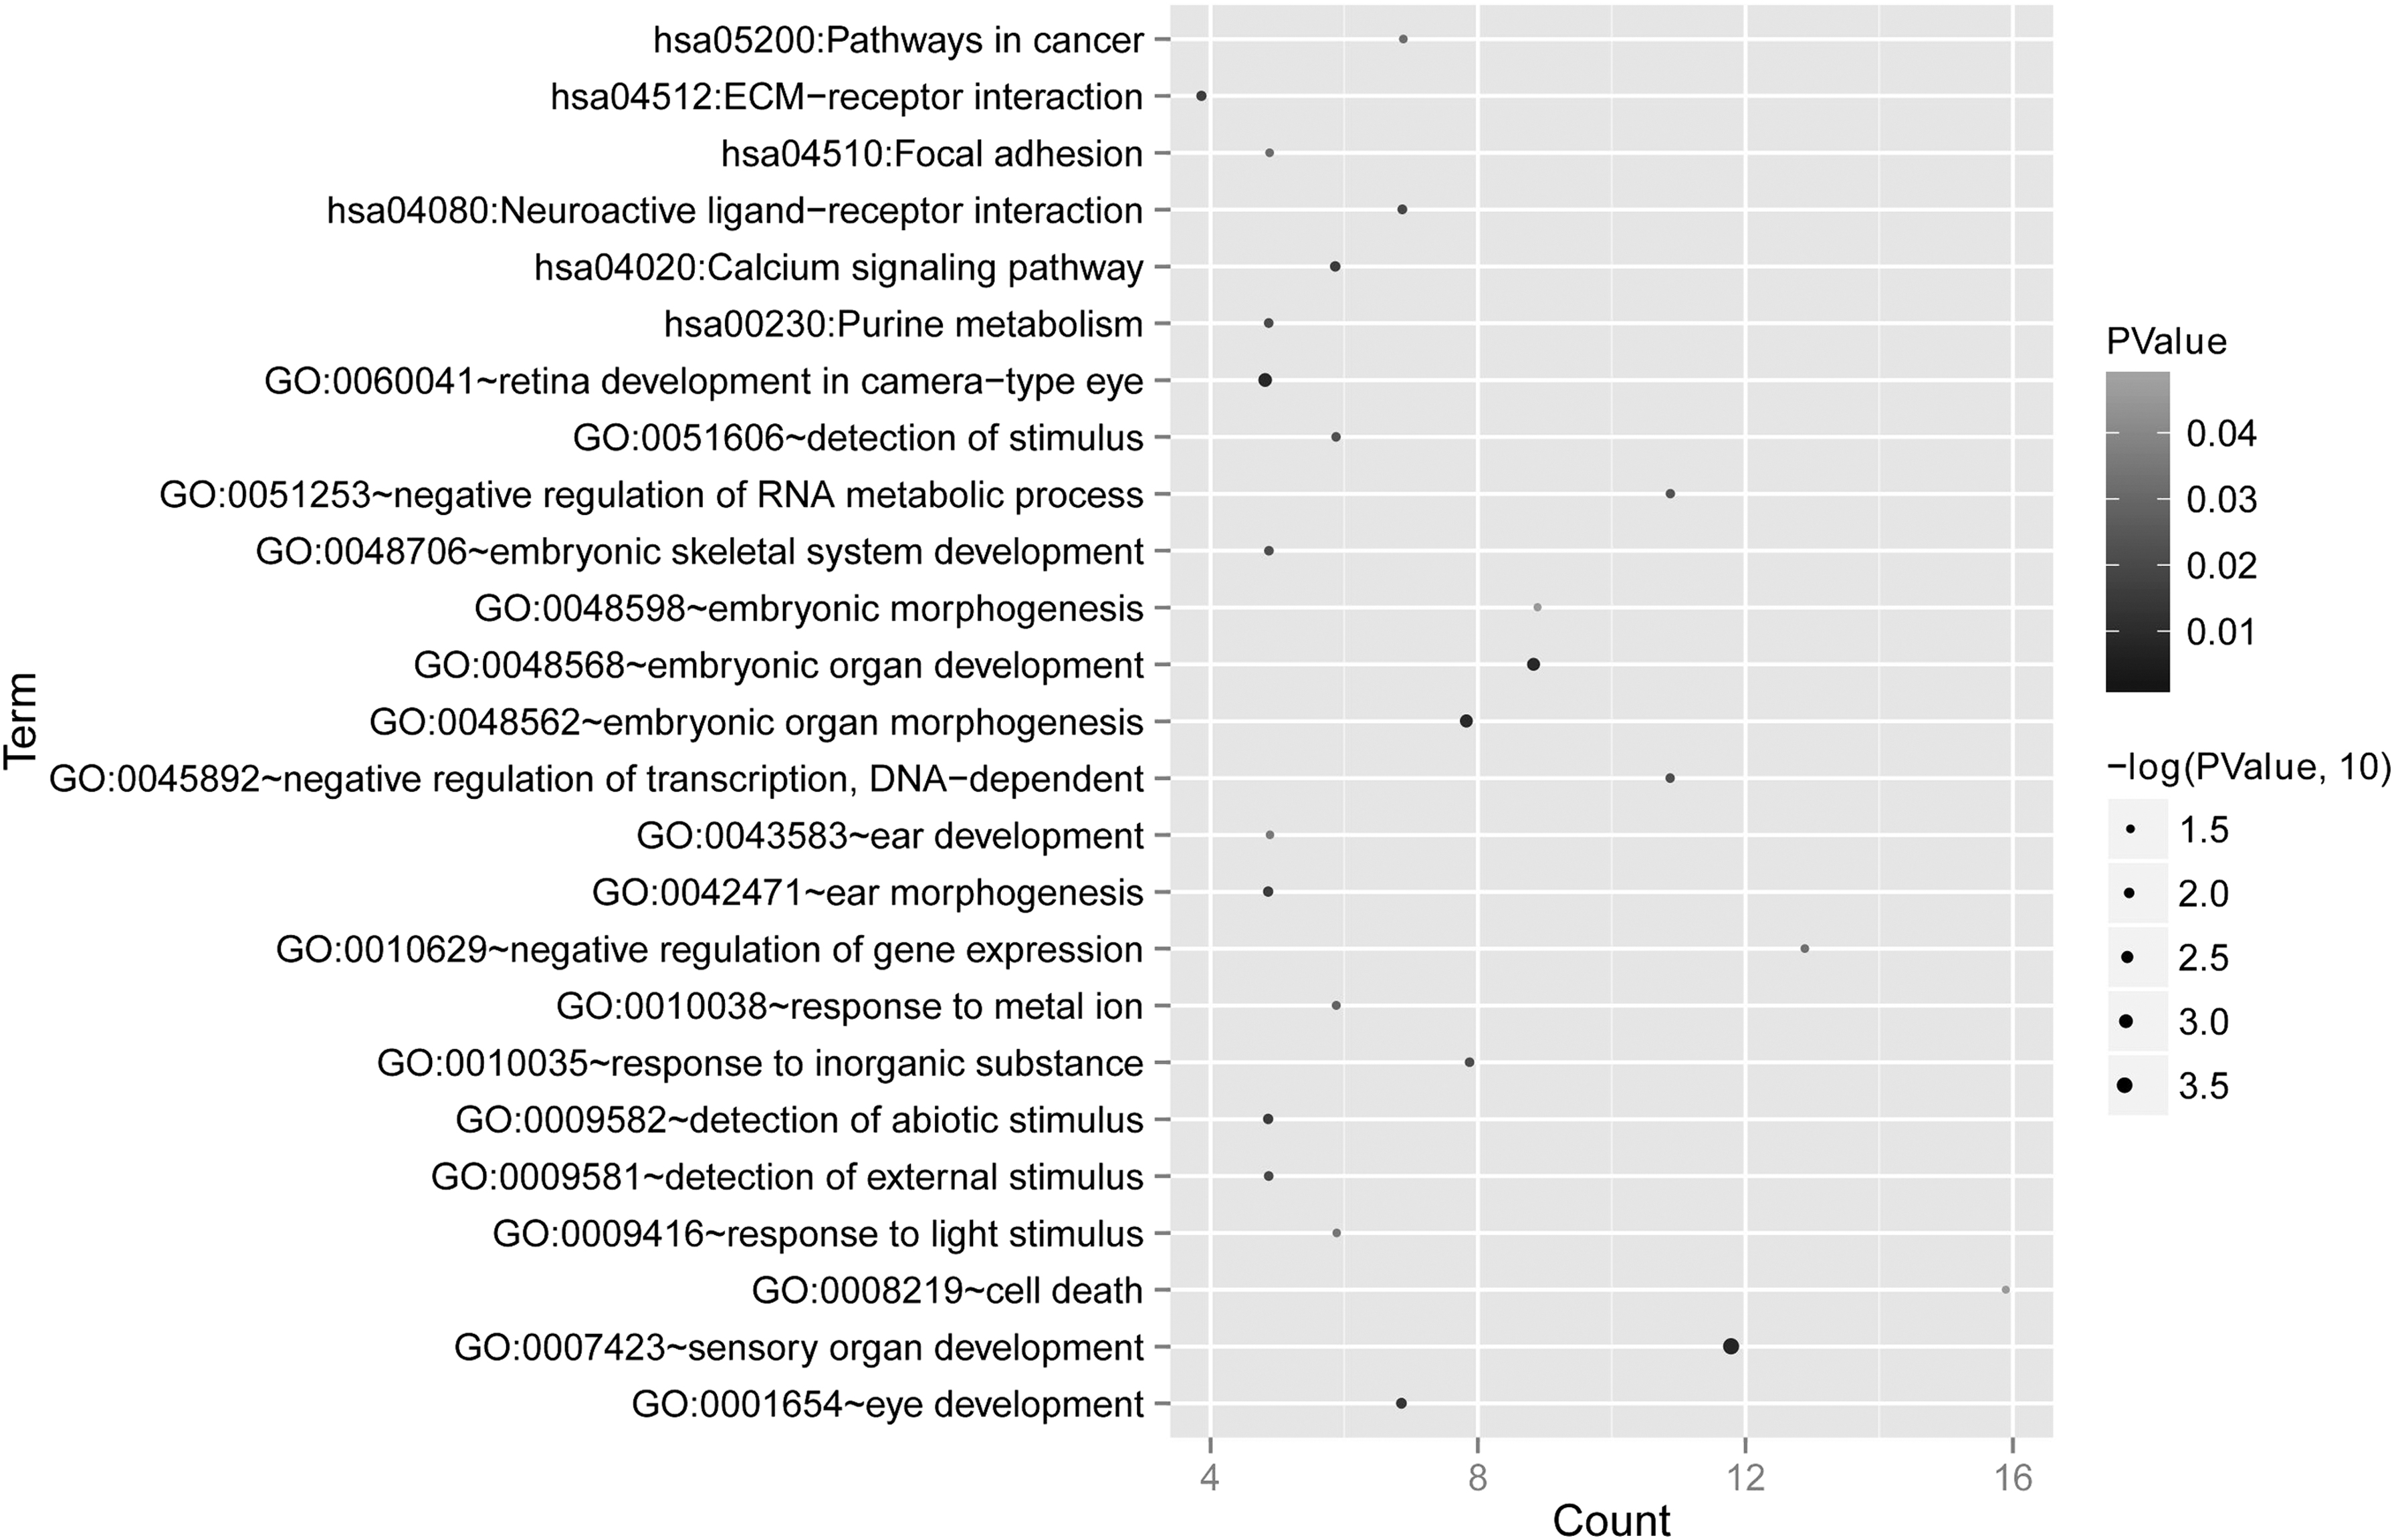
GO and Kyoto Encyclopedia of Genes and Genomes enrichment results for DMGs. The horizontal axis represents the gene number, whereas the vertical axis represents the biological process and signaling pathways. The shade and size of dots represent the FDR value. A larger and darker color of dot represents a more significant difference.
Gene Ontology and Kyoto Encyclopedia of Genes and Genomes Pathway Enrichment Analysis for Differential Methylated Genes in Glioblastoma
ECM, extracellular matrix; GO, Gene Ontology; KEGG, Kyoto Encyclopedia of Genes and Genomes.
3.4. Construction and validation of prognostic model
First, combined with the disease-free survival (DFS) information of samples, we performed the univariate cox regression analysis for these 246 DMGs screened from the previous steps. A total of 69 DMGs were identified associated with survival outcomes of GMB patients. Second, multivariable cox regression analysis was conducted for these genes, and finally five genes were screened as major DMGs with independent prognostic values (Table 2), including ALX homeobox protein 1 (ALX1); KN motif and ankyrin repeat domain-containing protein 1 (KANK1); peroxisomal NADH pyrophosphatase (NUDT12); sushi, nidogen, and EGF-like domains (SNED1); and synaptic vesicle-associated proteins (SVOP).
Identification of Critical Differential Methylated Genes with Independent Prognostic Value in Glioblastoma
CI, confidence interval; HR, hazard ratio.
The correlation of DFS times and methylated status of five genes were analyzed. Patients from data sets were divided into hyper- and hypomethylation groups, whereas the median methylated value was set as cutoff point. Additionally, the Kaplan–Meier curves shown in Figure 4 represented the correlation of overall disease-free survival times between two risk groups. Patients with hypermethylated ALX1 presented longer DFS times. On the contrary, patients with hypomethylated level of KANK1, NUDT12, SNED1, and SVOP exhibited a better prognostic status. As a result, these five DMGs might be major risk factors associated with the progression of GBM.
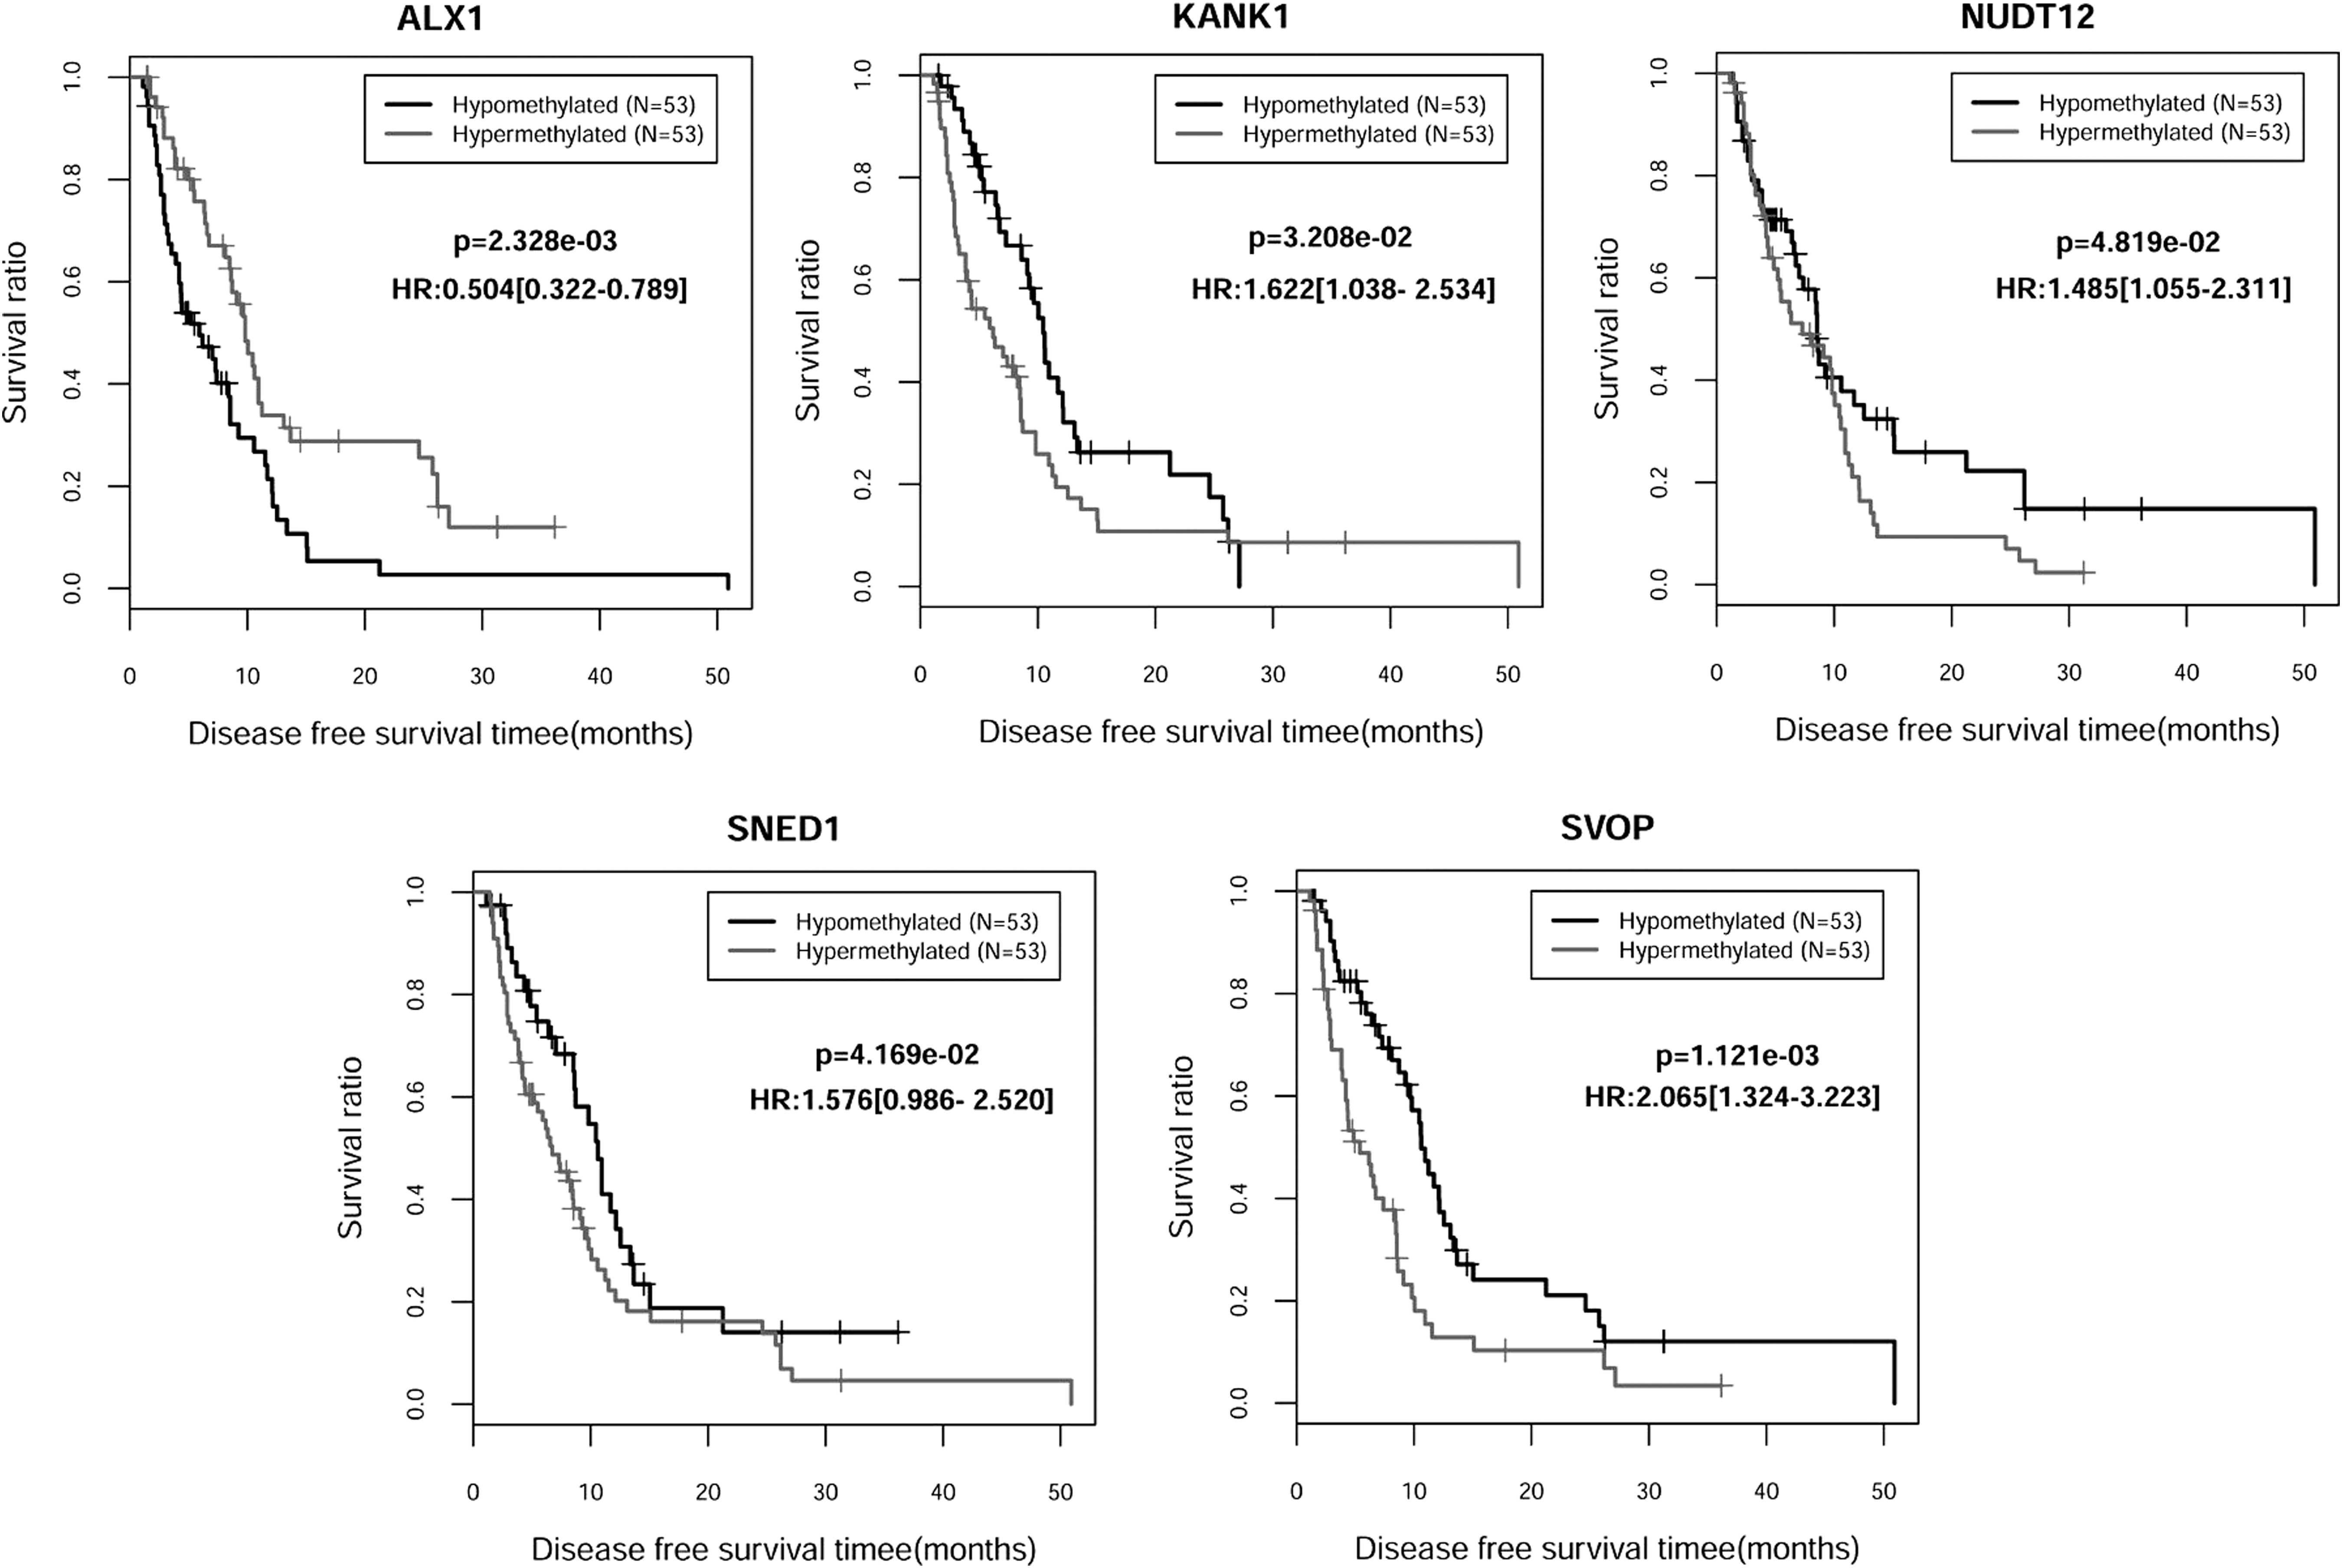
The Kaplan–Meier survival curves visualized the correlation between disease-free survival time and methylation status of five independent prognostic genes. The black and grey curves represent the hypo- and hypermethylated groups, respectively. AUC, area under the curve; DFS, disease-free survival; OS, overall survival.
Based on the coefficient value of DMGs, the risk score prognostic model was constructed as follows:
The risk score of each sample was calculated, which represented the prognostic status. The samples in training data set were divided into high- and low-risk group by setting median risk score as cutoff point. The relationship between risk group classification and survival outcomes of patients were analyzed in the TCGA training data set. The results revealed that patients in the high-risk group exhibited significantly shorter DFS times (n = 104, p < 0.001) and overall survival (OS) times (n = 104, p < 0.05) than patients in the low-risk group (Fig. 5A). Furthermore, the correlation between OS time and risk groups were also evaluated in validation set and the results were consistent with the findings in TCGA data sets (Fig. 5B). Patients in high-risk groups presented shorter OS times than those in low-risk groups (n = 62, p < 0.05). The AUC of training set was 0.947 and that of validation set was 0.808, indicating the high sensitivity and specificity of the risk score model (Fig. 5C).

Validation the survival prediction of risk score-based prognostic model in two independent data sets.
4. Discussion
In this present study, a total of 495 DMGs were identified from recurrent GBM samples compared with disease-free samples, including 356 hypermethylated genes and 139 hypomethylated genes. Functional analysis demonstrated that these DMGs were mainly involved in 19 biological processes and five pathway categories, such as negative regulation of gene expression, cell death, sensory organ development, neuroactive ligand–receptor interaction, calcium signaling pathway, pathways in cancer, etc. After univariate and multivariable cox regression analysis, five genes were finally screened as major DMGs with independent prognostic values in GBM progression, including ALX1, KANK1, NUDT12, SNED1, and SVOP.
Abnormal DNA methylation on gene promoter region is usually associated with tumorigenesis and development. Our study identifies several genes as critical genes and the hyper or hypomethylated status of DMGs were significantly correlated to prognosis in GBMs. Among these genes, ALX1 is also known as Cart1, and it has been confirmed that it is related to neuronal or craniofacial development (Uz et al., 2010). Knockout of ALX1 can result in neural tube closure and limb girdle defective development in mice. Recently, increased number of studies focused on the roles of ALX1 in cancer progression. Yuan et al. reported that ALX1 promoted epithelial-to-mesenchymal transition and invasion in ovarian cancer (Hong et al., 2013). Increased expression of ALX1 was associated with shorter OS of osteosarcoma patients and depletion of ALX1 can result in migration inhibition and induction of cell apoptosis (Yang et al., 2015). DNA methylation microarray analysis results showed that hypermethylation of five genes, including ALX1, was significantly related to shorter relapse-free survival in stage I non-small cell lung cancer (NSCLC) (Juan et al., 2013). Our studies found that hypermethylation of ALX1 was associated with poor prognosis in GBM patients, which was consistent with a previous study of NSCLC. All these findings revealed that aberrant methylation status of ALX1 might induce abnormal gene expression, and is thus involved in GBM development.
KANK1 encodes a protein consisting of four ankyrin repeat domains in C-terminus and is previously reported as a tumor suppressor in renal cell carcinoma (Shubhashish et al., 2002). KANK1 deletions and mutations are also found in several types of human cancers, such as neurofibromas, prostate, pancreatic, and stomach cancers (Kakinuma et al., 2009; Eline et al., 2011; Guangjun et al., 2013). A recent study confirms that upregulation of KANK1 can induce glioma cell apoptosis and block cells in the G1/G0 phase; aberrant expression of KANK1 may result in the change of mitochondrial membrane potential, and the regulation of Bax and Bcl-2, which might promote cytochrome C releasing to activate Caspase-9/-3 (Guo et al., 2014). However, the potential roles of KANK1 gene in GBM progression are fewer demonstrated and our study first identified that abnormal methylation and expression of KANK1 were associated with prognosis of GBMs. Additionally, SNED1 is a human protein first identified as a stroma marker (Leimeister et al., 2010). This protein consists of a nidgen (NIDO) domain, fibronectin type III domains, and calcium-binding EGF-like domains.
A previous study reported that abnormal expression of SNED1 was related to cisplatin resistance in head and neck squamous carcinoma (Yukio et al., 2010). Naba et al. (2014) showed that SNED1 played a causal role in metastasis of human mammary carcinoma. High expression of SNED1 and LTBP3 was involved in poor outcome of ER−/PR− breast cancer patients. In this present study, we demonstrated a significant correlationship between SNED1 methylation and survival outcome of GBM patients. Based on these findings, we suggested that SNED1 might serve as a novel prognostic biomarker and contributed to tumor progression in GBM.
Moreover, human NUDT12 is an enzyme that belongs to Nudix hydrolase family. Like other NADH diphosphatases, NUDT12 can hydrolyze NADPH to NMNH and AMP efficiently, and diadenosine diphosphate to AMP (Abdelraheim et al., 2003). Nudix hydrolases are a superfamily of hydrolytic enzymes. Some superfamily members, such as NUDT1, NUDT6, and NUDT21, have been previously implicated in glioma (Mark et al., 2012; Tu et al., 2016; Lou et al., 2017), whereas the function of NUDT12 in human cancer was still unclear. Notably, SVOP is an evolutionarily conserved synaptic vesicle protein expressed in developing nervous system (Janz et al., 1998; Logan et al., 2010).
SVOP was also a transporter-like protein similar with synaptic vesicle protein 2 localized to neurotransmitter-containing vesicles (Yao and Bajjalieh, 2009). Expression of SVOP in Xenopus nervous system development indicated that it may be involved in neuron formation, maturation, and neuronal function (Logan et al., 2010). Researchers of another article identified SVOP as a central nervous system-specific gene in mouse and may play a role in gene regulation of neuronal cells (Cho et al., 2009). In this study, we screened a cohort of DMGs in GBM patients and these genes were involved in biological processes of sensory organ development and neuroactive ligandreceptor interaction. Moreover, patients with hypomethylation of SVOP presented a shorter survival time. Considering this, we suggested that aberrant methylated status of SVOP might be a major role in regulation of nervous system, and thus associated with progression of GBM.
In addition, there are some limitations in our study. First, the function of these DMGs in glioma development was fewer reported and further experiments were needed to verify the potential molecular mechanisms. Second, only 155 GBM patients were included in the training data sets, thus more tumor samples and corresponding clinical information should be concerned.
In summary, our study identified several novel tumor biomarkers in GBM according to the methylation-based prognostic model, including ALX1, KANK1, NUDT12, SNED1, and SVOP. The aberrant expression and methylation status of these genes were associated with prognosis in GBMs. Our study raises a novel and feasible prognostic model for investigating the mechanism of GBM.
Footnotes
Author Disclosure Statement
The authors declare they have no competing financial interests.