
Abstract
Abstract
Topologically associating domains (TADs) are the most fundamental elements and significant structures of the eukaryotic genome. Currently, algorithms have been developed to find the TADs. But few algorithms are reported to compare the similarity of TADs between genomes. In this study, mice Hi-C sequencing data of four contrasts were enrolled. Seventeen algorithms, including BPscore, Jaccard index (JI) distance, VI distance, image hash, image subtraction, image variance, and so on, were used to quantify the genomic similarity of TADs. Image subtraction, Euclidean distance, and Manhattan distance were significantly better for TAD difference detection than the others. Deferent Hash (dHash) with the best zoom size ranked the second, followed by improved Hamming distance algorithm and JI distance. Advantages and disadvantages of various algorithms for quantifying the similarity of TADs were compared. Our work could provide the fundament for TADs comparison.
1. Introduction
With the rise of three-dimensional (3
The 3D structure of eukaryotic genome is complex. In the nucleus, DNA contains one or more genes, and regulatory elements can be spaced apart to form topologically associating domains (TADs) (Chait, 2011). An open or a closed area of chromatin structure alternately forms A or B compartment associated with function, respectively (Lieberman-Aiden et al., 2009; Chait, 2011). As a result of random collisions, two remote gene loci will be identified to each other at higher frequencies. The loop spatial conformation of remote transcriptional regulation and the complex network structure was observed (Risca and Greenleaf, 2015; Schmitt et al., 2016).
As the most fundamental and important elements of eukaryotic genome structure (Wang et al., 2018), the TADs were first defined in 2012 (Dixon et al., 2012). The cooperative relationship between the region and structural protein factor CTCF (CCCTC-Binding factor) was further identified (Dixon et al., 2012). In 2017 the concept of chromatin loops was proposed, which was considered as the smallest unit of genetic regulation (Yu and Ren, 2017). 3D genome of multiple myeloma revealed spatial genome disorganization associated with copy number variations by Wu et al. (2017). TADs were found to be conserved between insect and mammalian by Wang et al. in 2018 (Wang et al., 2018).
The important progress of TAD research can't be separated from the development of related algorithms. DomainCaller (Dixon et al., 2012) based on Hidden Markov (HHM) was the first developed algorithm for TAD calling, which was put forward by Dixon et al. Arrowhead (Rao et al., 2014; Durand et al., 2016), Armatus (Filippova et al., 2014), TADtree (Weinreb and Raphael, 2016), TADbit (Serra et al., 2017), and other algorithms were proposed shortly. However, few algorithms were developed for TAD similarity quantization. Among them, Jaccard index (JI) distance (Dixon et al., 2012) and information entropy (VI distance) (Filippova et al., 2014) were classical algorithms. The JI was mainly to quantify the similarity of the TADs by comparing the degree of overlap of the TAD boundaries. And the information entropy mainly measured the variation between the information. However, the new algorithms for comparing TAD similarity were not proposed until 2018. BPscore (Zaborowski and Wilczynski, 2019) was put forward for meaningful comparisons of structural chromosome segmentations. An algorithm for quantifying the similarity of topological domains across normal and cancer human cell types was also proposed by Sauerwald and Kingsford (2018).
Although some algorithms were developed to compare the similarity of TADs, comparison between these algorithms has not been reported, hitherto. Therefore, the existing TAD similarity quantization algorithms and improved algorithms based on the existing algorithms were compared in this study. These days TADs could be visualized. Therefore, various algorithms were compared from the point of image similarity. This study is the first systematic research to compare different algorithms for quantifying the similarity of TADs.
2. Methods
2.1. Data
Four sets of publicly released Hi-C data from GEO (Gene Expression Omnibus, GSM862720, GSM862721, GSM862722, GSM892304) were downloaded as test data in this study (Dixon et al., 2012). According to the differences in the experimental operation, the four samples downloaded from GEO were combined into four groups. They were identical sample pairs, biological duplicate sample pairs, different endonuclease sample pairs, and different cell line sample pairs, as summarized in Table 1. Hi-C Pro (version 2.10.0) (Servant et al., 2015) pipeline was used to generate Hi-C maps at 40 kb resolution. Default parameters were used. DomainCaller (Dixon et al., 2012) was used to identify TADs. All TADs were visualized with R package HiTC (Servant et al., 2012).
Hi-C Sample Pairs Used for Analysis
2.2. Overview of the methods
Seventeen algorithms were used to quantify the similarity of TADs, as summarized in Table 2. Details of various algorithms can be found in the Supplementary Data. Seventeen algorithms were divided into four categories according to their properties. The first was classic algorithms used widely and reported repeatedly, mainly including BPscore, JI distance, and VI distance. Sequence-based statistical algorithms were second quantized similarity from the distance between sequences, which were improved based on BPscore. The third category contained image hash algorithms, followed by image statistical algorithms quantifying TAD similarity from image subtraction, variance, various distance, and similarity. All the algorithms were implemented by Python 3.5.
Methods to Quantify the Similarity of Topological Domains Used in This Comparison
Theoretically, the similarity of TADs was supposed to decrease step by step from the first sample pair to the fourth sample pair, while the distance and variance were supposed to increase gradually. This was also a criterion to evaluate the performance of the algorithms to quantify TAD similarity. So the consistence of the various algorithms, which equaled to the total number of data that the similarity of TADs was decreasing or distance was increasing step by step from the first sample pairs to the fourth sample pairs divide by the total number of the data, was calculated to evaluate their merits and demerits.
2.3. Findings
2.3.1. The results of classic algorithms
Three classic algorithms were compared in the first category, including BP distance, VI distance based on information entropy, and JI distance based on the JI, respectively. Three algorithms were applied to quantify four groups of TADs set in Table 2. In theory, from group 1 to group 4, the distance between groups increased in turn. The results of BP distance algorithm revealed that only 7 of the 19 chromosomes illustrated incremental trend from group 1 to group 4 (Fig. 1a). Similarly, VI distance results showed an increasing trend of eight chromosomes from group 1 to group 4 (Fig. 1a). JI distance was one of the most widely used methods to quantify the similarity of TADs, which performed superior. Of the 19 chromosomes, 14 showed an increasing trend from group 1 to group 4 (Fig. 1a). The consistence rate of JI distance is 73.68% (Fig. 6a). Trend of these three algorithms was visualized. In terms of the overall data density distribution, BP distance and VI distance were not as effective as JI distance in differentiating TAD pairs with smaller differences. The distribution of VI and BP was similar, in contrast to JI. On the whole, only JI distance displayed an obvious increasing trend from group A to group D among the three algorithms (Fig. 1b). These results suggested that JI distance excelled BP distance and VI distance in quantifying TAD similarity among the three classic algorithms.

The results of classic algorithms.
2.3.2. The results of sequence-based statistical algorithms
The highest consistence rate of the three algorithms provided by classic algorithms was only 73.68%. A method to normalize two TAD sets of different lengths to the same length was provided by BPscore. Therefore, improved algorithms based on BPscore were proposed. In this part, hamming distance, Euclidean distance, and Chebyshev distance were applied to quantify the similarity of TAD set, respectively. The results of hamming distance were the most satisfactory. Sixteen out of the 19 chromosomes presented an increasing trend from group 1 to group 4 (Fig. 2a). The consistence rate reached 84.21% (Fig. 6a), which was 10.53% higher than JI distance. Euclidean distance and Chebyshev distance did marginally worse. Only eight chromosomes from group 1 to group 4 displayed a raise tendency (Supplementary Fig. S1a). The same conclusion can be drawn from the distribution data of various algorithms in different groups (Fig. 2b). In summary, hamming distance was better than Euclidean distance, Chebyshev distance in quantifying the genomic similarity of TADs.
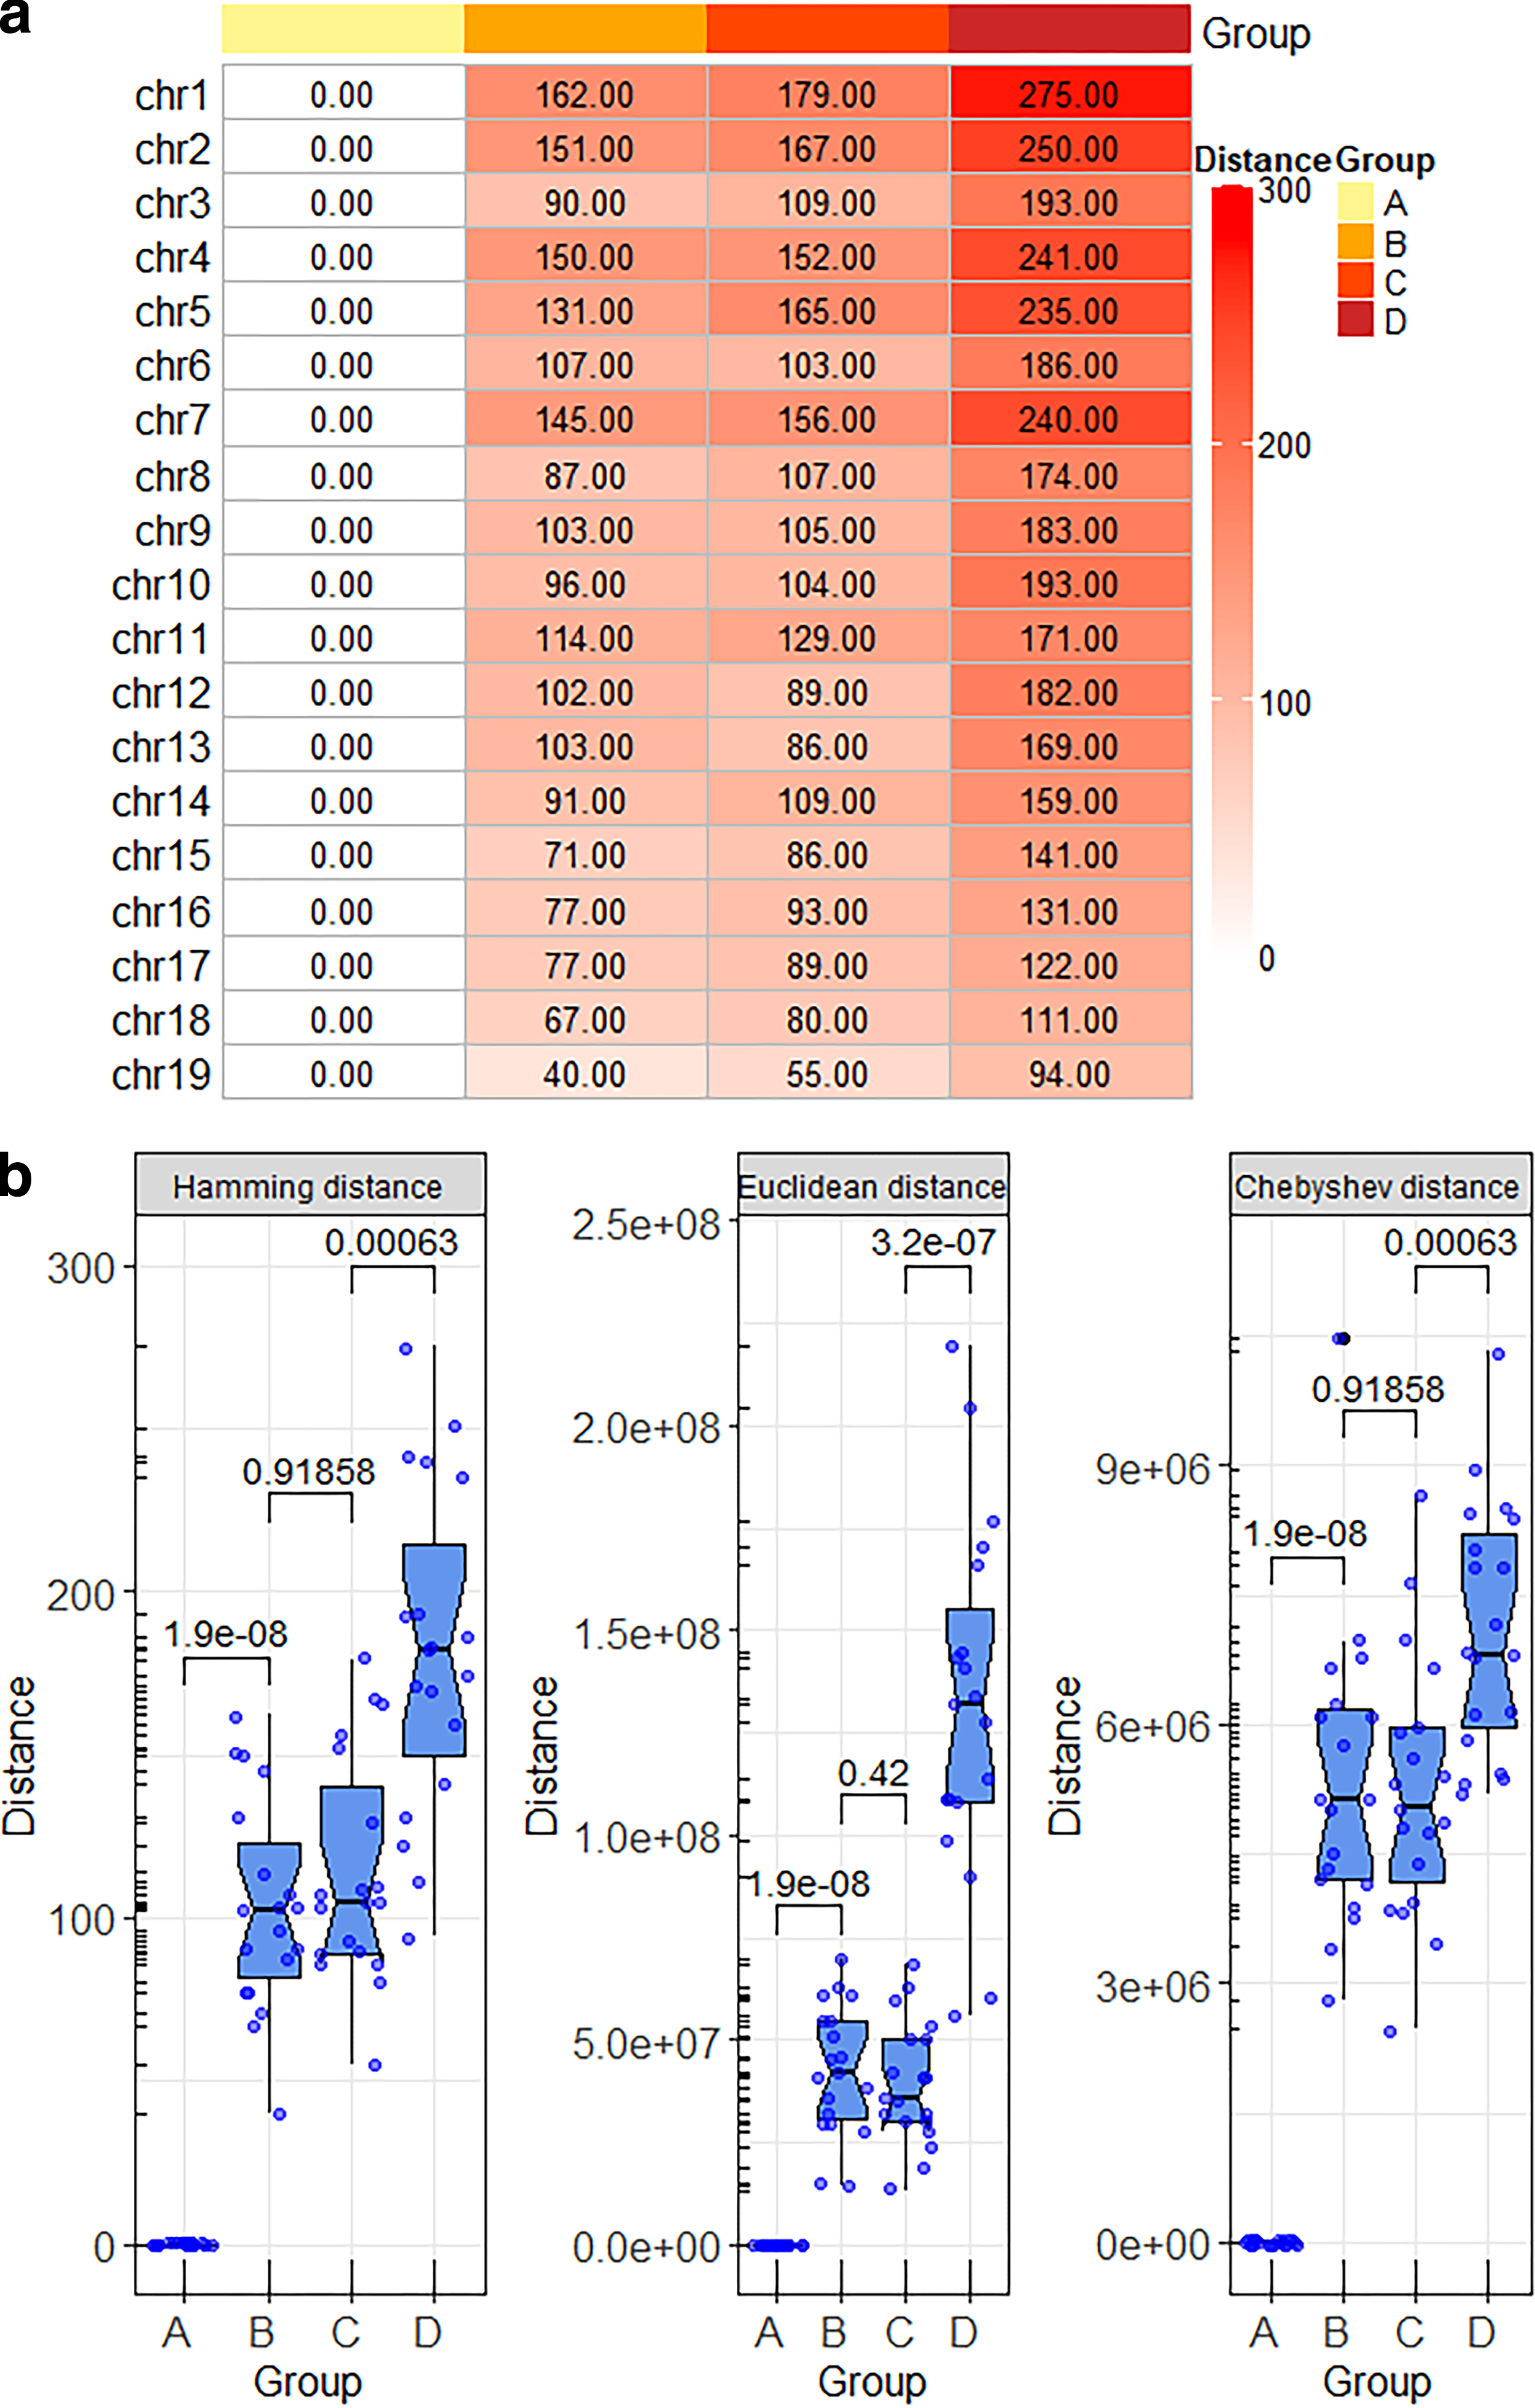
The results of sequence-based statistical algorithms.
2.3.3. The results of image hash algorithms
In this part, the four groups of TAD dataset in Table 2 were visualized. A TAD image can be generated from each chromosome. The mouse genome consists of 19 chromosomes except sex chromosomes. Therefore, 76 pairs of TAD images were generated from 4 groups. Then OpenCV 4.0.1 of Python 3.5 was used to scale and grayscale the image. For each pair of images, Average Hash (aHash), Deferent Hash (dHash), and Perceptual Hash (pHash) algorithms were used to test similarity of each pair. The images were scaled to nine different zoom sizes, when testing the three image hash algorithms. The resolutions of 8 × 8, 16 × 16, 32 × 32, 64 × 64, 128 × 128, 256 × 256, 480 × 480 (original size), 512 × 512, and 1024 × 1024 were enrolled, respectively.
The consistence rate of the three algorithms was less than 15% when the image was scaled to 8 × 8. Only three chromosomes showed an increasing trend from group 1 to group 4 in dHash. As the size of the scale rose, the information of the image retained increased (Supplementary Fig. S1b–d). Thus, the similarity tendency and consistence were promoted gradually. 128 × 128 was the best zoom size for aHash with 14 chromosomes showing consistence trend (Fig. 3a). 512 × 512 was the best zoom size for dHash with 18 chromosomes showing consistence trend, as well as 256 × 256. And the best zoom size of pHash was 512 × 512 with nine chromosomes showing consistence trend (Fig. 3b). The consistence trend was decreasing when zoom size was amplified to 1024 × 1024 (Fig. 3a). These results illustrated that the more details of each group of images were retained, the more the similarity of TAD images can be quantified. In conclusion, 512 × 512 was the best zoom size for TAD images. The consistence rate of aHash, dHash, and pHash was 68.42%, 94.74%, and 47.37%, respectively (Fig. 3b). aHash and dHash were superior to pHash in distinguishing images (Fig. 3c).

The results of image hash algorithms.
2.3.4. The results of image statistical algorithms
In this part, the four groups of TAD dataset in Table 2 also were visualized. Then these images were grayed by OpenCV 4.0.1 of Python 3.5. Then image statistical algorithms were applied to quantify the similarity of TADs.
The differences and similarities were reflected by differentiating all corresponding pixels for each pair of images, which was defined as image subtraction. Variance recorded the main information of the image. Fluctuation of pixel features can be impactfully reflected by variance. Therefore, image subtraction and image variance were applied to quantify TAD similarity.
Image subtraction was a unique choice for the similarity comparison of TAD images from the test results (Fig. 4a). The consistence of the algorithm reached 100% (Fig. 6a). Only 6 of the 19 chromosomes revealed a rising trend from group 1 to group 4 using image variance method (Fig. 4a), and the consistence was only 31.58% (Fig. 6a). From the view of the whole data distribution, the results of image subtraction were more concentrated. The results of image variance method were scattered. And the data of group B and group C fluctuated greatly (Fig. 4b). Compared with the method of image variance, image subtraction bettered.
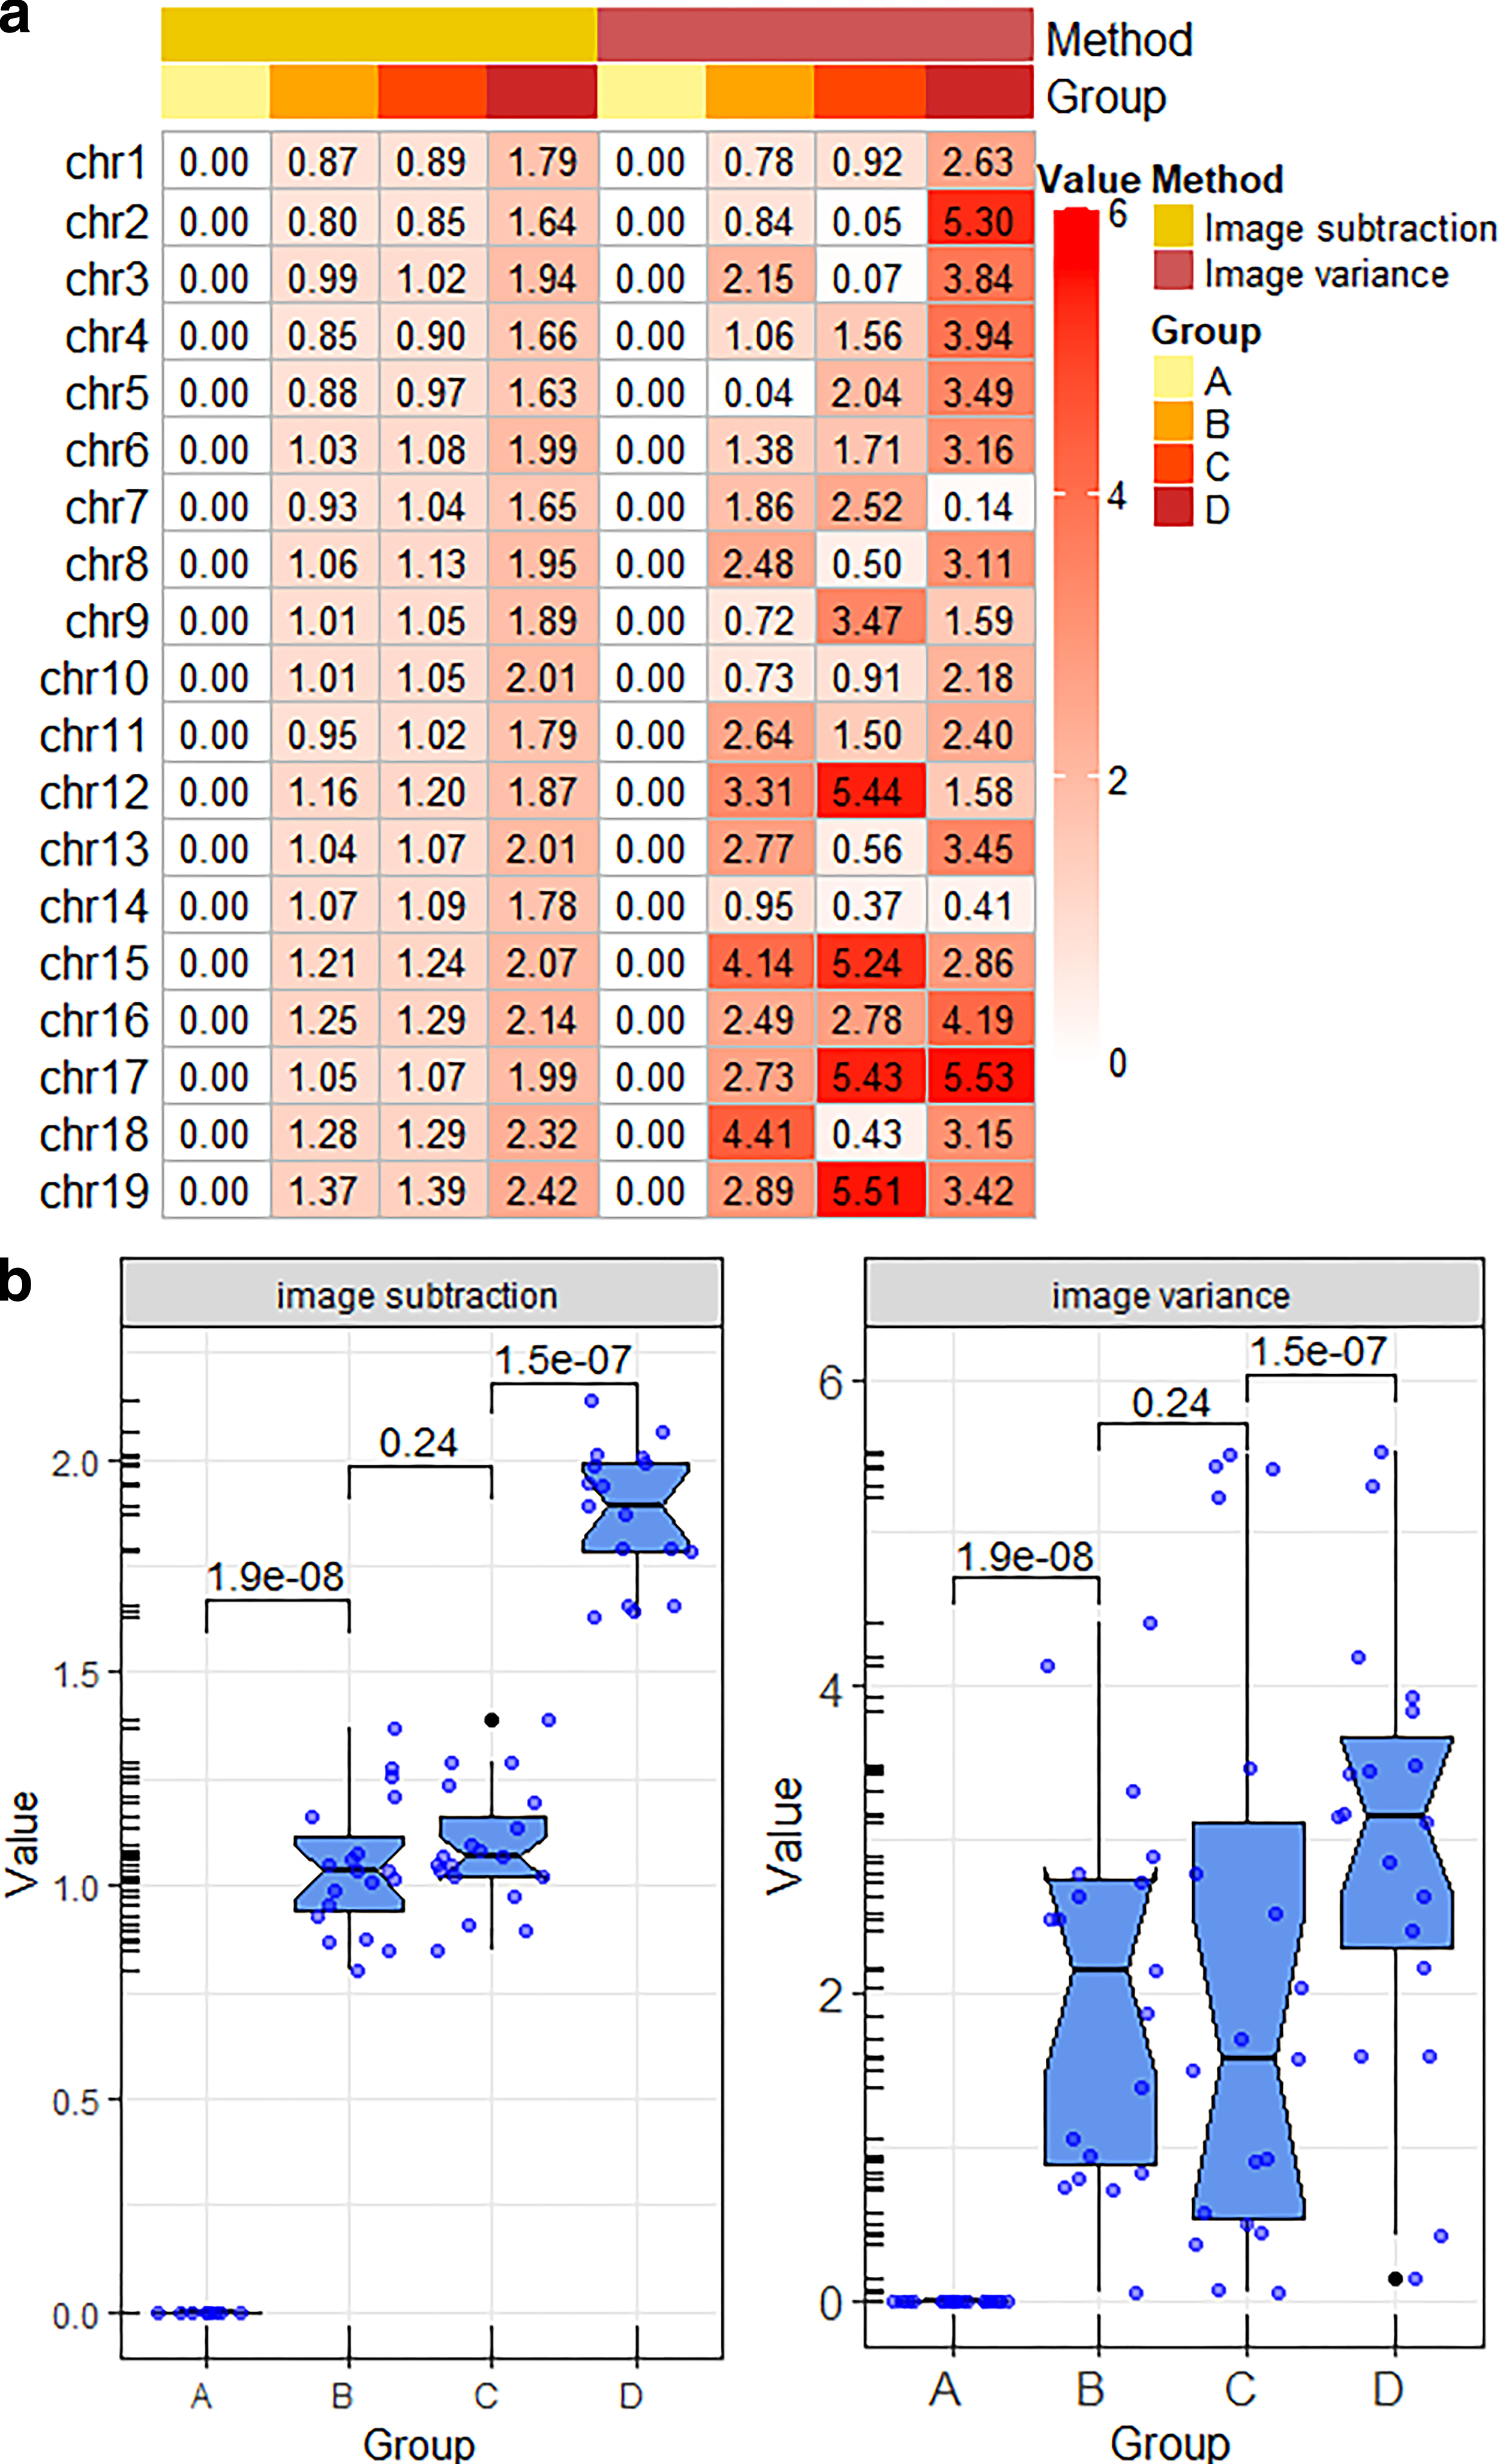
The results of image subtraction and image variance.
Two kinds of distances and four kinds of similarity were primarily selected to quantify the similarity of TAD images from the view of statistical algorithms. The results revealed that the Euclidean distance and the Manhattan distance were better. There were 19 chromosomes from group 1 to group 4 that exhibited a rising trend in turn (Fig. 5a). The consistence of these algorithms was 100% (Fig. 6a). The overall data distribution also revealed the same conclusion (Fig. 5b). However, the performance of Chebyshev distance, hamming distance, Jaccard similarity, Pearson correlation coefficient, and cosine similarity was not as good as Euclidean distance and the Manhattan distance. Thus, these algorithms were inefficient to quantify the similarity of TAD images due to their low consistence rate.
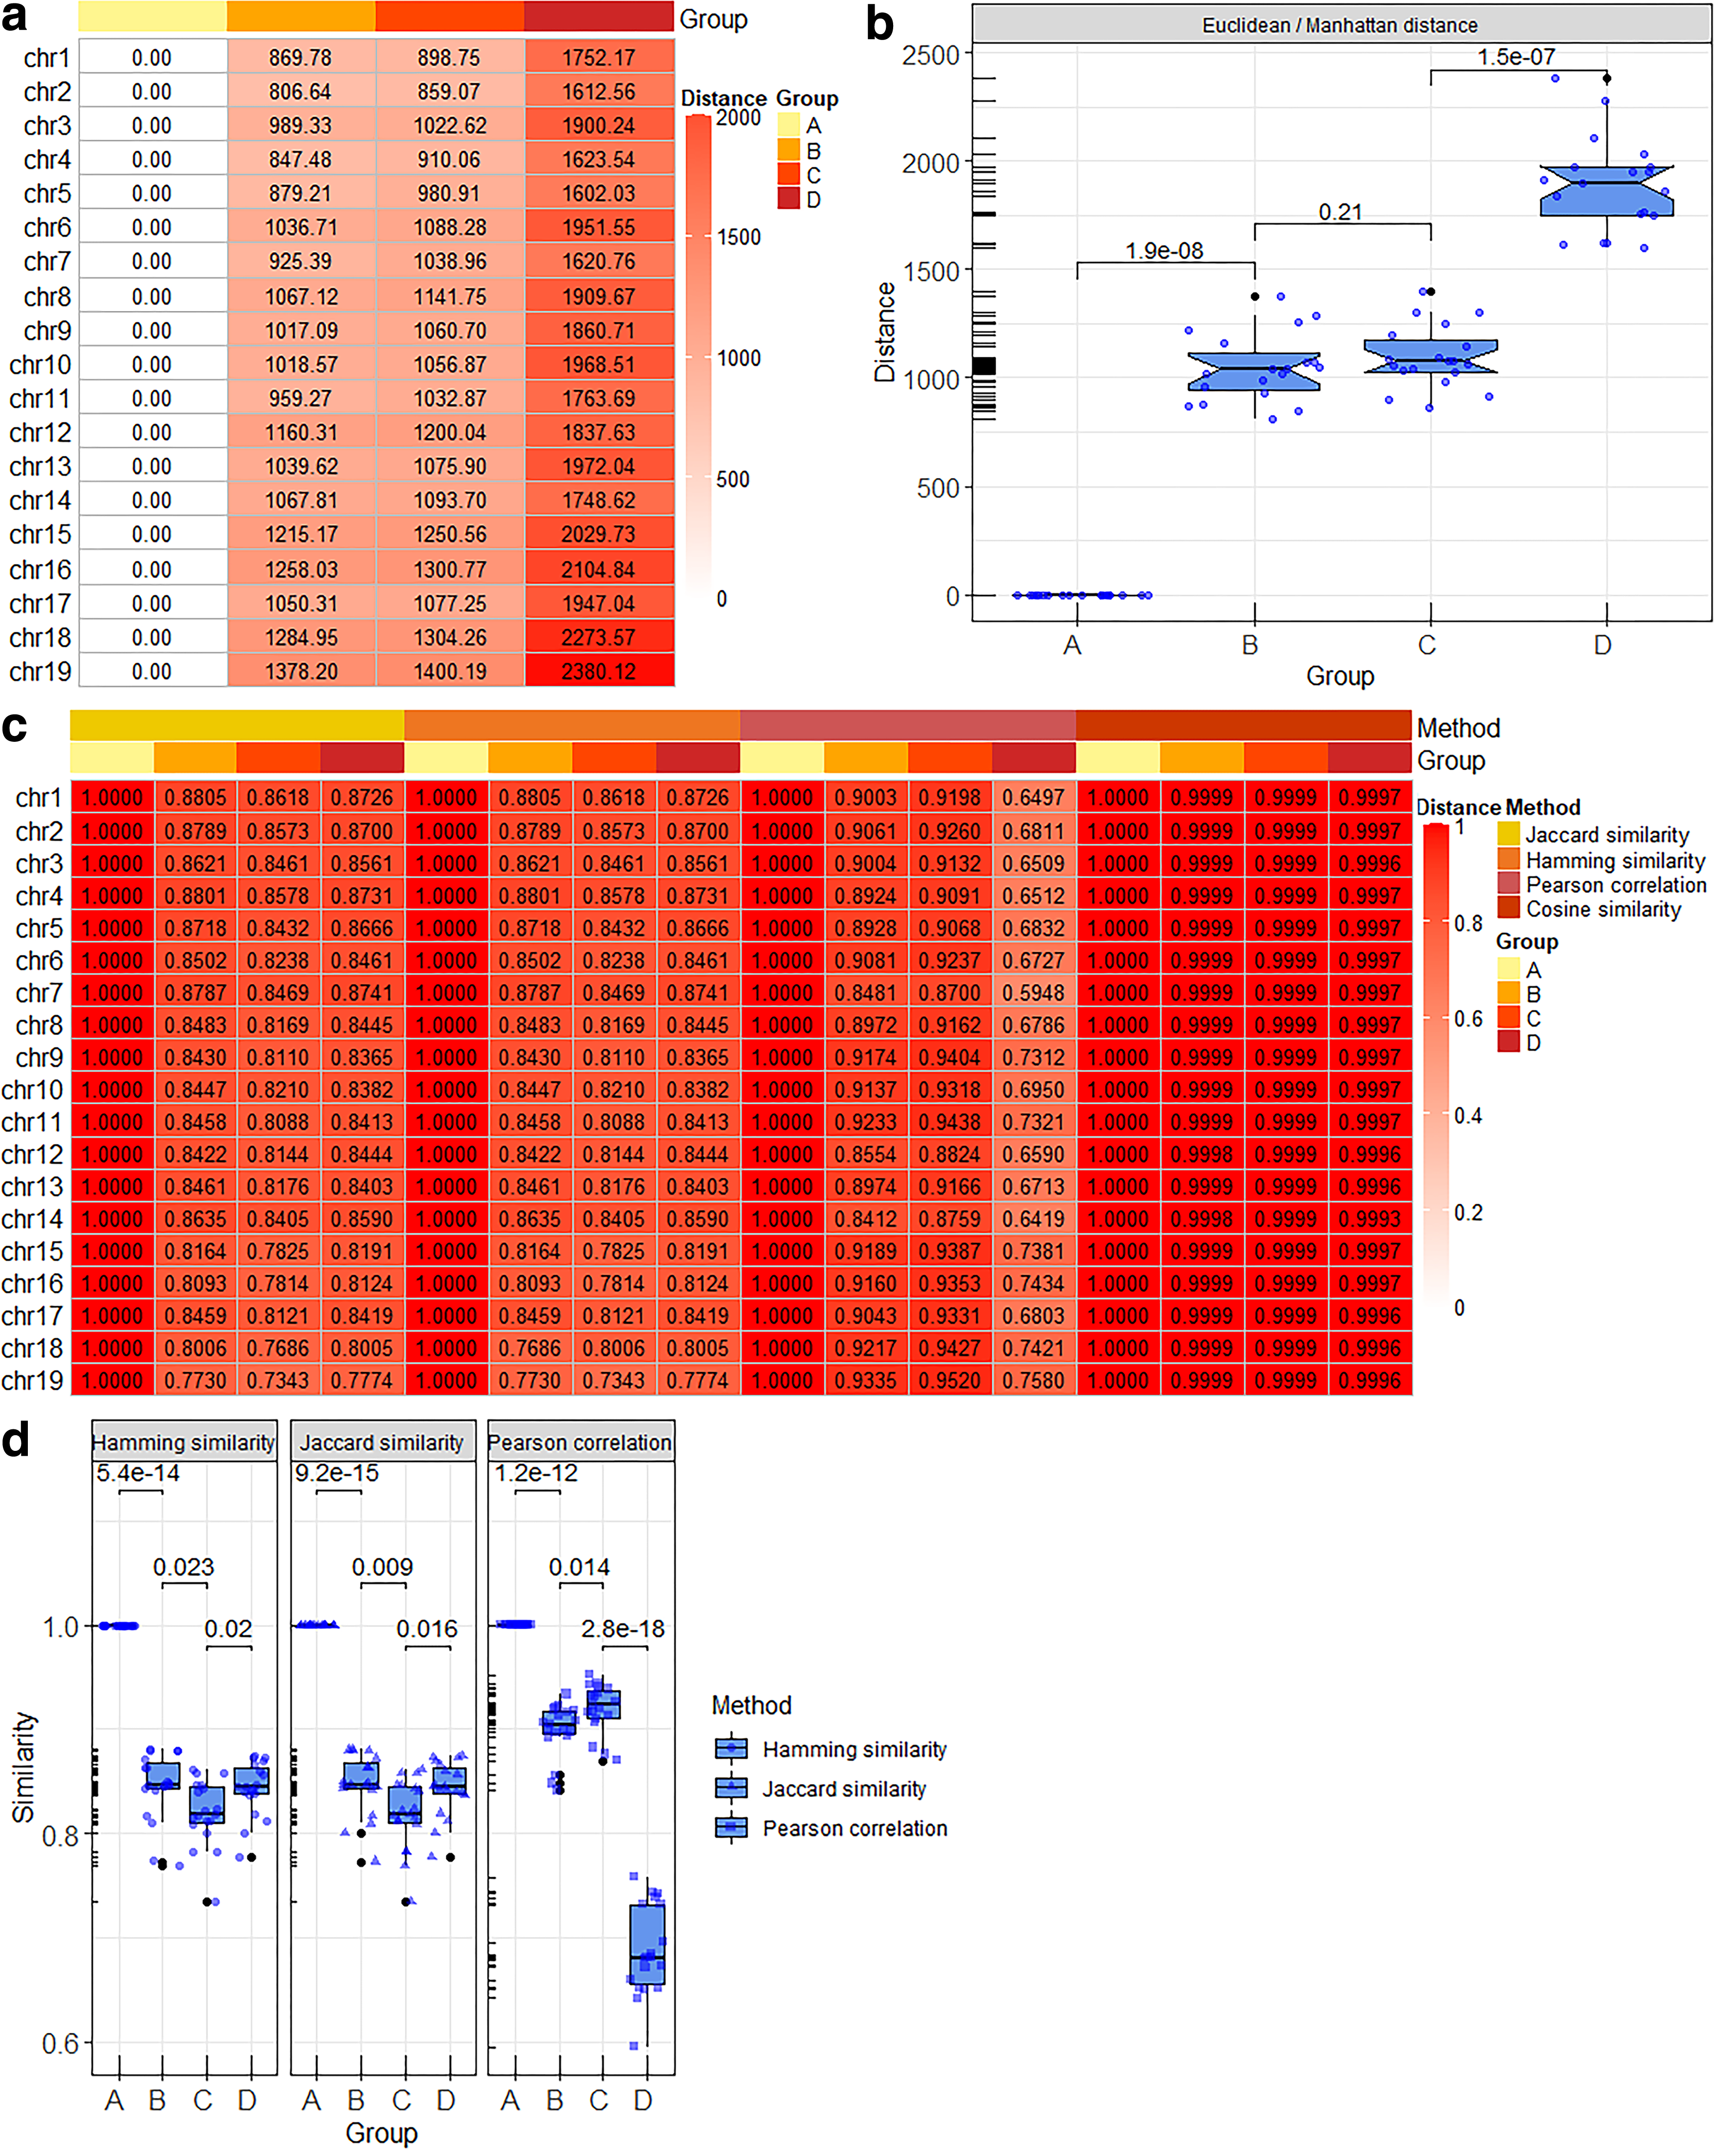
The results of image distance and image similarity measurement.

Consistence rate of all algorithms. The “S” in parentheses indicates that the method is sequence based.
2.3.5. Consistence rate comparison
The consistence rate of four classes was calculated (Fig. 6a). In the four major categories, the performance of image statistical algorithms in TAD similarity quantization was satisfactory. Three out of eight showed 100% consistence. Image hash algorithms with the best zoom size took the second place. And the dHash with 512 × 512 was as consistent as 94.74%. The average consistence rate of sequence-based statistical algorithms was better than classic algorithms (Fig. 6a).
Seventeen algorithms' consistence rate was calculated (Fig. 6b). Among them, seven algorithms had better performance, and the consistence rate was higher than 60%. Image subtraction, Euclidean distance, and Manhattan distance in image statistical algorithms had the highest consistence rate, that is, 100%. Second, the consistence rate of dHash algorithm in image hash algorithms with the best zoom size was 94.74%. Third, the consistence rate of hamming distance in sequence-based statistical algorithms was 84.21%. Fourth, JI distance algorithm in classic algorithms was 73.68%. In contrary, the performance of pHash algorithm, hamming distance in image statistical algorithms, Jaccard similarity, Pearson correlation coefficient, cosine similarity, etc. was not as good as other algorithms for the quantization of TAD similarity due to their low consistence rate.
3. Discussion
TADs are very important parts of chromatin hierarchy (Pope et al., 2014). TADs contain sub-TADs, which form a hierarchical structure at the TAD level (Xianglin et al., 2018). The destruction of TAD structure leads to the disorder of gene regulation, which may cause disease (Lupianez et al., 2015; Franke et al., 2016; Valton and Dekker, 2016). In recent years, TADs have been studied in a variety of biological backgrounds to explore their role in normal and disease development (Zufferey et al., 2018). However, the success and reliability of these studies depend on the ability to identify these domains correctly (Zufferey et al., 2018). So, a lot of tools to call TADs has been developed to provide a guarantee for the success and reliability of these studies. However, few algorithms were provided to compare the similarity of TADs. And the hierarchy of TADs is complex (Xianglin et al., 2018), so that the identification of TADs could help to understand the spatial relationship of the local chromatin region and to investigate the potential relationship between the regulatory element and the gene (Xianglin et al., 2018). The similar genomic structure may have a similar relationship between the regulatory element and the gene. Therefore, it is of great significance to study the similarity of TAD quantization method.
In this article, 17 algorithms from 4 kinds to measure the similarity of TADs from the point of sequence and image were compared. And the advantages and disadvantages of these 17 methods were summarized.
In the first category, three classical methods were compared. Among them, JI distance was to identify and quantify regions of chromosomes where TAD arrangement was (dis)similar between two experiments (Zaborowski and Wilczynski, 2019). The principle was to calculate the overlap degree of the TAD boundary (Zaborowski and Wilczynski, 2019). It was a widely used method of TAD quantization. The advantage of this method was that the operation was simple and computationally fast. But its disadvantages were also obvious. This approach had a serious drawback, that was, large domains with relatively small shift in their boundaries contributed to lowering the overall dissimilarity, as was the case with small domains leading to relatively large shifts (Zaborowski and Wilczynski, 2019). But VI distance based on information entropy (Filippova et al., 2014) was a method to overcome this shortcoming. It was a kind of nonboundary-centric measurement method, which mainly measured the variation of information (Zaborowski and Wilczynski, 2019).
However, the disadvantage of this approach was that it did not take the linear structure of the genome into account and usually deviates from the random control and, therefore, overestimated highly conservative structures (Zaborowski and Wilczynski, 2019). Another method was BPscore, which was a proper metric satisfying triangle inequality (Zaborowski and Wilczynski, 2019). BPscore was a relatively simple distance metric, which was a distance metric based on the bipartite matching between two segmentations (Zaborowski and Wilczynski, 2019). The advantage of this method was that the resolution was adjusted naturally with the size of the chromosome when the segments were separated (Zaborowski and Wilczynski, 2019). In addition, the method dealt with various changes (insertions, deletions, and shifts of domain boundaries) equally, which could be used to compare domain sets with different granularity (Zaborowski and Wilczynski, 2019).
The second category methods, sequence-based statistical algorithms, were mainly based on the sequence of statistical methods, including hamming distance, Euclidean distance, and Chebyshev distance. The principle of these methods was similar to the JI distance, that was, to compare the degree of the overlap or the degree of the differences between the TAD boundary. The merits and demerits were as same as JI distance. The image hash algorithms and image statistical algorithms were used to quantify the TAD similarity by comparing the similarity of the images after generating the TAD images. Visualization could show the spatial structure of TADs more intuitively. The information of each pixel was made full use. And the similarity and differences between TADs were compared to the maximum extent. These were merits of image hash algorithms and image statistical algorithms. However, the disadvantages of these two category methods were obvious, that was, the information of the image was stored in the pixel, and the scaling of the image may result in the loss of the information.
Through the comparison of 17 TAD similarity quantization algorithms from 4 kinds, it's found that the image-based method was superior to the sequence-based method. Ranked by consistence rate, the top seven were image difference, Euclidean distance, Manhattan distance, dHash with best zoom size, hamming distance attached with best 200 M size, and JI distance. Among these seven algorithms with the highest consistence rate, image-based method accounted for five, showing superior performance. Although part of the information would be lost when the image size was scaled, the impact could be minimized by controlling the scaling multiple of the image. And by comparing the differences of all the corresponding pixels between the two images, the similarity could be quantified to the maximum extent. The other two methods, hamming distance and JI distance, also had their commonality. They all quantify the similarity of TADs by calculating the overlap of TAD boundaries. Although these two methods were relatively simple, they fully considered the linear structure and conservative structure of the gene.
Although this study had compared the advantages and disadvantages of 17 algorithms in an all-round way, it also has some limitations. In terms of test data selection, four sets of data were selected, namely, identical sample pairs, biological duplicate sample pairs, different endonuclease sample pairs, and different cell line sample pairs. Since the identical sample pairs were few, the same sample was used to pair itself (Group A). Therefore, there is no experimental error or operating error; the distance between the sample pairs was 0 or the similarity was 1. The differences between biological duplicate sample pairs (Group B) and different endonuclease sample pairs (Group C) were small; the distance or similarity was similar. So, the degree of differentiation was not very well. This could not be the perfect choice, but in theory, it is true that the similarity of TADs between group A and group D should decrease or increase in distance.
In general, we compared 17 TAD similarity algorithms from four categories with two different angles of sequence and image and presented the advantages and disadvantages of these algorithms in an all-round way. Among these four categories of algorithms, image statistical algorithms were superior. Three out of eight of image statistical algorithms had a consistence rate of 100%. The average consistence rate of image hash algorithms with the best zoom size was 71.93%, which took the second place, followed by sequence-based statistical algorithms with consistence rate of 56%. The average consistence rate of classic algorithms was slightly lower than sequence-based statistical algorithms, which was 50.87%. Although these algorithms involved in this study were relatively simple, it is the first time to compare the similarity of TADs from many angles and provide references for the TAD similarity measurement from the field of image science.
Footnotes
Acknowledgments
The authors thank Lingxiao Zhou, Yingying Liu, and Wen Yuan for the critical feedback and discussions. Funding: This work was supported by the National Key Research and Development Program of China (no. 2016YFC0901903).
Authors' Contributions
A.W. downloaded data from GEO and preprocessed these data. A.W. called topological associating domains. Y.L. performed subsequent analyses with 17 algorithms for quantifying the genomic similarity of topological associating domains. G.L. and L.L. designed the study. Y.L. wrote the article. All authors read and approved the final article.
Author Disclosure Statement
The authors declare there are no conflicting financial interests.
References
Supplementary Material
Please find the following supplemental material available below.
For Open Access articles published under a Creative Commons License, all supplemental material carries the same license as the article it is associated with.
For non-Open Access articles published, all supplemental material carries a non-exclusive license, and permission requests for re-use of supplemental material or any part of supplemental material shall be sent directly to the copyright owner as specified in the copyright notice associated with the article.