
Abstract
This study aimed at exploring the genes that may be related to the prognosis of primary breast cancer (BC) patients. The gene expression microarray data, together with sample survival data were acquired from The Cancer Genome Atlas database. The top 20% genes according to expression value variance were subjected to hierarchical cluster analysis. Bootstrap methods were utilized to assess the stability of cluster. Cox regression was applied to screen genes related to the survival time of patients with BC, and the Beta-Uniform Mixture model was applied to adjust the significance of numerous tests. Further, ingenuity pathway analysis (IPA) was carried out to analyze the functions of the potential prognostic genes. Cluster analysis revealed that there were at least five stable BC subtypes, each with specific gene expression. Further, 42 survival time-associated genes were found (p-value = 0.0006, false discovery rate = 0.2) by Cox regression analysis. According to Gene Ontology (GO) functional annotation, genes in clusters A, B, C, D, and E separately were implicated in cell adhesion cooperation, cell stress response, cell cycle, the assembly of nucleosome and chromosome, and immune regulation. IPA results showed that prognosis-related genes mainly participated in the pathways of cell apoptosis, and cell communication and morphology. Genes such as JAK2, TBP, PTGES3, and RYBP may be promising prognostic biomarkers for BC patients.
1. Introduction
Breast cancer (BC) is the cancer that results in the most deaths in women globally (Jemal et al., 2011), and it is estimated to account for nearly one in three cancer cases in the United States (DeSantis et al., 2014). It was considered that more than 180,000 new cases would arise and 40,000 deaths would occur from BC per year in the United States (Jemal et al., 2008). At present, monitoring of BC mainly relies on biopsy, radiological evaluation, imaging, and serum tumor markers (Lacroix, 2006; Sun et al., 2011). The most frequently used therapeutics for BC patients are adjuvant therapy, including endocrine therapy (such as luteinizing hormone-releasing hormone agonists, tamoxifen, and aromatase inhibitors), as well as surgery in combination with postoperative chemotherapy. However, the prognosis for BC patients remains poor. It is reported that 25% of BC patients developed distant recurrence after adjuvant chemotherapy (Tevaarwerk et al., 2013), and the distant recurrence in tamoxifen-treated patients is 15% 10 years after surgery (Paik et al., 2004).
Many studies have been done to uncover the prognostic factors for BC patients, and tumor size, age, histologic type of the tumor, status of axillary lymph nodes, hormone-receptor status, and pathological grade have been known to be related to prognosis in BC (Van De Vijver et al., 2002). Further, several biomarkers have also been documented to relate to the patient survival. For example, a high expression level of either ERBB2 (Tsutsui et al., 2002), p53 (Yamamoto et al., 2014), c-erbB2 (Tsutsui et al., 2002), human epidermal growth factor receptor-2 (HER2) (Charfi et al., 2015), or nuclear factor erythroid 2-related factor 2 (NRF2) (Onodera et al., 2014) has been found to have correlations with poor prognosis in certain subtypes of BC. However, prognosis-associated genes for different subtypes of BC are still unavailable.
In this study, we analyzed the gene expression data of BC samples as well as corresponding clinical information using whole-genome microarray data in The Cancer Genome Atlas (TCGA) database, with the attempt to find potential prognostic genes that will help to develop new strategies and therapies for patients with BC.
2. Materials and Methods
2.1. Data source and preprocessing
First, the gene expression data of BC were downloaded from the TCGA database (McLendon et al., 2008). Since the data were very huge, only the preprocessed level 3 data were selected for this study, which were derived from 533 primary BC samples. Since the expression data were not complete, the K nearest neighbors (KNN) algorithm was utilized for imputing the missing data (Troyanskaya et al., 2001). Besides, the clinical data corresponding to these BC samples were also downloaded from TCGA. The period from cancer diagnosis to the eventual death was defined as the survival time of BC patients. For patients living longer than 10 years after diagnosis, the survival time was recorded as censored data. Gene expression data were matched with survival time by comparing the first 10 numbers of sample barcode with the patient ID in the survival data.
2.2. Cluster analysis
The top 20% genes were selected according to their variance values and then were subjected for cluster analysis by using R package gplots (Warnes et al., 2013). One correlation was used as a function to calculate distance, and the ward's linkage was utilized to perform hierarchical clustering.
2.3. Gene Ontology enrichment analysis of each gene cluster
Different gene clusters were screened from the cluster heatmap. The online tool DAVID (the Database for Annotation, Visualization, and Integrated Discovery, https://david.ncifcrf.gov) was utilized for exploring the Gene Ontology (GO) terms significantly enriched for each gene cluster (p < 0.05) (Da Wei Huang and Lempicki, 2008).
2.4. Survival analysis and potential prognosis-related genes
Log-rank test (Harrington and Fleming, 1982) was used to determine whether a significant difference existed in the survival time between two groups of patients. Further, the Cox proportional hazard model was applied to perform univariate analysis for gene expression and survival time, and the model was established based on the following equation:
where h(t) is the hazard function; λ0 (t) is the baseline hazard function; β0 and β1 are the regression coefficients; and Xi is the gene expression of the ith sample. Regression coefficients were estimated by using the function coxph of R package. Next, p-value was corrected by the Beta-Uniform Mixture Model (Pounds and Morris, 2003) to control false discovery rate (FDR). In addition, cluster analysis of the selected genes and principal component analysis were carried out based on the expression value of each gene. All statistical analyses were carried out by R software unless specified.
2.5. Ingenuity pathway analysis
Finally, we used ingenuity pathway analysis (IPA) software (Ingenuity Systems, Redwood City, CA) (Jiménez-Marín et al., 2009) to analyze the pathways that involved the potential prognosis-related genes. Briefly, the identified genes were mapped into accessible functional networks and particular biological pathways, and then they were ranked according to their scores.
3. Results
3.1. Screening of BC subtypes via hierarchical cluster
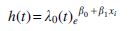
Totally, 3563 genes were subjected to cluster analysis. According to cluster analysis, the BC samples were classified into five groups (Clusters 1, 2, 3, 4, and 5), and genes were also divided into five groups (Clusters A, B, C, D, and E, Fig. 1A). Moreover, bootstrap consensus cluster via calculating the frequency for each sample divided into the same cluster confirmed that these five sample clusters were very stable (Fig. 1B). More than 95% of the samples in Cluster 5 were clustered together, followed by Cluster 2, whereas the other three clusters had a certain overlap.
Hierarchical cluster diagram.
3.2. Survival time of the five subtypes
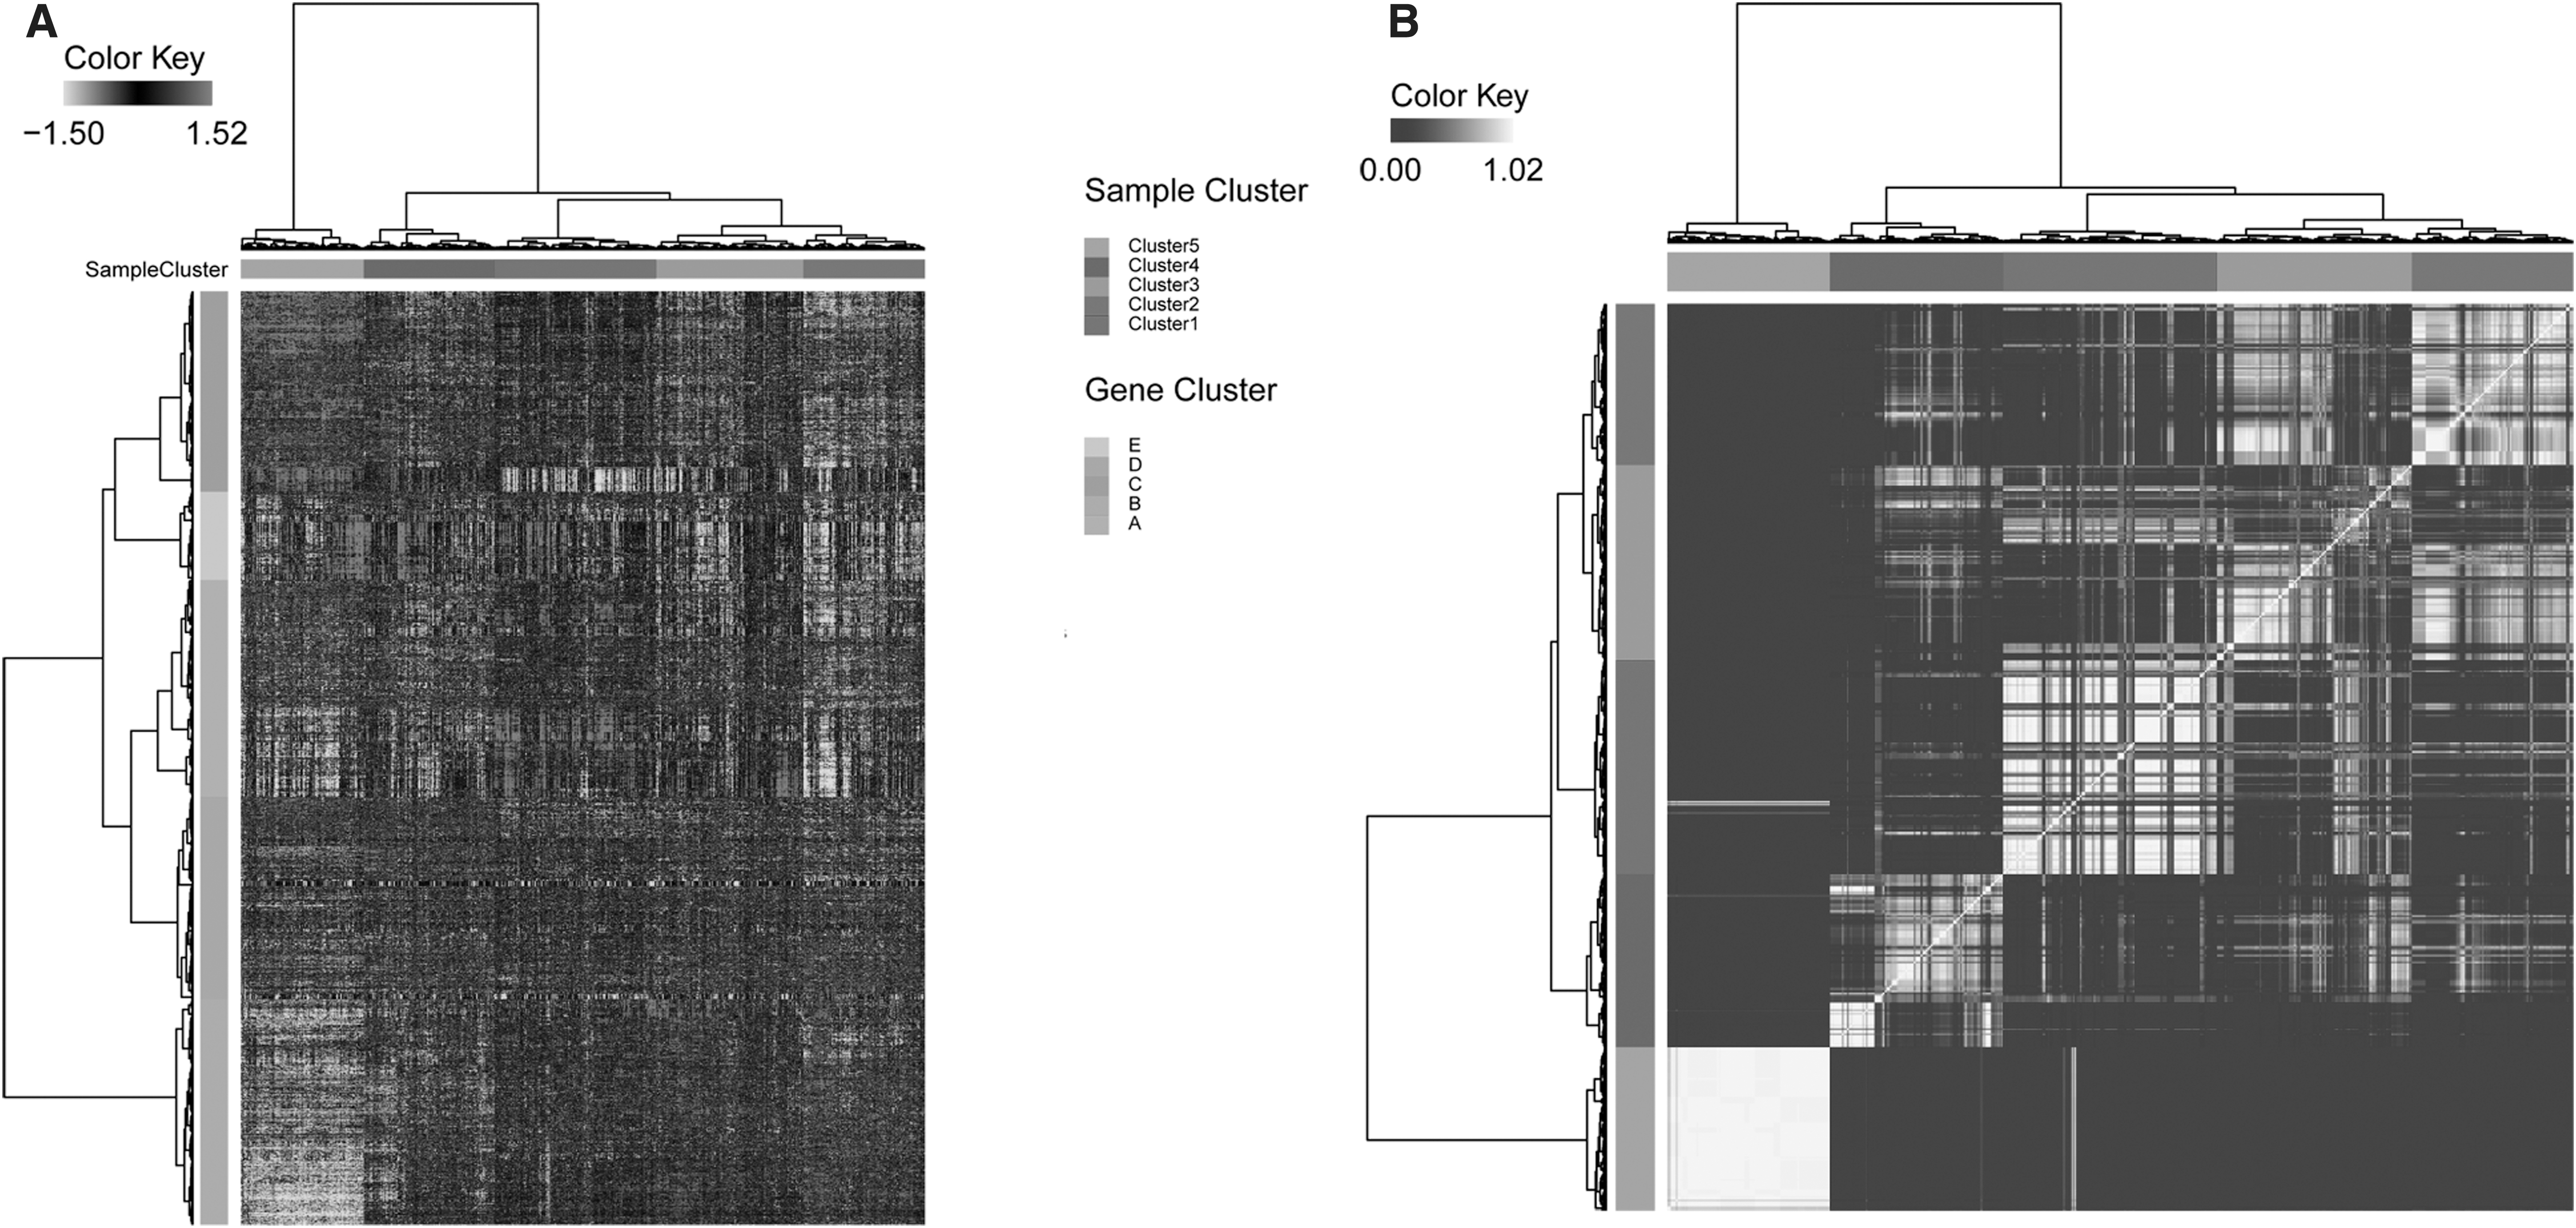
We defined these five clusters as different BC subtypes, and we further studied the differences in survival time among these subtypes. Figure 2A displays the survival curves of all the samples, with a median survival time of 10 years. Figure 2B shows the survival curves of the five BC subtypes. Patients in Clusters 1 and 5 had the longest survival time, whereas patients in Cluster 4 had the shortest survival time. However, the differences between survival times of five clusters were not significant (p-value = 0.0765).
KM survival curve.
3.3. GO functional analysis of different gene clusters
Genes in cluster C were highly expressed only in Cluster 5; genes in clusters A and E were mainly expressed in Cluster 1; and genes in cluster D had a low expression level in all sample clusters. According to GO function analysis, genes in cluster A, B, C, D, and E separately were implicated in cell adhesion cooperation, cell stress response, cell cycle, the assembly of nucleosome and chromosome, and immune regulation (Table 1).
Functional Enrichment Analysis for Gene Clusters A, B, C, D, and E
3.4. Screening of prognosis-related genes
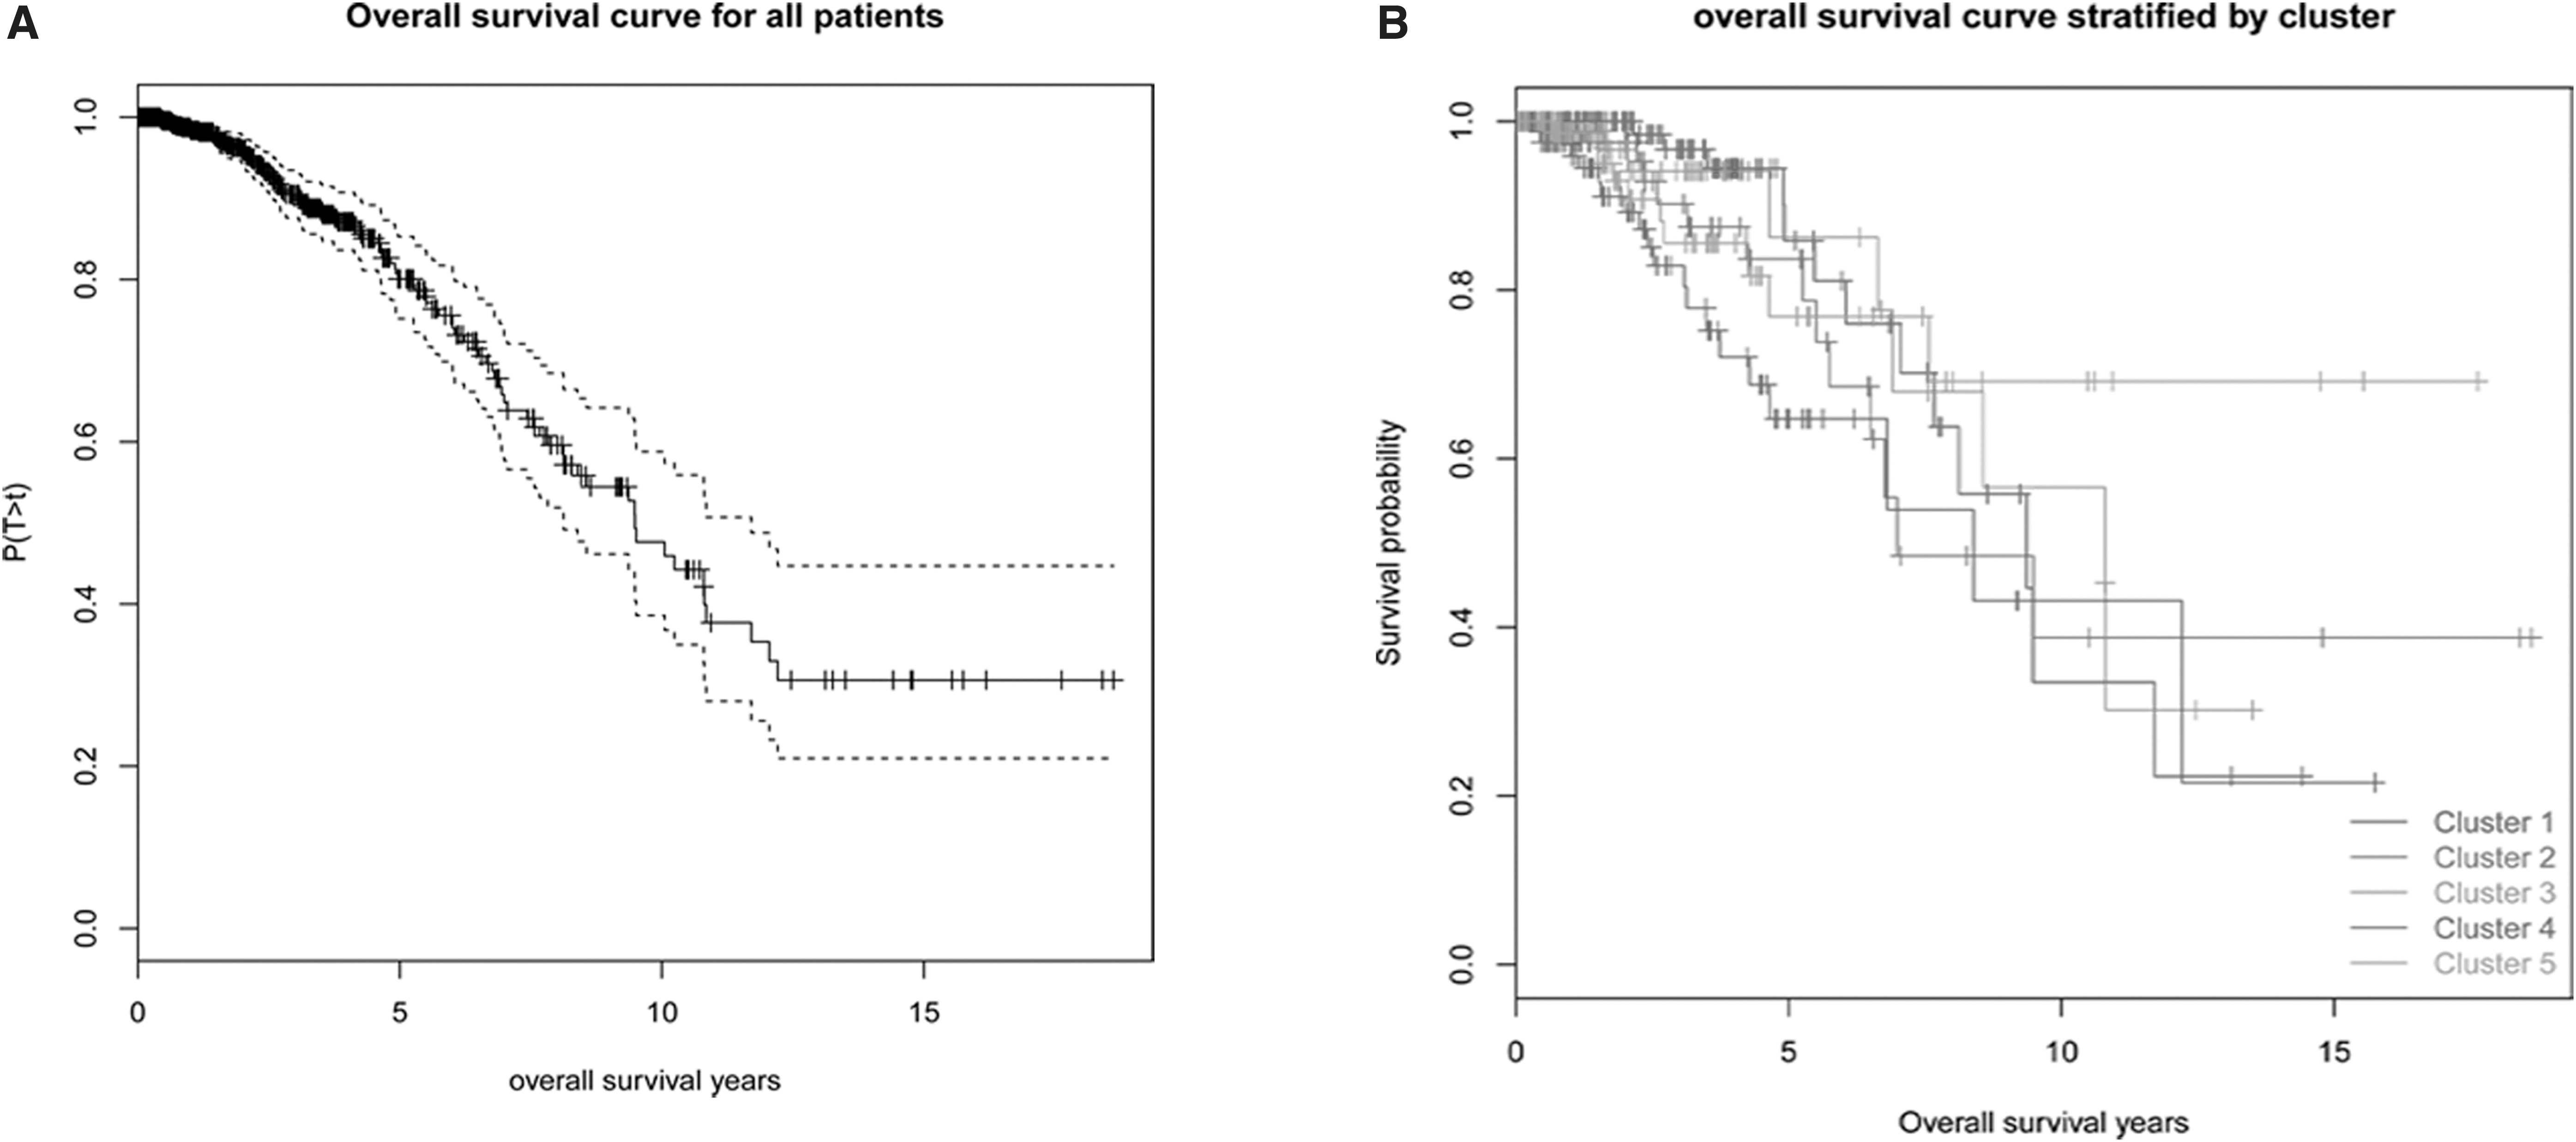
At FDR of 0.2 (corresponding p-value = 0.0006), a total of 42 genes related to the prognosis of BC patients were obtained. Figure 3 displays the heatmap of cluster analysis of the patient samples based on these 42 prognosis-related genes.
Bidirectional hierarchical cluster analysis based on the 42 prognosis-related genes. The row represents the cluster of genes, and the column represents the cluster of samples. The OS time was truncated at 10 years. For a sample with survival time censored, censoring = 0; whereas for samples with survival time completely missed, censoring = NA. NA, not available; OS, overall survival.
Principal component analysis of these 42 genes showed that samples with longer survival time were mainly concentrated in the second quadrant, whereas samples with shorter survival time were concentrated in the other three quadrants (Fig. 4A). Further analysis showed that the sample clusters based on hierarchical cluster analysis of the 42 genes had different survival curves (p-value = 4.08 × 10⁻⁹, Fig. 4B). This implied that these genes may have a certain role in predicting the survival of BC patients.
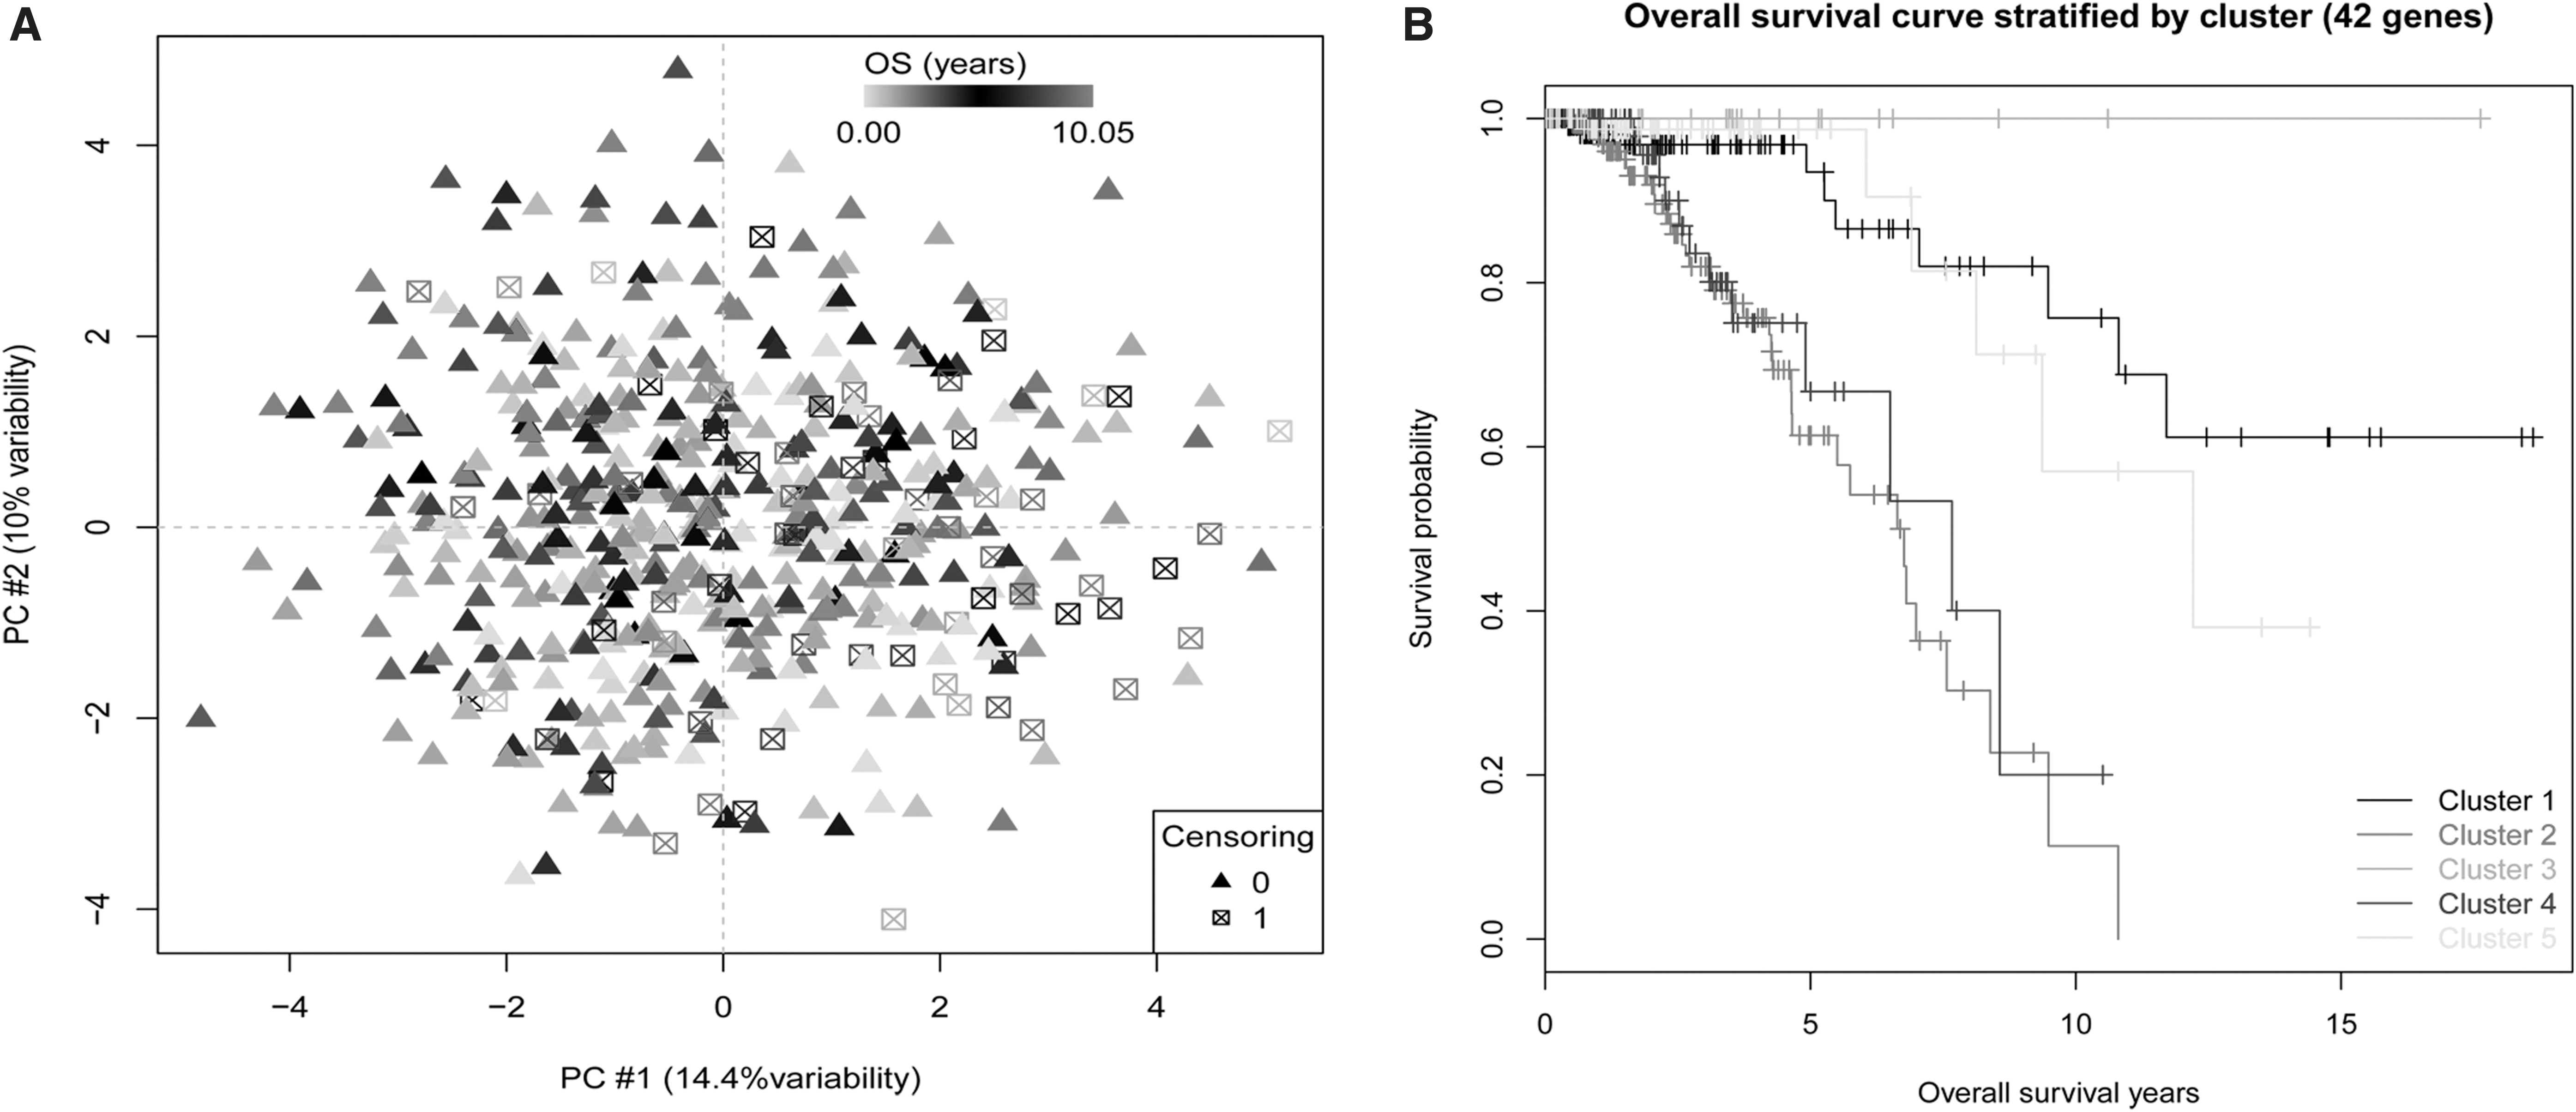
Samples can be divided into different categories by the 42 survival-related genes.
3.5. Pathway analysis of prognosis-related genes
Through IPA, the 42 genes related to survival time were divided into two categories based on their functions: cell apoptosis, and cell communication and morphology. Figure 5A shows the pathway of cell apoptosis in patients with BC, which included the upregulated genes such as Janus kinase 2 (JAK2), FK506 binding protein 5 (FKBP5), SWI/SNF-related matrix-associated actin-dependent regulator of chromatin c1 (SMARCC1), oncostatin M receptor (OSMR), and WNT5A, as well as downregulated genes, such as prostaglandin E synthase 3 (PTGES3) and TATA-binding protein (TBP). Figure 5B shows the pathway of cell communications and morphology, which included upregulated genes such as RING1 and YY1 binding protein (RYBP), as well as several downregulated genes,

Pathways of cell apoptosis, as well as cell communications and morphology.
4. Discussion
In this study, we attempted to identify genes related to the survival of patients with primary BC through researching gene expression data. We found five stable subtypes presented in cancer samples; further, 42 genes correlating with survival time were found, which were mainly involved in apoptosis, as well as cell communication and morphology.
The balance between cell proliferation and apoptosis is important for cell homeostasis, and the dysregulation of either of them would induce abnormal pathological conditions, such as cancers (Lai et al., 2005). Among the upregulated genes enriched in the regulation pathway of cell apoptosis, JAK2 belongs to the Janus family of kinases (JAKs). Activation of JAK2 and its main substrate signal transducer and activator of transcription (STAT) are necessary to various biological functions, such as cell proliferation, differentiation, and tumor initiation (Britschgi et al., 2012; Harry et al., 2012). Nevertheless, Wagner et al. have proposed that JAKs/STAT5 signaling may play dual roles in BC based on his finding that reduced active STAT5 level in primary BC is related to poor prognosis (Wagner and Rui, 2008). Thus, a higher JAK2 level may predict a favorable prognosis in patients with primary BC.
ERα is expressed in about 70% BCs, and its presence is recognized as a prognostic factor after endocrine therapies (Ali and Coombes, 2002). TBP and PTGES3, involved in the regulation pathway of cell apoptosis, were downregulated in BC. TBP is a transcription factor and is regulated by growth hormone and protease. Sadovsky et al. have confirmed that TBP is implicated in the co-activation of ERα (estrogen receptor-α), which is mediated by SNURF, a small RING finger protein (Saville et al., 2002). Another gene PTGES3 that is required in the maturation of ERα (Lee et al., 2010) was also downregulated, whereas ERα was not included in the 42 genes. Although the prognostic value of TBP or PTGES3 in BC has never been reported, it may be proposed that these two genes may affect the survival of patients with BC via interacting with ERα.
In addition, some of the 42 genes may affect patient prognosis via the cell communication and morphology pathway. For example, RYBP was upregulated in patients with longer survival time. Rybp belongs to the Rybp/Yaf2 protein family, which possesses pro-apoptotic functions, and it is critical for mouse embryogenesis (Stanton et al., 2006). RYBP has pro-apoptotic functions, for it contributes to the production of the death-inducing signaling complex (Mente and Kuhn, 2012) and it enhances Fas- and caspase 10-mediated apoptosis in lymphoma cell lines (Zheng et al., 2001). Actually, Wang et al. have presented that a higher RYBP expression level can serve as an independent predictor of better prognosis in hepatocellular carcinoma patients (Wang et al., 2014). Thus, RYBP expression is probably also related to better survival in primary BC.
5. Conclusions
Taken together, we found a total of 42 genes that may be related to the survival time of BC patients in this study. Some of them (such as JAK2, TBP, PTGES3, RYBP) might affect the survival of patients with primary BC, mainly via cell apoptosis, cell communication, and cell morphology pathways. These genes might be used as prognostic biomarkers for BC. However, our work is achieved based on a bioinformatics method, and further experimental or clinical proof is needed to validate the new findings reported here.
Footnotes
Author Disclosure Statement
The authors declare they have no competing financial interests.
Funding Information
This work was supported by Shanghai Medical Key Specialty (No. ZK2015A25).