
Abstract
The early diagnosis of lung squamous cell carcinoma (LUSC) is difficult, causing an unsatisfactory prognosis. Therefore, the 5-year survival rate of LUSC is poor. This study aimed at screening the potential diagnostic and prognostic markers for LUSC. The data of LUSC gene expression profiles and DNA methylation were obtained from The Cancer Genome Atlas (TCGA) database; the differentially expressed genes (DEGs) and the differentially methylated genes (DMGs) were screened out by an independent t-test and Benjamini/Hochberg methods. Further, the classifiers of the gene expression and DNA methylation markers in LUSC were constructed. After that, diagnostic and prognostic markers in LUSC were analyzed by the protein-protein interaction (PPI) network. The DEGs and the DMGs from TCGA database of LUSC were screened out. After strict filtration, we identified three potential DMGs (POU domain, class 4, transcription factor 2 [POU4F2], EN1, single-minded homolog 1 [SIM1]) for early diagnosis and seven potential DEGs (G-protein coupled receptor 78 [GPR78], PCDHA5, myosin binding protein H [MYBPH], RTL3, KIAA0408, HSD3B2, PCDHA12) for prognosis of LUSC. The tumor-normal tissue classification model and prognosis model were validated in two independent datasets. In addition, the PPI network was constructed, including three DMGs and the five DEGs (GPR78, MYBPH, KIAA0408, HSD3B2, PCDHA12) of the seven DEGs. The potential DMGs (POU4F2, EN1, SIM1) and DEGs (GPR78, MYBPH, KIAA0408, HSD3B2, PCDHA12) for the diagnosis and prognosis of LUSC identified in this article are expected to be further applied in clinical practice of the treatment of LUSC.
1. Introduction
Lung cancer (LC), one of the most serious cancer-associated mortality diseases, has high morbidity and mortality worldwide (Chen et al., 2016). In China, ∼2.5 million individuals succumb to the disease each year (Ma et al., 2018). Lung squamous cell carcinoma (LUSC), a major histologic subtype of LC, is difficult to diagnose early and has less sensitivity on radiotherapy and chemotherapy (Anagnostou et al., 2010). Thus, the 5-year survival rate for patients with LUSC is low after combined operation, radiotherapy, and chemotherapy, which results in poor prognosis (Siegel et al., 2011). A majority of the previous studies identified LUSC-associated molecular genetic changes, including partial tumor-related genes and noncoding RNAs (Feng et al., 2018), which are correlated with early diagnosis and prognosis. However, there is still a lack of effective early diagnostic markers and prognostic markers to meet the needs of diagnosis and treatment of LUSC.
The abnormal expression of genes in LC tissues plays a key role in genesis and development, which may also be related with prognosis and survival rate (Sikaria et al., 2018). For example, B cell lymphoma 2 (Bcl-2) is a cell death (apoptosis) regulator, by inhibiting (anti-apoptotic) apoptosis (Dejean et al., 2006). Feng et al. (2018) found that LUSC patients with high expression of Bcl-2 significantly improved overall survival rates compared with those with low expression of Bcl-2, suggesting that high expression of Bcl-2 is an independent favorable prognostic factor. It is indicated that the differentially expressed genes (DEGs) in LUSC tissues may become potential prognostic biomarkers (Feng et al., 2018).
DNA methylation can be used as a marker for tumors at early diagnosis. Most CpG sites of cancer-associated genes are hypermethylated. A higher methylated level of angiotensin II receptor type 1 (AGTR1) in LUSC was revealed than that in lung adenocarcinoma (LUAD), suggesting that AGTR1 hypermethylation was a promising biomarker to assist in LUSC detection and diagnosis. More importantly, in thyroid cancer studies, the abnormal DNA methylation was found not only at CpG islands in promoter regions but also at the nonpromoter region (Zhao et al., 2014; Beltrami et al., 2017). However, the overall differences of DNA methylation at GpG islands in promoter and nonpromoter regions of genes in LUSC tissues are largely overlooked.
Thus, this article systematically integrated and analyzed the data of the profile of gene expression and DNA methylation in the LUSC tissues, and the functional enrichment and validation were performed by using the DEGs and differentially methylated genes (DMGs). Then, the functional modules of the DEGs and DMGs were identified, and the markers that were related to the diagnosis and prognosis of LUSC were screened out. Our results provide novel information of gene expression and DNA methylation markers in LUSC tissue for the prognosis and diagnosis of LUSC and promote the understanding of the molecular mechanism of LUSC.
2. Materials and Methods
2.1. Data sources and data preprocessing
The RNA-seqV2 sequencing data (Level 3, normalized count), the methylation data (Level 3, Methylation450k), and the corresponding clinical data from patients with LUSC were downloaded from the TGCA database by using UCSC Xena (http://xena.ucsc.edu). The RNA-seqV2 sequencing data consisted of 533 samples, including 502 tumor samples and 51 normal samples. The methylation data consisted of 415 samples, including 372 tumor samples and 43 normal samples.
The four independent expression data of gene chips, the two independent DNA methylation data [GSE39279 DNA Methylation450K chip data and GSE52401 (Shi et al., 2014) DNA Methylation450K chip data (GSE52401_series_matrix.txt)], and the two independent gene expression data (GSE50081) (Der et al., 2014), gene expression chip data, and GSE41271(Riquelme et al., 2014; Girard et al., 2016; Parra et al., 2016) gene expression chip data were searched and downloaded from the National Center of Biotechnology Information–Gene Expression Omnibus (NCBI-GEO) database (www.ncbi.nlm.nih.gov/geo). The statistical results of clinical data are shown in Table 1. Among the four gene chips, GSE39279 and GSE52401 are Illumina HumanMethylation450 BeadChip Platform Methylation chip data, and GSE50081 and GSE41271 are Affymetrix Human Genome U133 Plus 2.0 Array and Illumina HumanWG-6 v3.0 expression beadchip Platform Methylation chip data. The profile of GSE39279 consisted of 490 patients with nonsmall-cell lung cancer (NSCLC), including 339 adenocarcinomas, 133 squamous carcinomas, and 18 large cell carcinomas. In addition, the profile of GSE52401 included 244 normal lung tissue samples from LC patients. GSE50081 profile consisted of 181 Stage I and II NSCLC cases collected at University Health Network (UHN181). The profile of GSE41271 consisted of 275
Clinical Information of Training Set and Validation Set
“—” information deficiency; independent t-test for continuous variable; Chi-square test for discrete variables; “p-value” the p-value on the left: TCGA training set versus GSE19536, The p-value on the right: TCGA training set versus GSE21653.
TCGA, The Cancer Genome Atlas.
2.2. Identification of feature genes and functional annotation and analysis
The standardized The Cancer Genome Atlas (TCGA) gene expression profiles were used to screen out the DEGs. The fold change >1.5 and the adjusted p-value (adj. p) <0.05 were the screening criteria of the significant DEGs by using independent t-test and Benjamini/Hochberg methods. The t-test functions in python3.5 programming language are used for statistical analysis. The principal component analysis method was used to view the grouping of samples.
The calculation method of methylation level of each gene is as follows: The mean values of methylation levels of the four gene promoter region probes (TSS1500, 1stExon, TSS200, 5′UTR) were defined as the methylation levels of the corresponding genes (TSS1500 or TSS200 represent 1500 or 200 bp before the transcription initiation site, respectively). 1stExon represents the first exon. The screening criteria for significant DMGs are as follows: |delta beta| > 0.2 and adj. p < 0.05 adjusting by using independent t-test and Benjamini/Hochberg method. The DMGs were screened by independent t-test and Benjamini/Hochberg method, and the thresholds were set to |delta beta| > 0.2 and adj. p < 0.05.
After that, the DAVID (Huang et al., 2009; Huang da et al., 2009) website (v6.8, https://david.ncifcrf.gov) was used for Gene Ontology (GO) and Kyoto Encyclopedia of Genes and Genomes (KEGG) pathway enrichment analyses.
2.3. Identification of methylation biomarkers of diagnoses and construction and verification of categorizer for LUSC
The recursive feature elimination method was used for feature selection, which was based on the LUSC methylation data in the TCGA database. Considering the actual cost and accuracy, the top ranking probes were screened out from the methylated genes. Then, these probes were used to construct the logistic regression model by using LogisticRegression function of sklearn package in Python software (http://scikit-learn.org/stable/index.html) with default parameters. The TCGA data were set as the training model. Then, the GEO independent dataset (GSE39279 and GSE52401) was used to verify the markers and the classification models.
2.4. Identification of gene expression markers of prognosis and construction of categorizer for LUSC
Because there are multiple probes for each gene in the gene expression profiles, the GSE50081 and GSE41271 data that were downloaded from the GEO database were preprocessed, and the median of each gene from the probes was defined as the expression levels of each gene.
The first 10,000 genes with large variance, from the data of LUSC in the TCGA database, were chosen and were further analyzed for univariate Cox's analysis and LogRank test. p < 0.01 for univariate Cox's analysis and p < 0.01 for LogRank test were chosen as the cutoff criteria for the selection of the genes. After that, the cox proportional risk model was constructed by the genes that were screened out and survival analysis was performed for all the patients (Python lifeline 0.11.1 [http://lifelines.readthedocs.io/en/latest/index.html]). Then, the genes were screened with a criterion that p < 0.01 for univariate Cox's analysis and p < 0.01 for LogRank test.
2.5. Protein-protein interaction network analysis of diagnostic and prognostic markers in LUSC
The protein-protein interaction (PPI) data sets InBio version 2016_05_31 (https://www.intomics.com/inbio/map/#home) (Li et al., 2017) and BioPlex 2.0 (http://bioplex.hms.harvard.edu/index.php) (Huttlin et al., 2015) were collected and integrated. Then, the PPI network was constructed. By integrating the protein interaction data from the InBio and BioPlex database sets, the diagnostic and prognostic markers selected from the first two steps were placed in the network to analyze the interaction between the two markers.
3. Results
3.1. Identification and functional analysis of the DEGs
After analysis and filtration, a total of 2004 DEGs were obtained, including 1238 upregulated DEGs and 766 downregulated DEGs (Fig. 1a). The 2004 DEGs can well distinguish the healthy samples and tumor samples (Fig. 1b). In addition, there was a good distinction of the DEGs, which were standardized by unsupervised hierarchical clustering, to divide samples according to different sample types in either healthy samples or tumor samples (Fig. 1c).
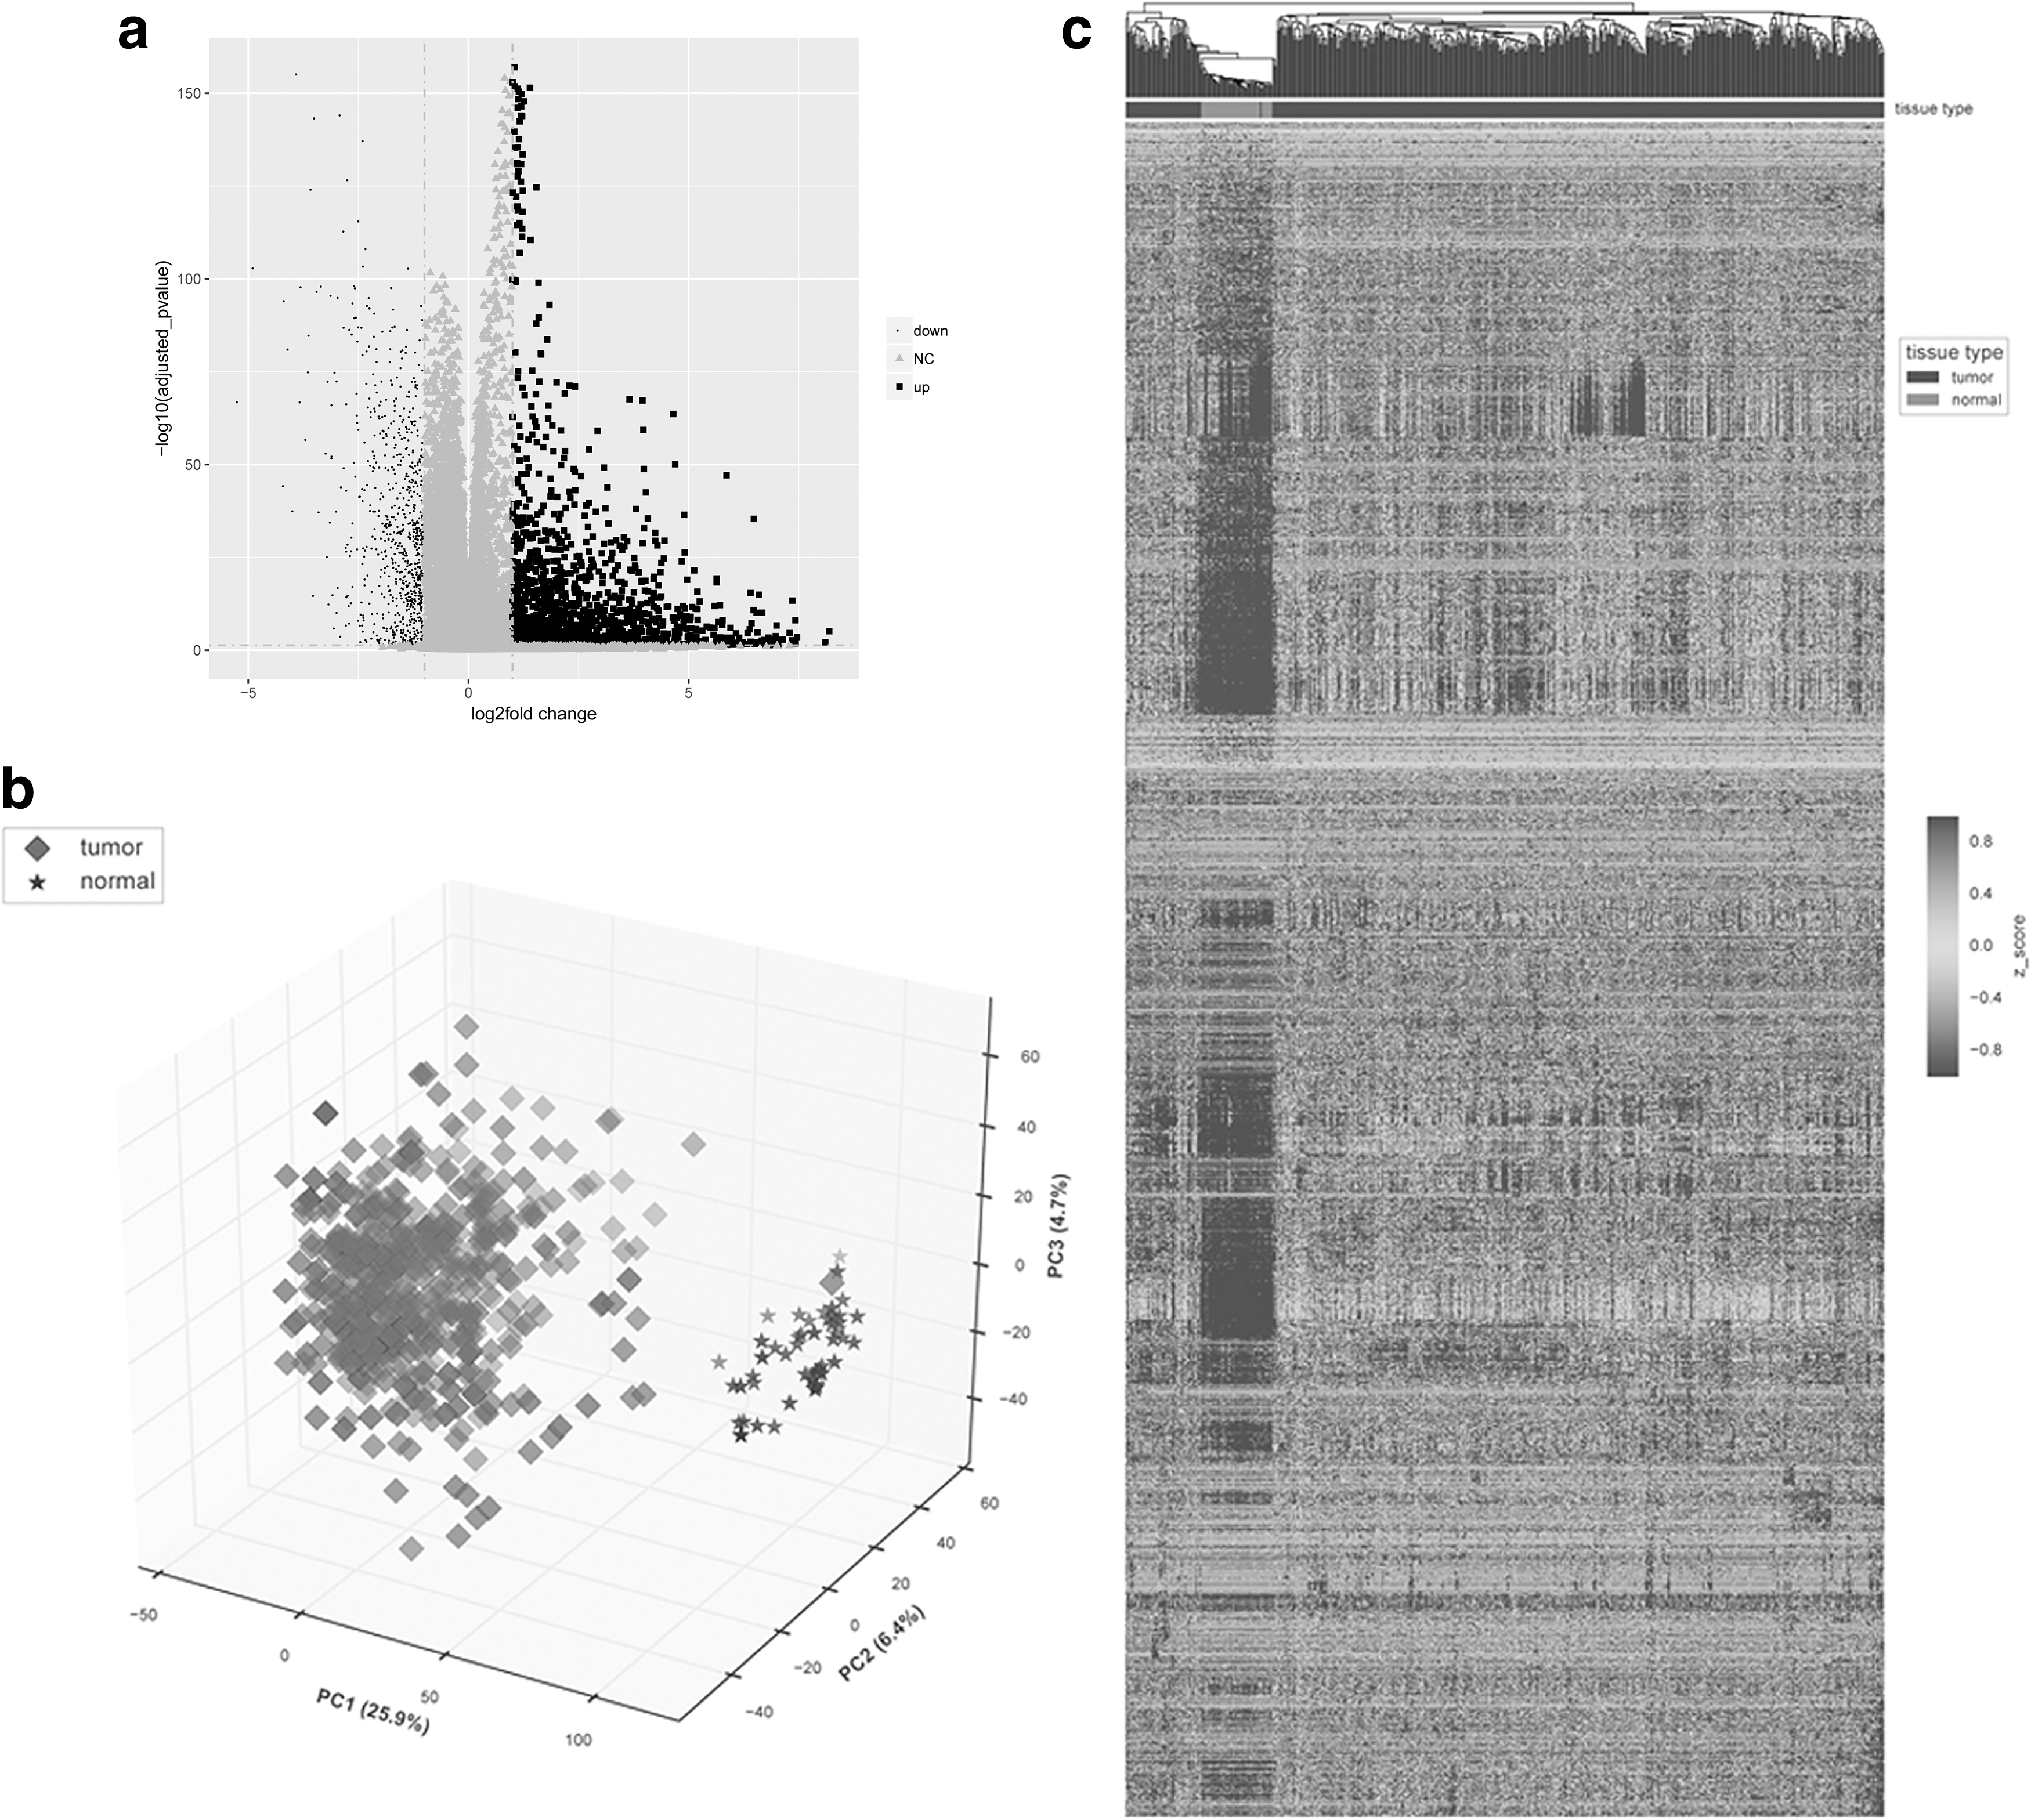
DEGs analysis.
The results of functional enrichment analysis by DAVID revealed that these significant DEGs were mainly enriched in the partial signaling pathway (neuroactive ligand-receptor interaction, systemic lupus erythematosus, alcoholism, and retinol metabolism) and bioprocess (peptide crosslinking, keratinization, and epidermis development) (Fig. 2a). In addition, the upregulated DEGs were also enriched in nucleosome assembly, transcription from RNA polymerase II promoter, and nucleosome assembly (Fig. 2b). Further, the downregulated DEGs were enriched in G-protein coupled receptor (GPCR) signaling pathway, epoxygenase P450 pathway, and neruoactive ligand-receptor interaction (Fig. 2c).
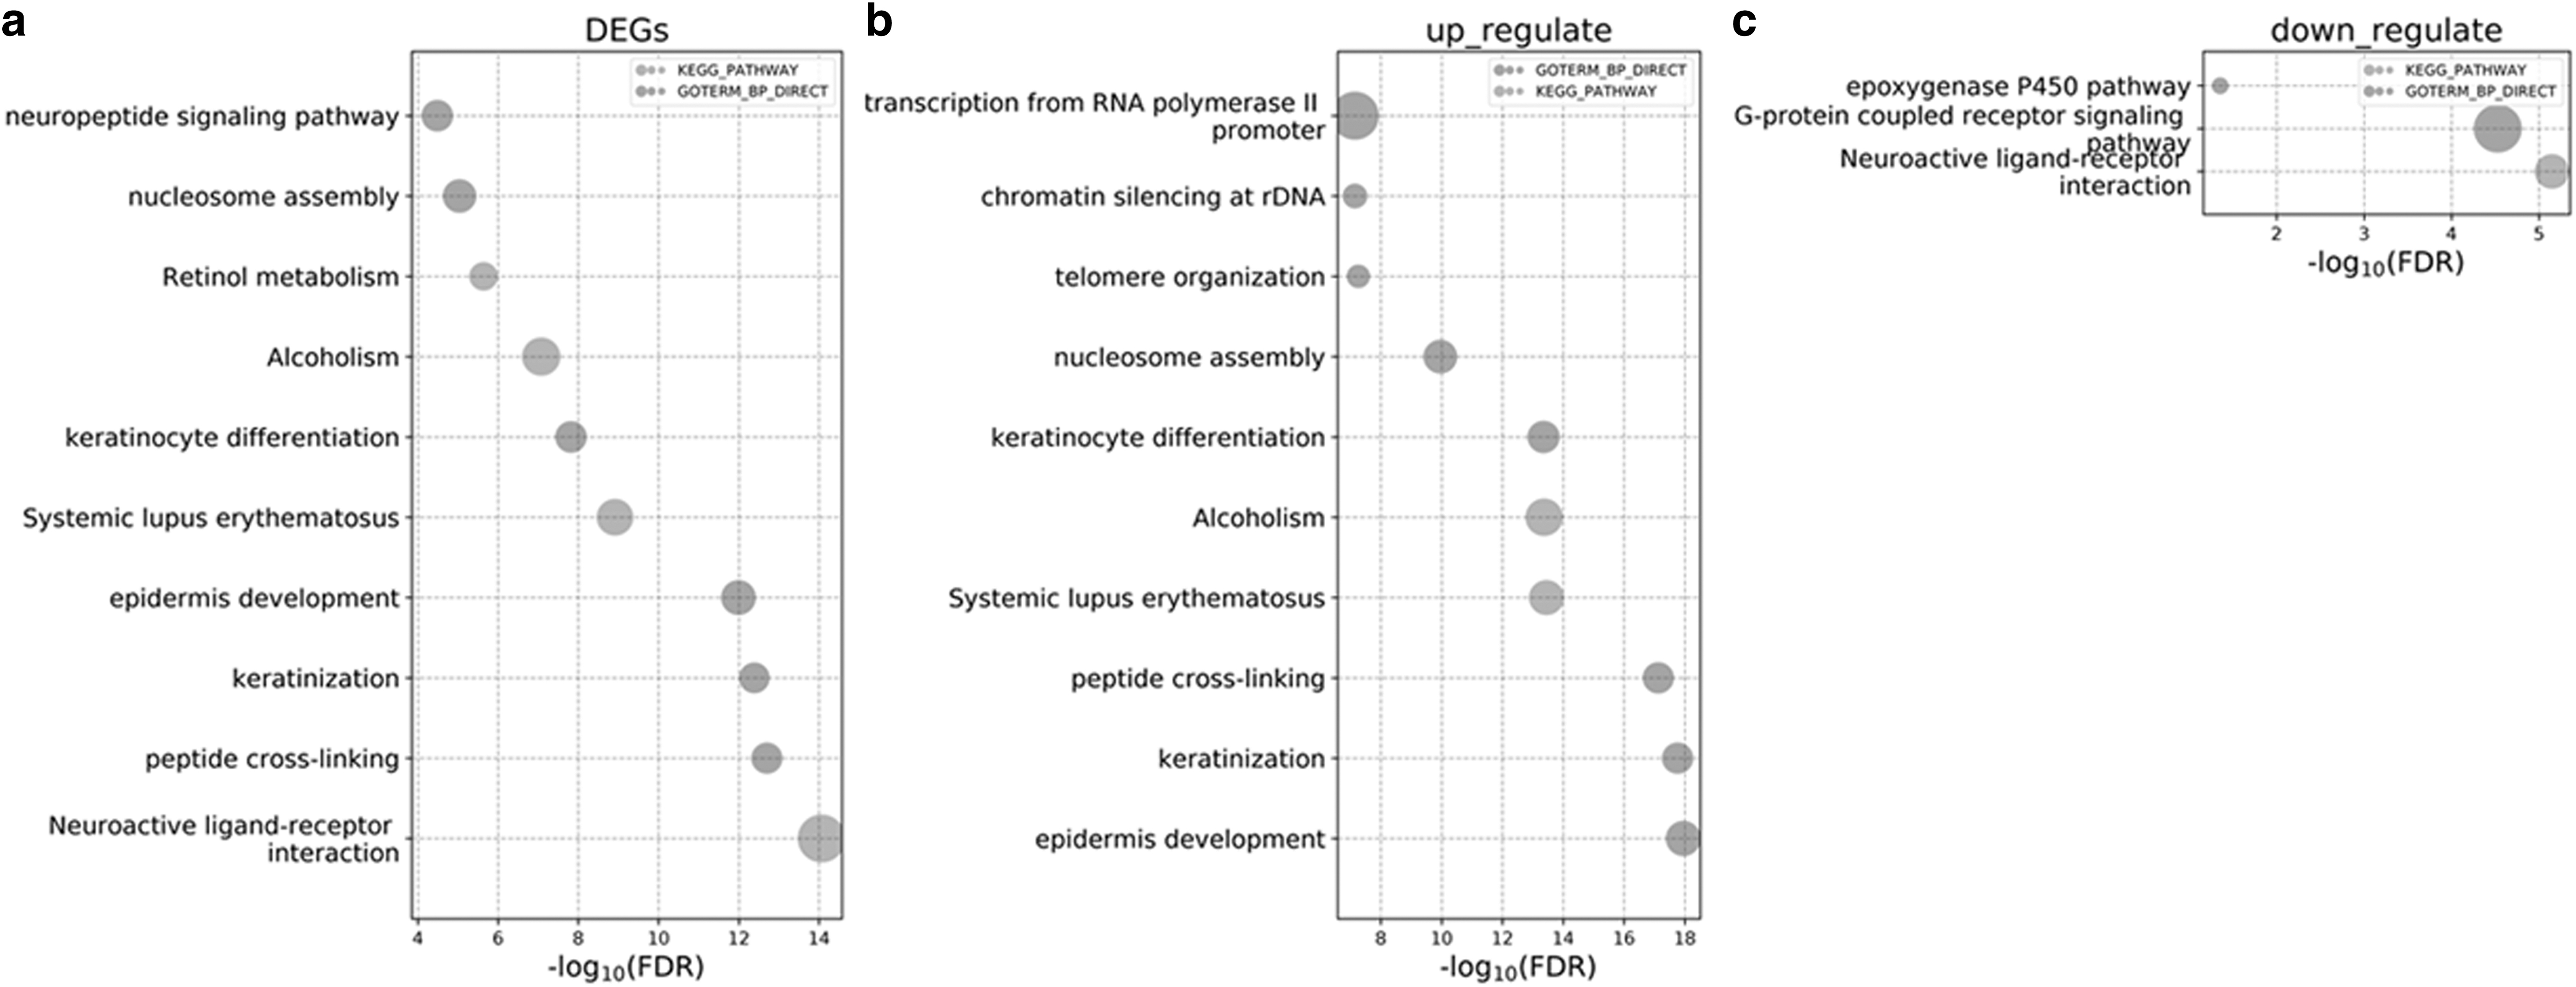
The enrichment analysis of GO bioprocess and KEGG signaling pathway for the DEGs.
3.2. Identification and functional analysis of the DMGs
Further, we performed DMGs analysis on methylation data of LUSC in TCGA. A total of 1578 DMGs were obtained (Fig. 3a). The 1578 DMGs can well distinguish the healthy samples and tumor samples (Fig. 3b). With unsupervised hierarchical clustering, there was a good distinction of the DMGs; the methylation map of the DMGs grouped all samples into tumor samples and normal paracancerous samples. The methylation model of these two types of genes was remarkably different (Fig. 3c).

DMGs analysis.
The results of functional enrichment analysis by DAVID revealed that these significant DMGs were mainly enriched in the partial signaling pathway (GPCR signaling pathway, chemokine-mediated signaling pathway, sensory perception of smell, and other signaling pathways) and bioprocess (olfactory transduction, detection of chemical stimulus involved in sensory perception of smell, and other biological processes) (Fig. 4a).

The enrichment analysis of GO bioprocess and KEGG signaling pathway for DMGs.
Further, the significant high-methylated genes (Hyper) were also enriched in homophlic cell adhesion via plasma membrane adhesion molecules, embryonic skeletal system morphogenesis, DNA-templated transcription, transcription from RNA polymerase II, and other biological processes (Fig. 4b). But the significant low-methylated genes (Hypo) were enriched in inflammatory response, epidermal development of sensory perception of smell, and other biological processes (Fig. 4c).
3.3. Biomarkers screening of LUSC prognosis and construction of classifier
We finally screened out seven suitable genes (G-protein coupled receptor 78 [GPR78], PCDHA5, myosin binding protein H [MYBPH], RTL3, KIAA0408, HSD3B2, PCDHA12), and the expression of GPR78 was upregulated in LUSC tissues compared with paracancerous
Whether in the TCGA training set or the independent validation dataset, the seven genes (GPR78, PCDHA5, MYBPH, RTL3, KIAA0408, HSD3B2, PCDHA12) can well distinguish the patients into high risk and low risk (Fig. 5a–d). Survival probabilities in the high-risk groups are significantly downregulated, in contrast with the low-risk groups (p < 0.05) (Fig. 5a–d). In addition, the seven potential prognostic markers screened out from LUSC also significantly divided LUAD samples into two categories, including high risk and low risk (p < 0.01) (Fig. 5c, d). It is illustrated that the seven potential prognostic markers screened and the classifier constructed had good reliability and repeatability.
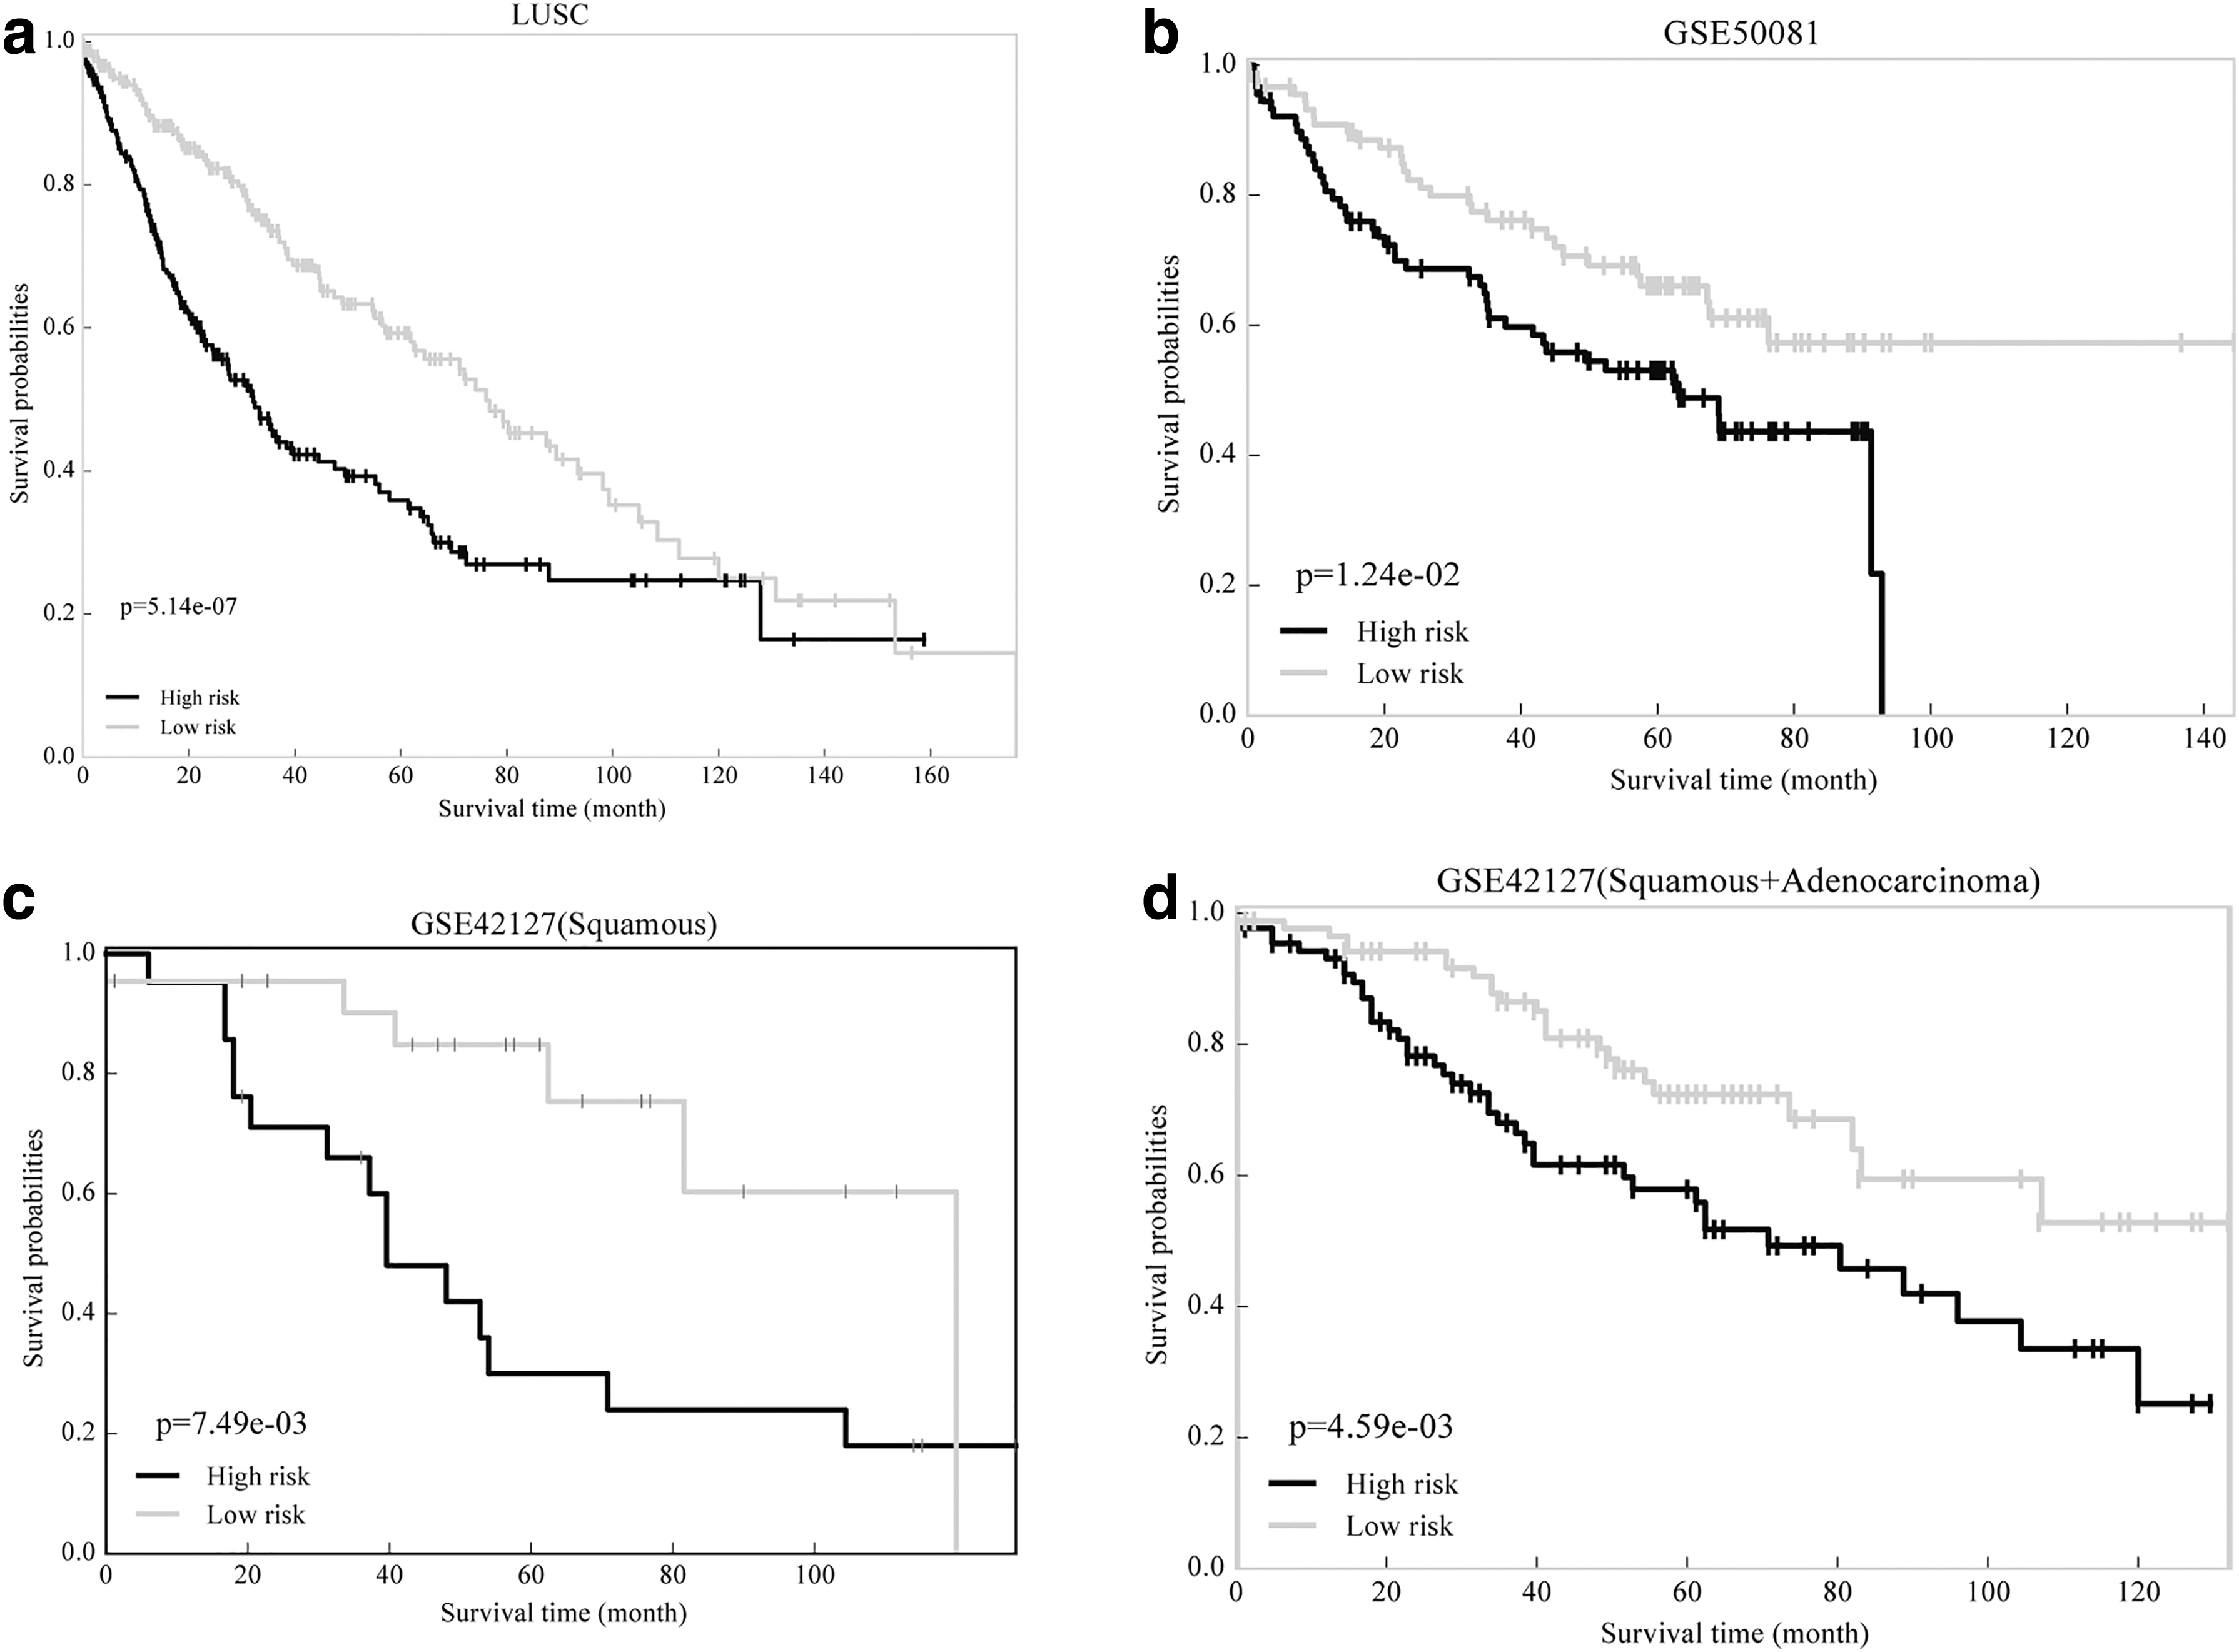
Screening of prognostic markers for LUSC and construction of classifiers.
3.4. Screening methylation markers of the high risk of diagnosis of LUSC and construction and verification of classifier
In the TCGA training sets, the area under curve >0.99 indicated good performance (Fig. 6a). Further, the accuracy of five folds cross-validation was close to 100% (Fig. 6b). In addition, the methylation maps of the three probes were used for unsupervised hierarchical clustering (Fig. 6c), and they can also roughly distinguish the healthy normal samples and tumor samples (Fig. 1b). It was indicated that these three probes can be used as potential biomarkers for the diagnosis of LUSC.
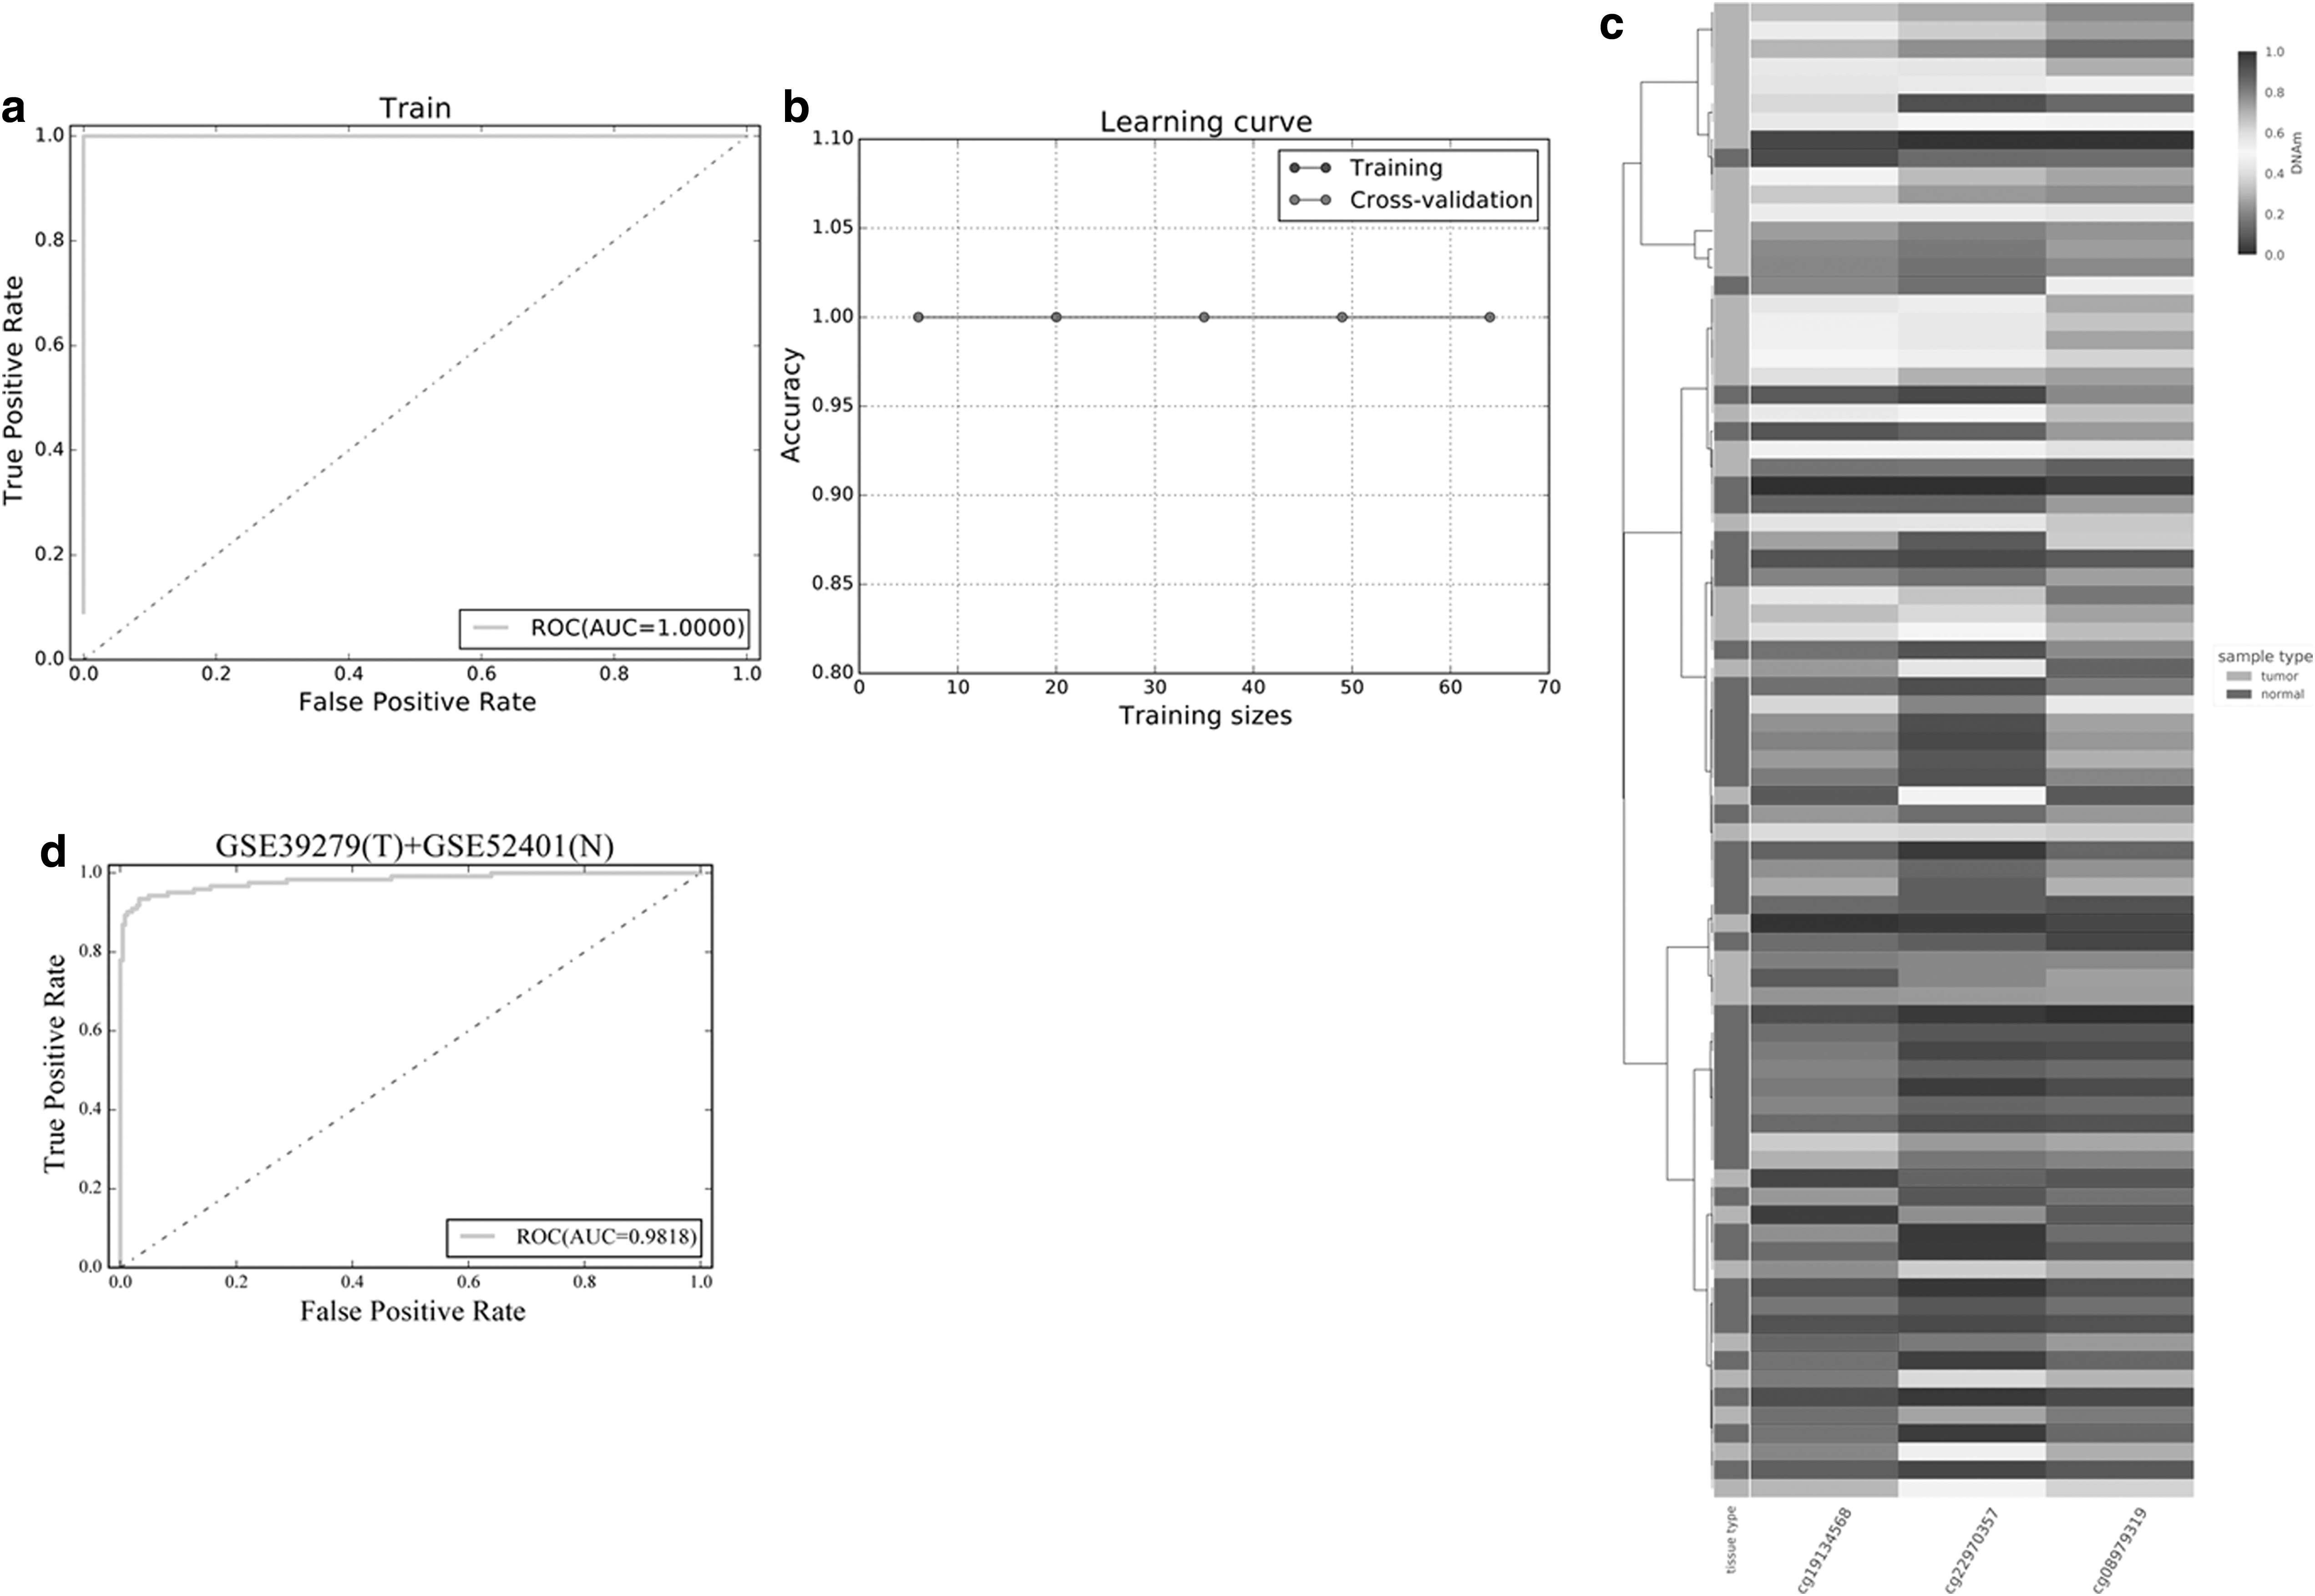
Screening of methylation markers, and construction and verification of classifier for diagnosis of LUSC.
To further verify the repeatability of our feature selection and classifier, the GSE39279 and GSE52401 data sets were used to confirm our model. GSE39279 is the methylation data from 122 LUSC samples, and GSE52401 is the methylation data from 244 normal lung tissues. As shown in Figure 6d, the verification results of independent datasets were consistent with the training set. The reliability and accuracy of our method and model are further confirmed.
3.5. PPI network analysis of diagnostic and prognostic markers in LUSC
The diagnosis and prognosis biomarkers of LUSC that we found are correlated with each other in the PPI network. In particular, the five prognosis biomarkers (GPR78, MYBPH, KIAA0408, HSD3B2, PCDHA12), which were screened from the seven biomarkers, and the three DMGs (POU domain, class 4, transcription factor 2 [POU4F2], EN1, single-minded homolog 1 [SIM1]) constituted the PPI network. As shown in Figure 7, PPCDHA12 was not only a downregulated gene but also had hypermethylation in its promoter region, whereas ATP4A had low methylation and high expression. Further, EN1, a biomarker of diagnosis, was linked to prognostic marker KIAA0408 via TLE1. Some of the genes that interacted with POU4F2 and SIM1 were also highly expressed. It is suggested that the diagnostic and prognostic markers of LUSC, which were selected by the present method, were associated with the PPI network, and these genes may play roles in LUSC via abnormal DNA methylation and abnormal gene expression.
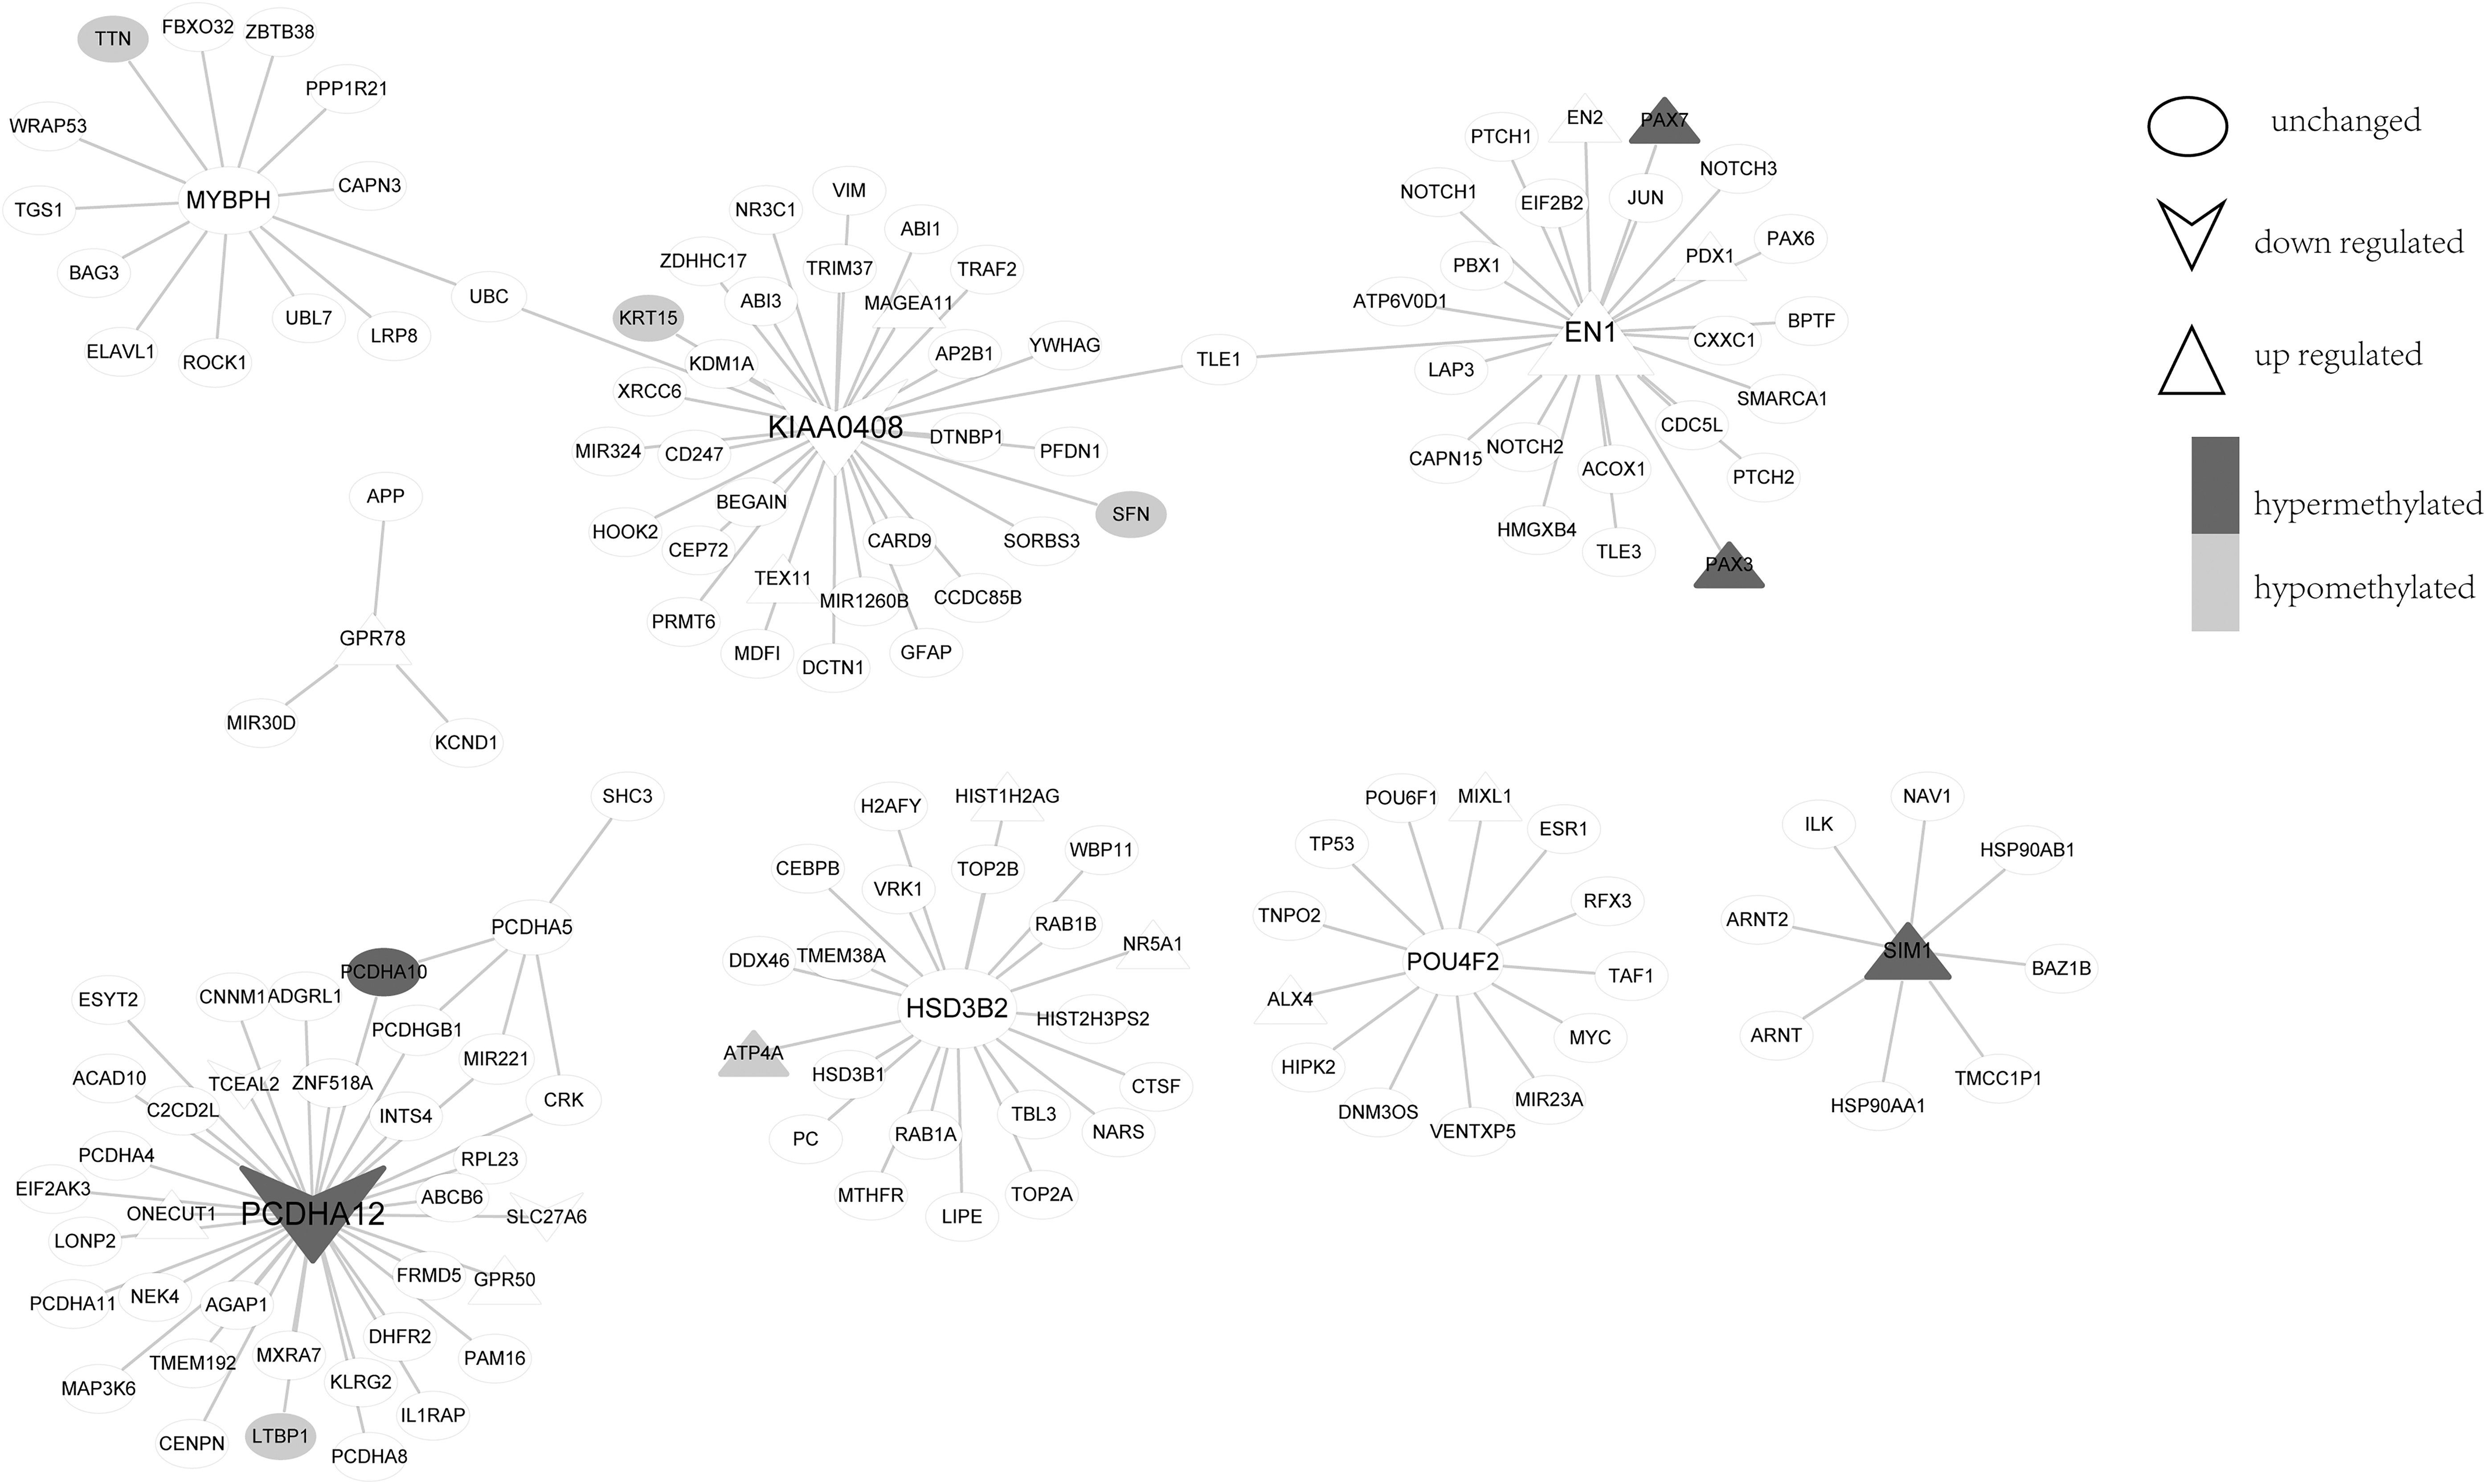
Protein-protein interaction network of diagnostic and prognostic markers in LUSC. Triangle core indicates upregulated genes; inverted triangle core indicates downregulated genes; circle core indicates unchanged genes; black border indicates hypermethylated genes; gray border indicates hypomethylated genes.
4. Discussion
Totally, 2004 DEGs and 1578 DMGs in LUSC were identified, respectively. There was a good distinction of the DEGs and DMGs to divide samples according to different sample types in either healthy samples or tumor samples. Further, both the DEGs and the DMGs were significantly associated with epidermis development, neuroactive ligand-receptor interaction, GPCR signaling pathway, and transcription from RNA polymerase II promoter, olfactory signal transduction, and transcription of RNA transcriptase II promoters, which indicated that there is a strong relationship between DNA methylation and the gene expression. In addition, we identified seven potential prognostic markers (GPR78, PCDHA5, MYBPH, RTL3, KIAA0408, HSD3B2, PCDHA12) that have good repeatability to distinguish the LUSC patients with high/low risk, and three potential diagnosis probes (POU4F2, EN1, SIM1), which can well divide LUSC samples into normal and tumors. At last, in the PPI network analysis, the five genes (GPR78, MYBPH, KIAA0408, HSD3B2, PCDHA12) that were potential prognostic markers and the three potential diagnosis probes (POU4F2, EN1, SIM1) constructed the PPI networks. It is suggested that the diagnostic and prognostic markers of LUSC selected in this study are associated with the PPI network, which function on LUSC via abnormal DNA methylation and abnormal gene expression.
GPR78, a key member of the GPCR family, was upregulated in LUSC in the present analysis of the TCGA database. Similarly, in the LUAD cell lines (H1975, H1299, SPC-A1, and A549), it is also highly expressed (Dong et al., 2016). Further, in oral squamous cell carcinoma in Taiwan, decreased GRP78 protein expression was confirmed as a potential prognostic marker (Huang et al., 2010). However, in our study, the upregulation of GRP78 was predicted as a potential marker for LUSC prognosis. Zheng et al. (2008) found that overexpression of GRP78 was also a marker for aggressive behavior and poor prognosis in gastric carcinoma. The abnormal expression of GRP78 can be a key prognostic marker not only for oral squamous cell carcinoma and gastric carcinoma but also for LUSC.
Results from this study demonstrated that GPCR signaling was associated with the DEGs and the DMGs in LUSC. A large number of studies support our studies. The GPCR signaling pathway, which is overexpressed and contributes to the growth of cancers by activating autocrine pathways (Thomas et al., 2006), is involved in the regulation of cell growth (Avasarala et al., 2013), proliferation (Kalbe et al., 2017), apoptosis (Kalbe et al., 2017), and drug resistance (Kuzumaki et al., 2012) of NSCLC Although there are a few exact researches about the role of GPCR signaling in LUSC, a growing number of reports showed that GPCR signaling may play role in other types of squamous cell carcinoma. For example, in the head and neck squamous cell carcinoma (HNSCC), GPCR ligands prostaglandin E2 (PGE2) and bradykinin (BK) activated epidermal growth factor receptor signaling to stimulate the invasion of HNSCC cells, but BK antagonist CU201 resulted in the HNSCC cells' growth inhibition (Thomas et al., 2006). Thus, it was demonstrated that the GPCR signaling pathway is a key marker of LUSC, and GPR78 is a novel potential prognostic marker of LUSC.
MYBPH, a transcriptional target of thyroid transcription factor 1 (TTF-1, also known as NKX2-1 and TITF1), modulates the migration of LUAD cells (Hosono et al., 2014) and other cell types (Zhu et al., 2017). In addition, MYBPH was inactivated by the promoter methylation in TTF-1-positive LUADs, suggesting that MYBPH is a key regulator of LUAD metastasis with favorable prognosis in LUAD patients (Hosono et al., 2014). Importantly, in the present analysis, MYBPH was identified as a prognostic marker of LUSC, but the expression level of MYBPH in LUSC was unchanged, which needs further study both in vivo and vitro.
LUSC is one of the high-incidence cancers, but still there is limited diagnosis of LUSC markers. In our article, three methylation probes (POU4F2, EN1, SIM1) of LUSC diagnoses were identified, which can be expected to be used to detect the methylation of circulating tumor DNA in blood.
POU4F2, a member of the POU-domain family of transcription factors, plays important roles in controlling cell identity in several systems. In this study, differentially methylated POU4F2 was confirmed as a diagnostic marker for LUSC. Consistent with our study, Reinert et al. (2012) showed that the methylation level of POU4F2 in urine specimens was a promising diagnostic biomarker for bladder cancer recurrence surveillance. In addition, Ishii et al. (2015) suggested that class IV POU genes (POU4F1, POU4F2, and POU4F3) were important for the proneural/neuroendocrine differentiation of LC. But there are no more studies of POU4F2 in LUSC.
In addition, the hypermethylation of EN1 was reported to be associated with benzo(a)pyrene-induction in LC, and the downregulated EN1 promoted the cellular proliferation (Jiang et al., 2016). In this study, EN1 was identified to be a methylated probe of the diagnosis for LUSC. EN1, an important developmental transcription factor, was a potential biologic predictor of poor prognosis in human salivary gland adenoid cystic carcinoma (Bell et al., 2012). Thus, the alteration of methylation of EN1 not only affects the development and progression of LC (Jiang et al., 2016) but also becomes the diagnosis marker of LUSC.
SIM1, known as class E basic helix-loop-helix protein 14 (bHLHe14), was highly methylated in cervical cancer tissues (Kim et al., 2018), astrocytoma (Wu et al., 2010), breast cancer (Miyamoto et al., 2005), and
Six PPI networks have been constructed in this study, including MYBPH/UBC/KIAA0408/TLE1/EN1 network, GPR78 network, PCDHA12 network, HSD3B2 network, POU4F2 network, and SIM1 network, which indicated that the prognostic markers are associated with the diagnostic markers in the PPI network. In MYBPH/UBC/KIAA0408/TLE1/EN1 network, we found that the paired box gene (PAX) 3 and PAX7 is upregulated and hypermethylated. Fukasawa et al. (2006) found that PAX3 was also hypermethylated in primary tumors of LC. Importantly, PAX3- FOXO1 (FKHR) fusion protein in alveolar rhabdomyosarcoma (ARMS) promoted malignant proliferation of skeletal muscle cells, an early step in ARMS tumorigenesis (Linardic et al., 2007). In addition, PAX3/7-FOXO1 (FKHR) fusion protein and PAX7 pathylation was also overexpressed in ARMS (de Souza et al., 2012). It is indicated that PAX3/7 expression and methylation may play a potential role in the diagnosis of LUSC.
Further, ATP4A in the HSD3B2 network is highly expressed and hypomethylated. However, Raja et al. (2012) demonstrated that the downregulation of ATP4A was related with DNA methylation in plasma, suggesting that the downregulation ATP4A is a potential biomarker for gastric cancer (GC). It is indicated that ATP4A methylation in the HSD3B2 network in LUSC may be different with GC. All the studies cited earlier suggested that LUSC formation and is associated with frequent changes in DNA methylation. The biological significance and cancer-associated epigenetic changes of the DEGs and DMGs need further elucidation.
Of course, some issues of our work should be addressed. (1) There is a limitation on the availability of cancer datasets of gene expression and DNA methylation. (2) As we aimed at screening out potential diagnostic and prognostic markers for LUSC from the DEGs and DMGs, we only used naive diagnostic and prognostic models. However, a more complicated model may make the prognostic model more powerful. We will address these problems in our future work.
5. Conclusion
In summary, genes such as GPR78, PCDHA5, MYBPH, RTL3, KIAA0408, HSD3B2, and PCDHA12 with changes in the expression levels and genes such as POU4F2, EN1, and SIM1 with changes in the methylation levels of their promoter region might be the diagnostic and prognostic makers in the LUSC. Further, the prognostic markers are associated with the diagnostic markers in the PPI network. Since DNA methylation is reversible, the diagnostic potential biomarkers selected in this article may be used to design corresponding methylation targeted therapy drugs.
Footnotes
Author Disclosure Statement
The authors declare they have no competing financial interests.