




Abstract
Abstract
Renal cell carcinoma (RCC) is the most common form of kidney cancer, caused by renal epithelial cells. RCC remains to be a challenging public health problem worldwide. Metastases that are resistant to radiotherapy and chemotherapy are the major cause of death from cancer. However, the underlying molecular mechanism regulating the metastasis of RCC is poorly known. Publicly available databases of RCC were obtained from Gene Expression Omnibus (GEO) database. The differentially expressed genes (DEGs) were identified using GEO2R analysis, whereas the Gene Ontology (GO) analysis and Kyoto Encyclopedia of Genes and Genomes (KEGG) analysis were performed by Gene Set Enrichment Analysis (GSEA) and Metascape. Protein–protein interaction (PPI) network of DEGs was analyzed by STRING online database, and Cytoscape software was used for visualizing PPI network. Survival analysis of hub genes was conducted using GEPIA online database. The expression levels of hub genes were investigated from The Human Protein Atlas online database and GEPIA online database. Finally, the comparative toxicogenomics database (CTD; http://ctdbase.org) was used to identify hub genes associated with tumor or metastasis. We identified 229 DEGs comprising 135 downregulated genes and 94 upregulated genes. Functional analysis revealed that these DEGs were associates with cell recognition, regulation of immune, negative regulation of adaptive immune response, and other functions. And these DEGs mainly related to P53 signaling pathway, cytokine–cytokine receptor interaction, Natural killer cell mediated cytotoxicity, and other pathways are involved. Ten genes were identified as hub genes through module analyses in the PPI network. Finally, survival analysis of 10 hub genes was conducted, which showed that the MMP2 (matrix metallo peptidase 2), DCN, COL4A1, CASR (calcium sensing receptor), GPR4 (G protein-coupled receptor 4), UTS2 (urotensin 2), and LDLR (low density lipoprotein receptor) genes were significant for survival. In this study, the DEGs between RCC and metastatic RCC were analyzed, which assist us in systematically understanding the pathogeny underlying metastasis of RCC. The MMP2, DCN, COL4A1, CASR, GPR4, UTS2, and LDLR genes might be used as potential targets to improve diagnosis and immunotherapy biomarkers for RCC.
1. Introduction
Renal cell carcinoma (RCC) is the ninth most common cancer in the world, which has historically been a difficult carcinoma that targets people in the fifth and sixth decades of life (Jonasch et al., 2014). RCC has various histological and molecular subtypes and is characterized by invasive growth, poor prognosis, and high recurrence. It has been reported that there are many ways to treat RCC, including surgical resection, chemotherapy, radiation therapy, immunotherapy, and targeted biologics (Posadas et al., 2017). However, patients not suitable for surgery are afforded little chance for long-term survival. The most recent data indicate that more than 330,000 new cases have been diagnosed and result in more than 13,000 deaths per year. Numerous studies have shown that the cause of death in RCC patients is mainly metastasis. Although kidney examination is easy, there are many patients who remain undiagnosed until metastasis clinical stage, which have poor prognosis. Thus, it is necessary to identify appropriate molecular biomarkers for stage diagnosis and potential targets for RCC therapy.
In the past decades, the bioinformatics technology has been generally put into use to excavate the potential genetic targets of diseases, which could provide the molecular backgrounds, regulatory pathways, and networks of cellular activities in RCC and metastatic renal cell carcinoma (mRCC). The Gene Expression Omnibus (GEO; www.ncbi.nlm.nih.gov/geo) is an international public database, which stores public array and sequence based functional genomics data. We query and download gene expression profiles from GEO database, and then we find valuable clues for future research by reanalyzing some data.
In this work, we obtain two original microarray datasets GSE12606 and GSE19949 from GEO database. GEO2R was used to search for differentially expressed genes (DEGs) that were differentially expressed between RCC and mRCC. Gene ontology (GO) function and Kyoto Encyclopedia of Genes and Genomes (KEGG) analysis of DEGs were performed. STRING online database was performed to develop an integration of DEGs protein–protein interaction (PPI) network. Then a set of hub genes were identified based on PPI network. Survival analysis of hub genes was performed on the GEPIA online database (http://gepia.cancer-pku.cn), whereas the expression levels of hub genes were shown by The Human Protein Atlas online database and GEPIA online database. Identification of hub genes associated with tumor or metastasis was performed on CTD. This work provided a novel perspective to understand the underlying molecular mechanism in RCC metastasis, which could provide more potential biomarkers for diagnosis and therapy.
2. Methods
2.1. Access to public data
GEO database (www.ncbi.nlm.nih.gov/geo) is an open functional genomics database of high-throughput resource, including microarrays, gene expression data, and chips. Two expression profiling datasets GSE12606 and GSE19949 were obtained from GEO database. The probes would be transformed into the homologous gene symbol by means of the platform's annotation information. The GSE12606 dataset contained three tumor tissue samples and three metastatic tissue samples. GSE19949 dataset contained 98 tumor tissue samples and 15 metastatic tissue samples.
2.2. Identification of DEGs
GEO2R (www.ncbi.nlm.nih.gov/geo/geo2r) is an interactive online tool to identify DEGs by comparing samples from GEO series. GEO2R was used to search for in messenger RNAs (mRNAs; DEGs) that were differentially expressed between tumor tissue samples and metastatic tissue samples. The cutoff criteria were an adjusted p-value of <0.05, whereas the logFC value was ≥1 or ≤−1. Then the DEGs that were screened by the two datasets were introduced into the FunRich (www.funrich.org), and the Venn plots were used to intersect the two datasets to obtain the common DEGs. DEGs of two datasets and common DEGs were visualized with volcano map and hierarchical clustering heat map. The volcano maps were drawn using the volcano plotting tool (https://shengxin.ren). Three hierarchical clustering heat maps of DEG expression (top 10 unregulated genes and top 10 downregulated genes) were visualized with FunRich software.
2.3. Functional annotation of DEGs by GO and KEGG analyses
GO is an ontology widely used in bioinformatics, which covers three aspects of biology, biological processes, molecular functions, and cellular components. KEGG is a set of high throughput genes and protein pathways. Metascape (http://metascape.org/gp/index.html#/main/step1), one online analysis tool suite with the function of Integrated Discovery and Annotation, mainly provides typical batch annotation and gene-GO term enrichment analysis to highlight the most relevant GO terms associated with a given gene list. GO and KEGG pathway enrichment analysis were performed for identified DEGs using Metascape analysis. Gene Set Enrichment Analysis (GSEA) is also an analysis tool that can provide functional and pathway enrichment analysis. GSEA 2–2.2.3 (JAVA version) was downloaded from the GSEA website (http://software.broadinstitute.org/gsea/index.jsp). Then, the downloaded dataset was imported using the GSEA software. This process was repeated 1000 times for each analysis according to the default weighted enrichment statistical method. All p value <0.05 was set as the cutoff criterion.
2.4. Construction and analysis of PPI network
STRING online database (http://string-db.org) could predict and trace out the PPI network after importing the common DEGs to Search Tool for the Retrieval of Interacting Genes. STRING database was used for construction of PPI network of DEGs. Cytoscape (version 3.6.1), a free visualization software, was applied to visualize PPI networks and find hub genes.
2.5. Expression levels of hub genes
The Human Protein Atlas (www.proteinatlas.org) could analyze the distribution and relative abundance of all proteins in human normal cells and tissues and determine the subcellular localization of each protein. The Human Protein Atlas was used to validate altered gene expression patterns at the protein level in RCC tissue. To confirm our results, we validated the hub genes using GEPIA online database.
2.6. Survival analysis
Survival analysis was performed on the GEPIA online database (http://gepia.cancer-pku.cn), to analyze the effect of the hub gene on overall survival (OS) in patients with RCC.
2.7. Identification of hub genes associated with tumor or metastasis
The CTD (http://ctdbase.org) was used to find integrated chemical–gene, chemical–disease, and gene–disease interactions to generate expanded networks and predict novel associations. The relationships between gene products and tumor or metastasis were analyzed by this database.
3. Results
3.1. Identification of DEGs in RCC and mRCC
The analysis of the GSE12606 and GSE19949 datasets (Table 1) identified 229 DEGs (Fig. 1). We obtained 1377 DEGs from GSE12606, upregulated 673 genes and 704 downregulated genes, whereas 2676 DEGs from GSE19949, upregulated 850 genes and downregulated 1826 genes. There are 229 common DEGs from 2 datasets. The Volcano plots of GSE12606, GSE19949 and common DEGs are shown in Figure 2. The heat maps of two datasets and common DEG expression are shown in Figure 3.

The common DEGs among GSE12606 and GSE19949. DEGs, differentially expressed genes.
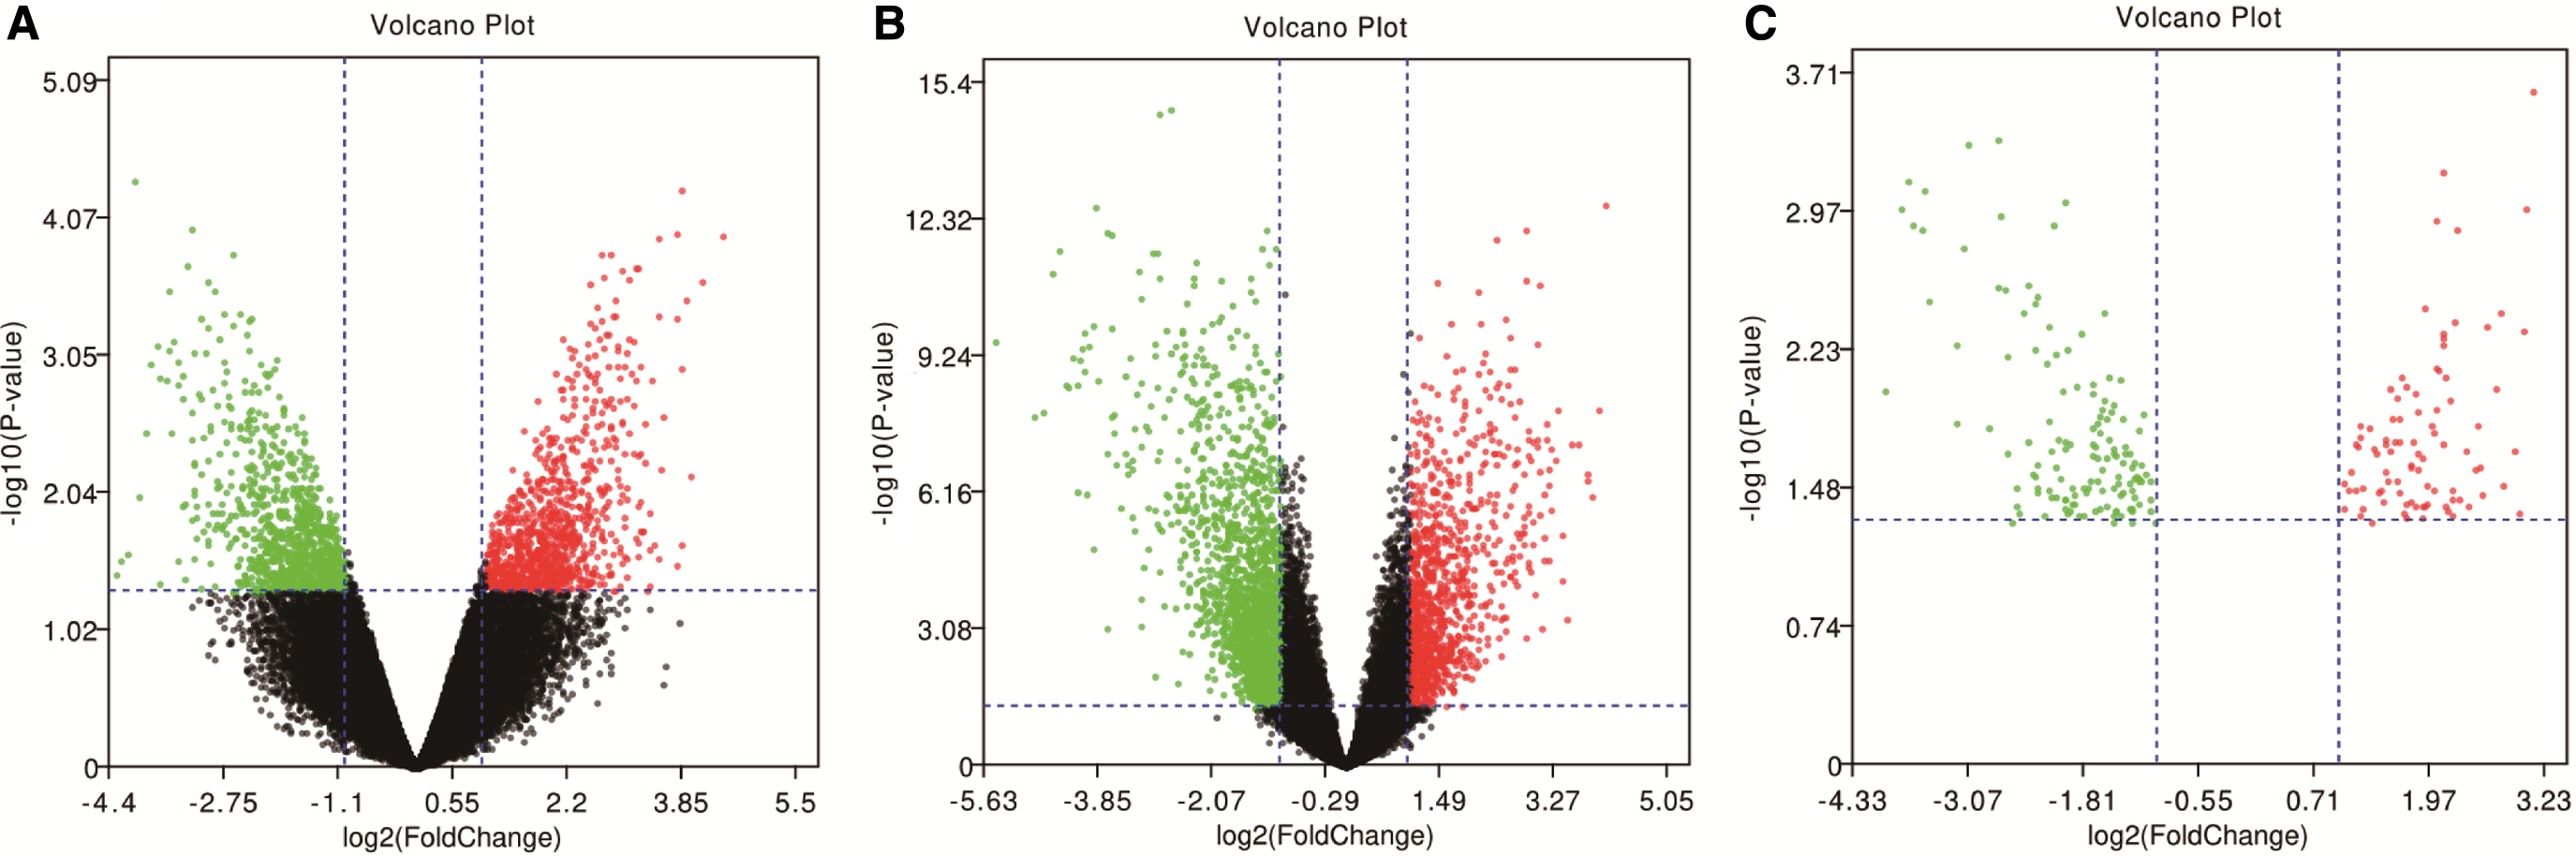
Volcano plots of genes that have different expressions between RCC tissues and metastatic RCC tissues in kidney. X-axis represents the fold change (log-scaled), and Y-axis represents the p value (log-scaled). Each symbol represents a different gene. The red color of the symbols means upregulated, whereas the green color of the symbols means downregulated.
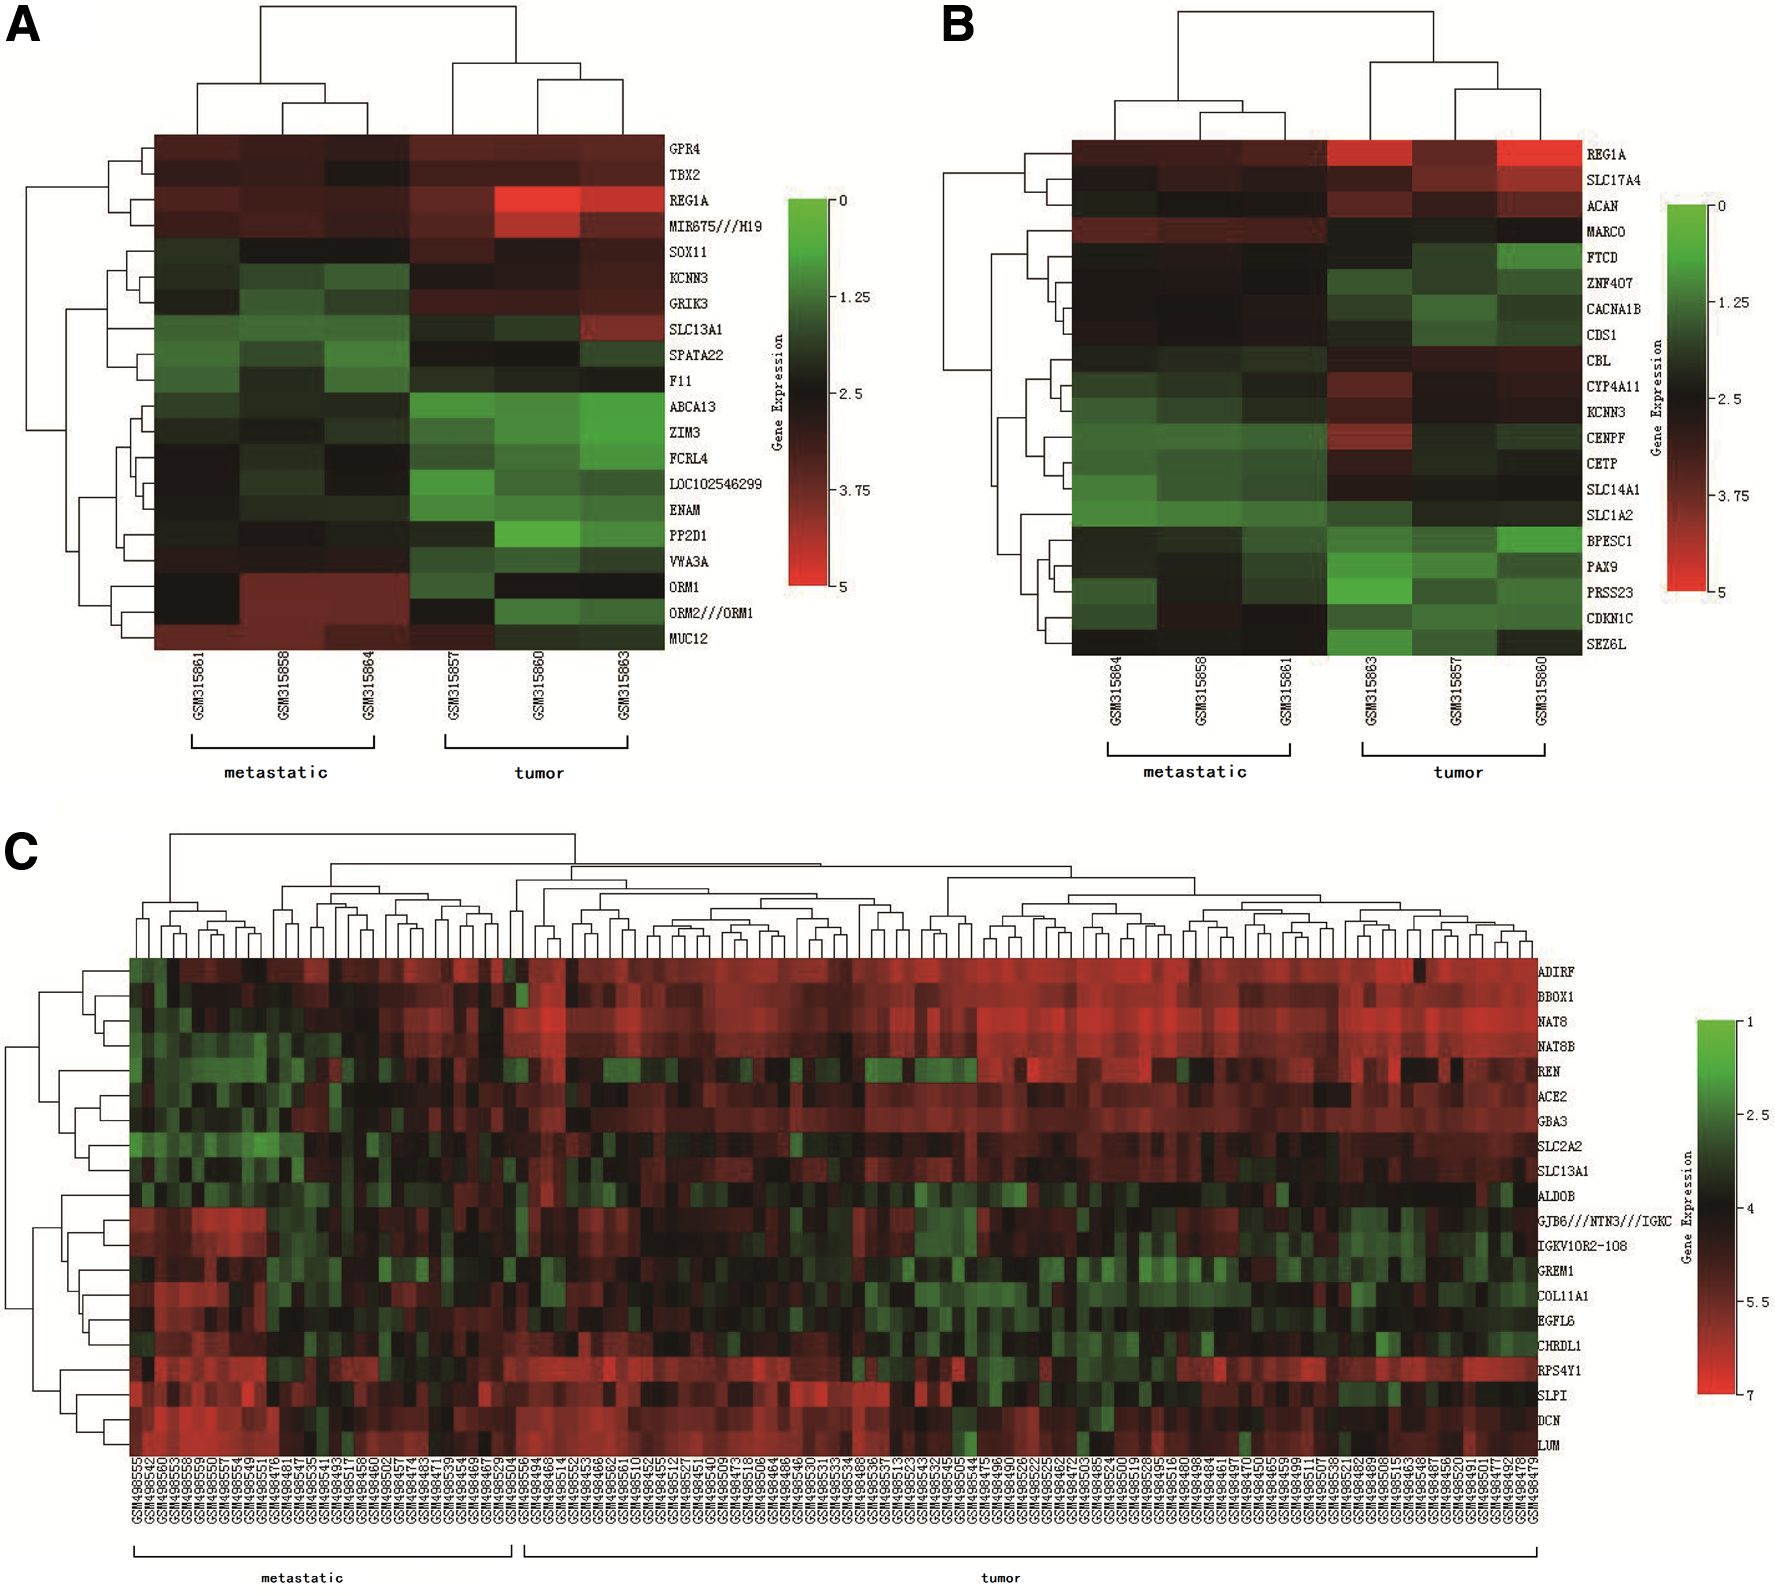
Hierarchical clustering heat map of the DEGs between RCC tissues and metastatic RCC tissues in kidney.
A Summary of Renal Cell Carcinoma Microarray Datasets from Different Gene Expression Omnibus Datasets
3.2. Functional and pathway enrichment analysis
GO analysis consists of three items: biological processes (BP), molecular functions (MF), and cellular components (CC). The results of GO analysis presented that variations in BP of GSE12606 were mainly enriched in cell–cell recognition, disruption of cells of other organism, negative regulation of adaptive immune response, plasma membrane fusion, positive regulation of translational initiation, regulation of heterotypic cell–cell adhesion, regulation of hydrogen peroxide-induced cell death, and regulation of T cell differentiation. The variations in the CC of GSE12606 were significantly enriched in CXCR chemokine receptor binding, gamma-tubulin complex, keratin filament, and proteasome accessory complex. With regards to the MF, the GSE12606 was observably enriched in
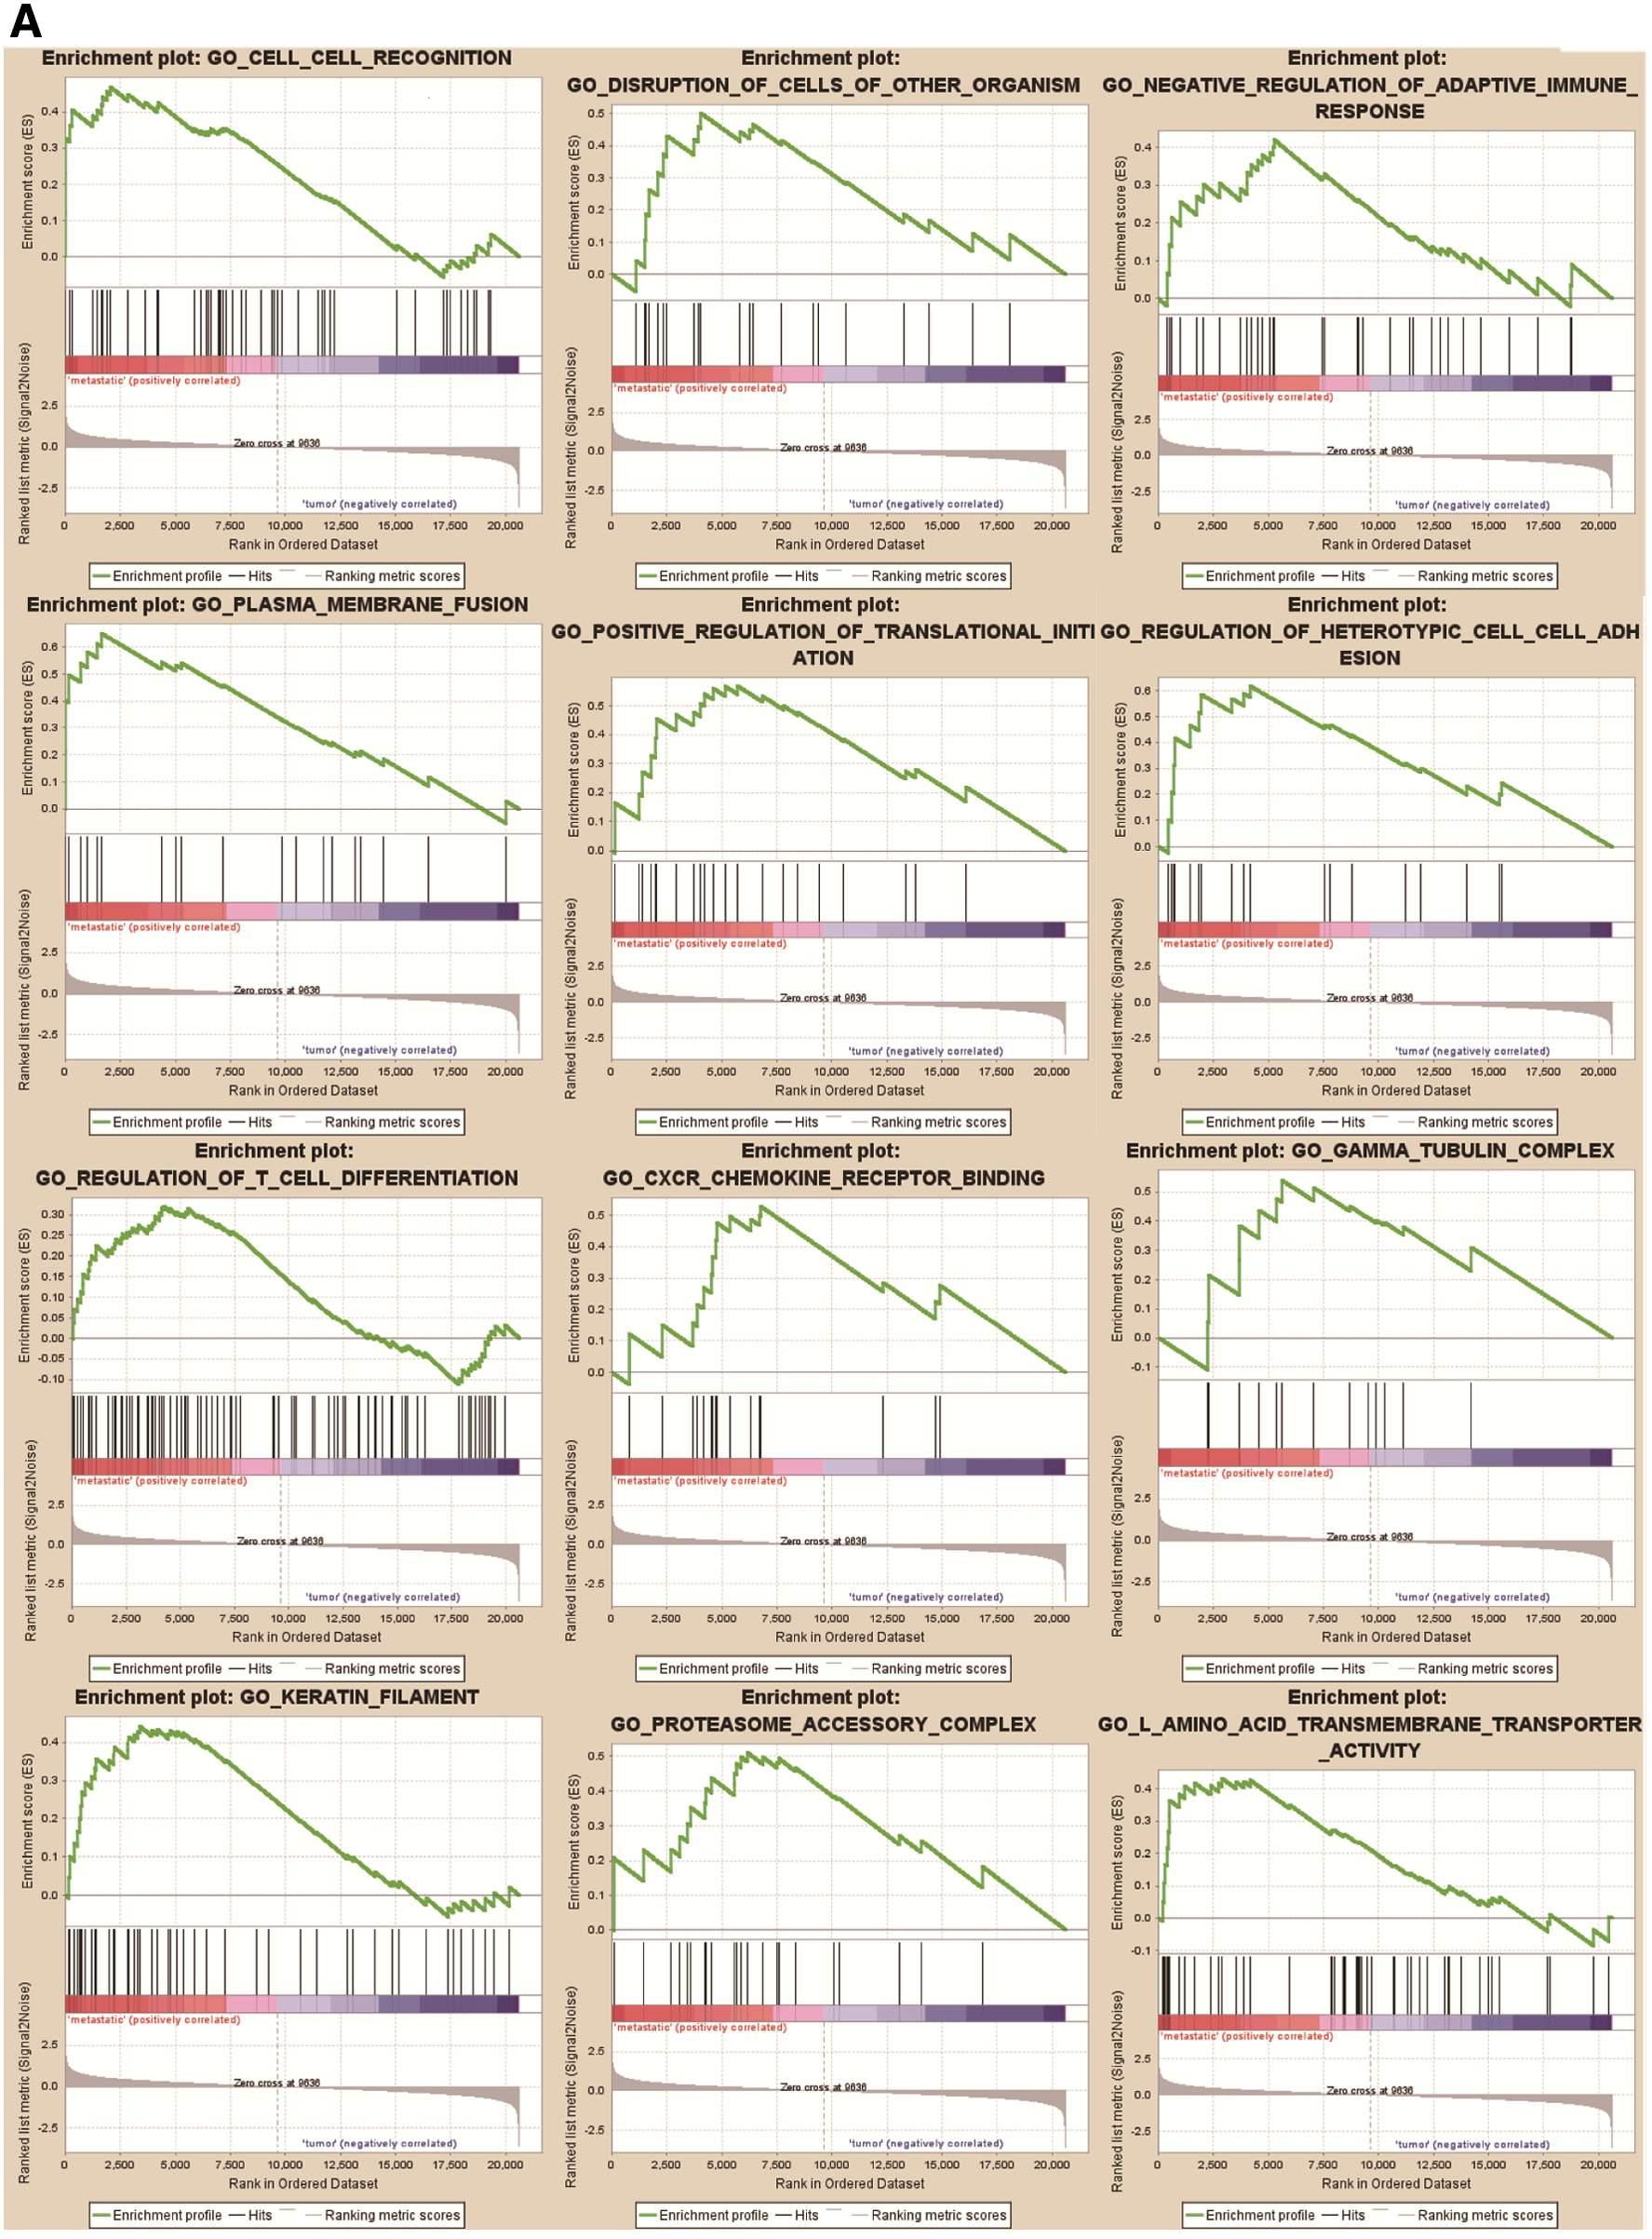
Functional enrichment analysis of the DEGs by GSEA.
The results of GO analysis presented that variations in the BP of GSE19949 were significantly enriched in anaphase-promoting complex-dependent catabolic process, humoral immune response mediated by circulating immunoglobulin, innate immune response activating cell surface receptor signaling pathway, NIK/NF-kappaB signaling, positive regulation of Wnt signaling pathway, and tumor necrosis factor-mediated signaling pathway. The results of GO analysis presented that variations in CC of GSE19949 were mainly enriched in chromosome centromeric region, autophagosome membrane, condensed chromosome, kinetochore, and phagocytic vesicle membrane. No function was enriched in MF (Fig. 4B).
Analysis of KEGG pathway displayed that the top canonical pathways associated with GSE12606 were Cytokine–cytokine receptor interaction, Homologous recombination, NOD-like receptor signaling pathway, Nucleotide excision repair, Primary immunodeficiency, and Proteasome (Fig. 4C), while analysis of KEGG pathway displayed that the GSE19949 was enriched in Cytokine–cytokine receptor interaction, extracellular matrix (ECM)-receptor interaction, Natural killer cell mediated cytotoxicity, NOD-like receptor signaling pathway, p53 signaling pathway, Primary immunodeficiency, Proteasome, and Toll-like receptor signaling pathway (Fig. 4D).
Functional and pathway enrichment analysis of the DEGs was performed using the Metascape. These Metascape results were dominated by ECM organization, blood vessel morphogenesis, renal system development, pulmonary valve morphogenesis, epithelial tube morphogenesis, wound healing, Protein digestion and absorption, embryonic morphogenesis, trans-synaptic signaling, skeletal system development, developmental process involved in reproduction, cell-substrate adhesion, chordate embryonic development, embryonic epithelial tube formation, autonomic nervous system development, regulation of actin filament depolymerization, regulation of membrane potential, Platelet activation, signaling and aggregation, neural retina development, and NABA MATRISOME ASSOCIATED (Fig. 5).
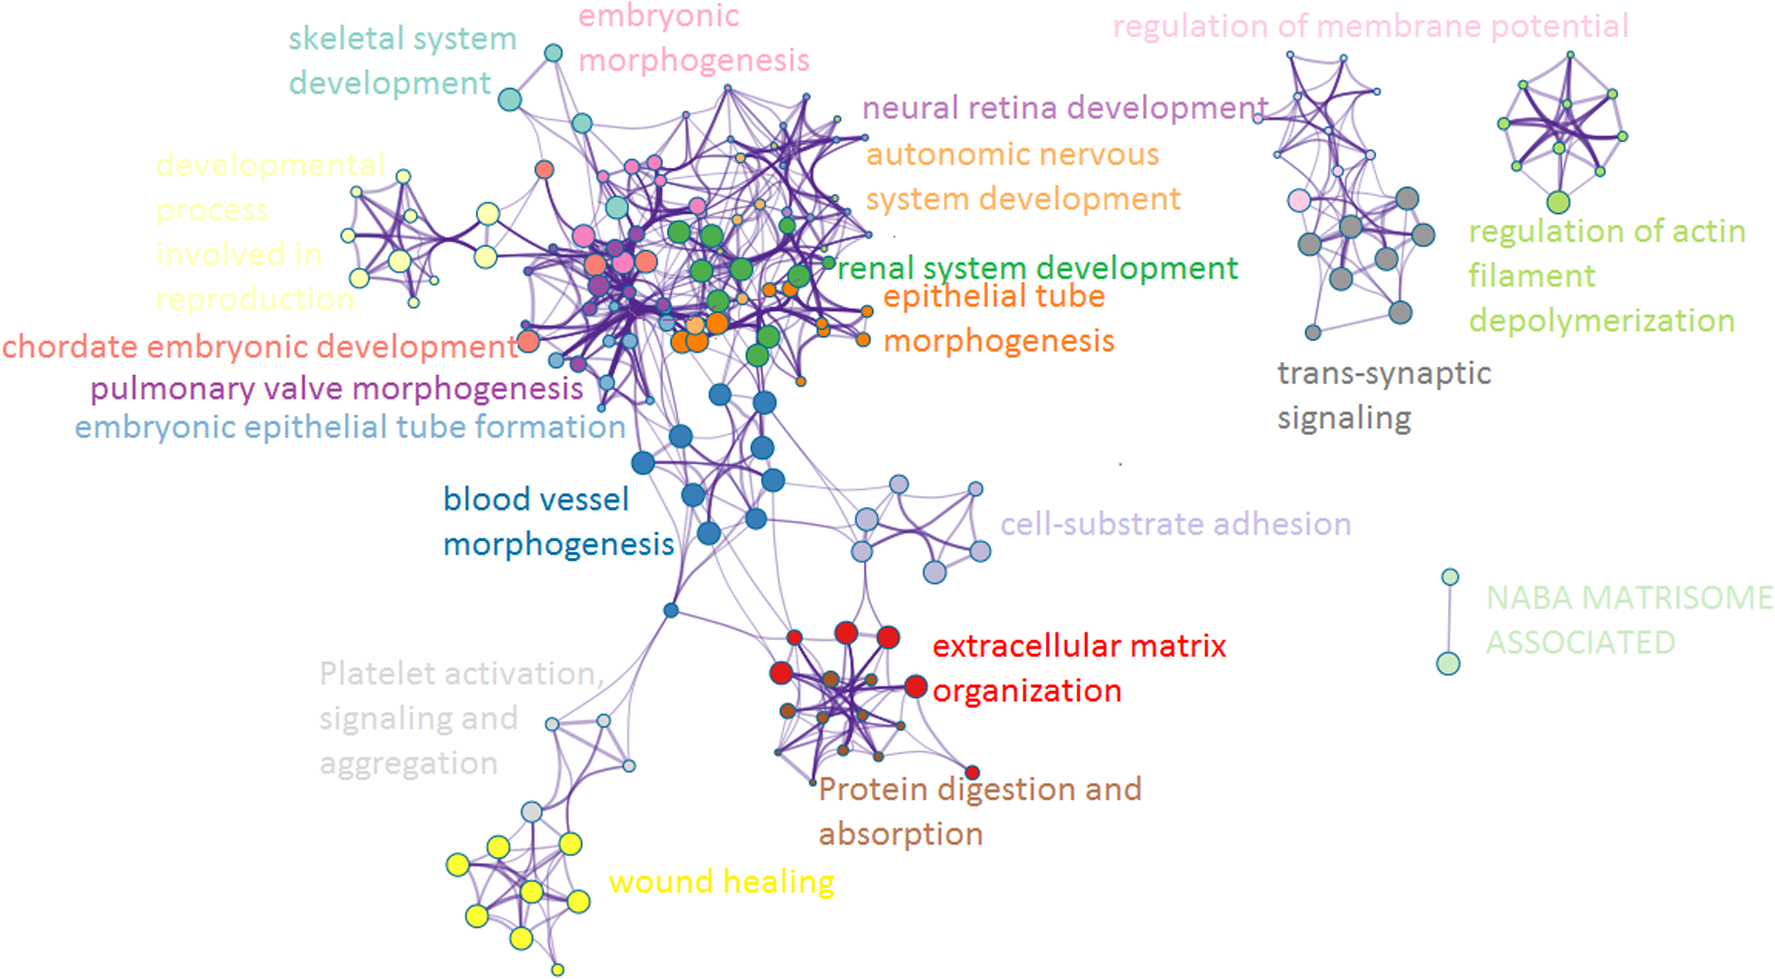
Functional enrichment analysis of the common DEGs by Metascape.
3.3. PPI network construction and analysis of modules
The PPI network of DEGs was constructed by STRING online database and Cytoscape software (Fig. 6A). The top 10 highly connected genes (hub genes) were DCN, COL4A1, COL2A1, IGF1 (insulin like growth factor 1), MMP2 (matrix metallo peptidase 2), LDLR (low density lipoprotein receptor), GPR4 (G protein-coupled receptor 4), CASR (calcium sensing receptor), TBXA2R (thromboxane A2 receptor), and UTS2 (urotensin 2) (Fig. 6B). MMP2, DCN, IGF1, COL4A1, UTS2, and LDLR were upregulated, and other gene expressions were downregulated.

PPI network and hub genes.
3.4. Validation of the hub genes
To further validate our results, we used the GEPIA online database. Based on the GEPIA, we found that the expressions of the hub gene were different between nonmetastasis and metastasis (Fig. 7).
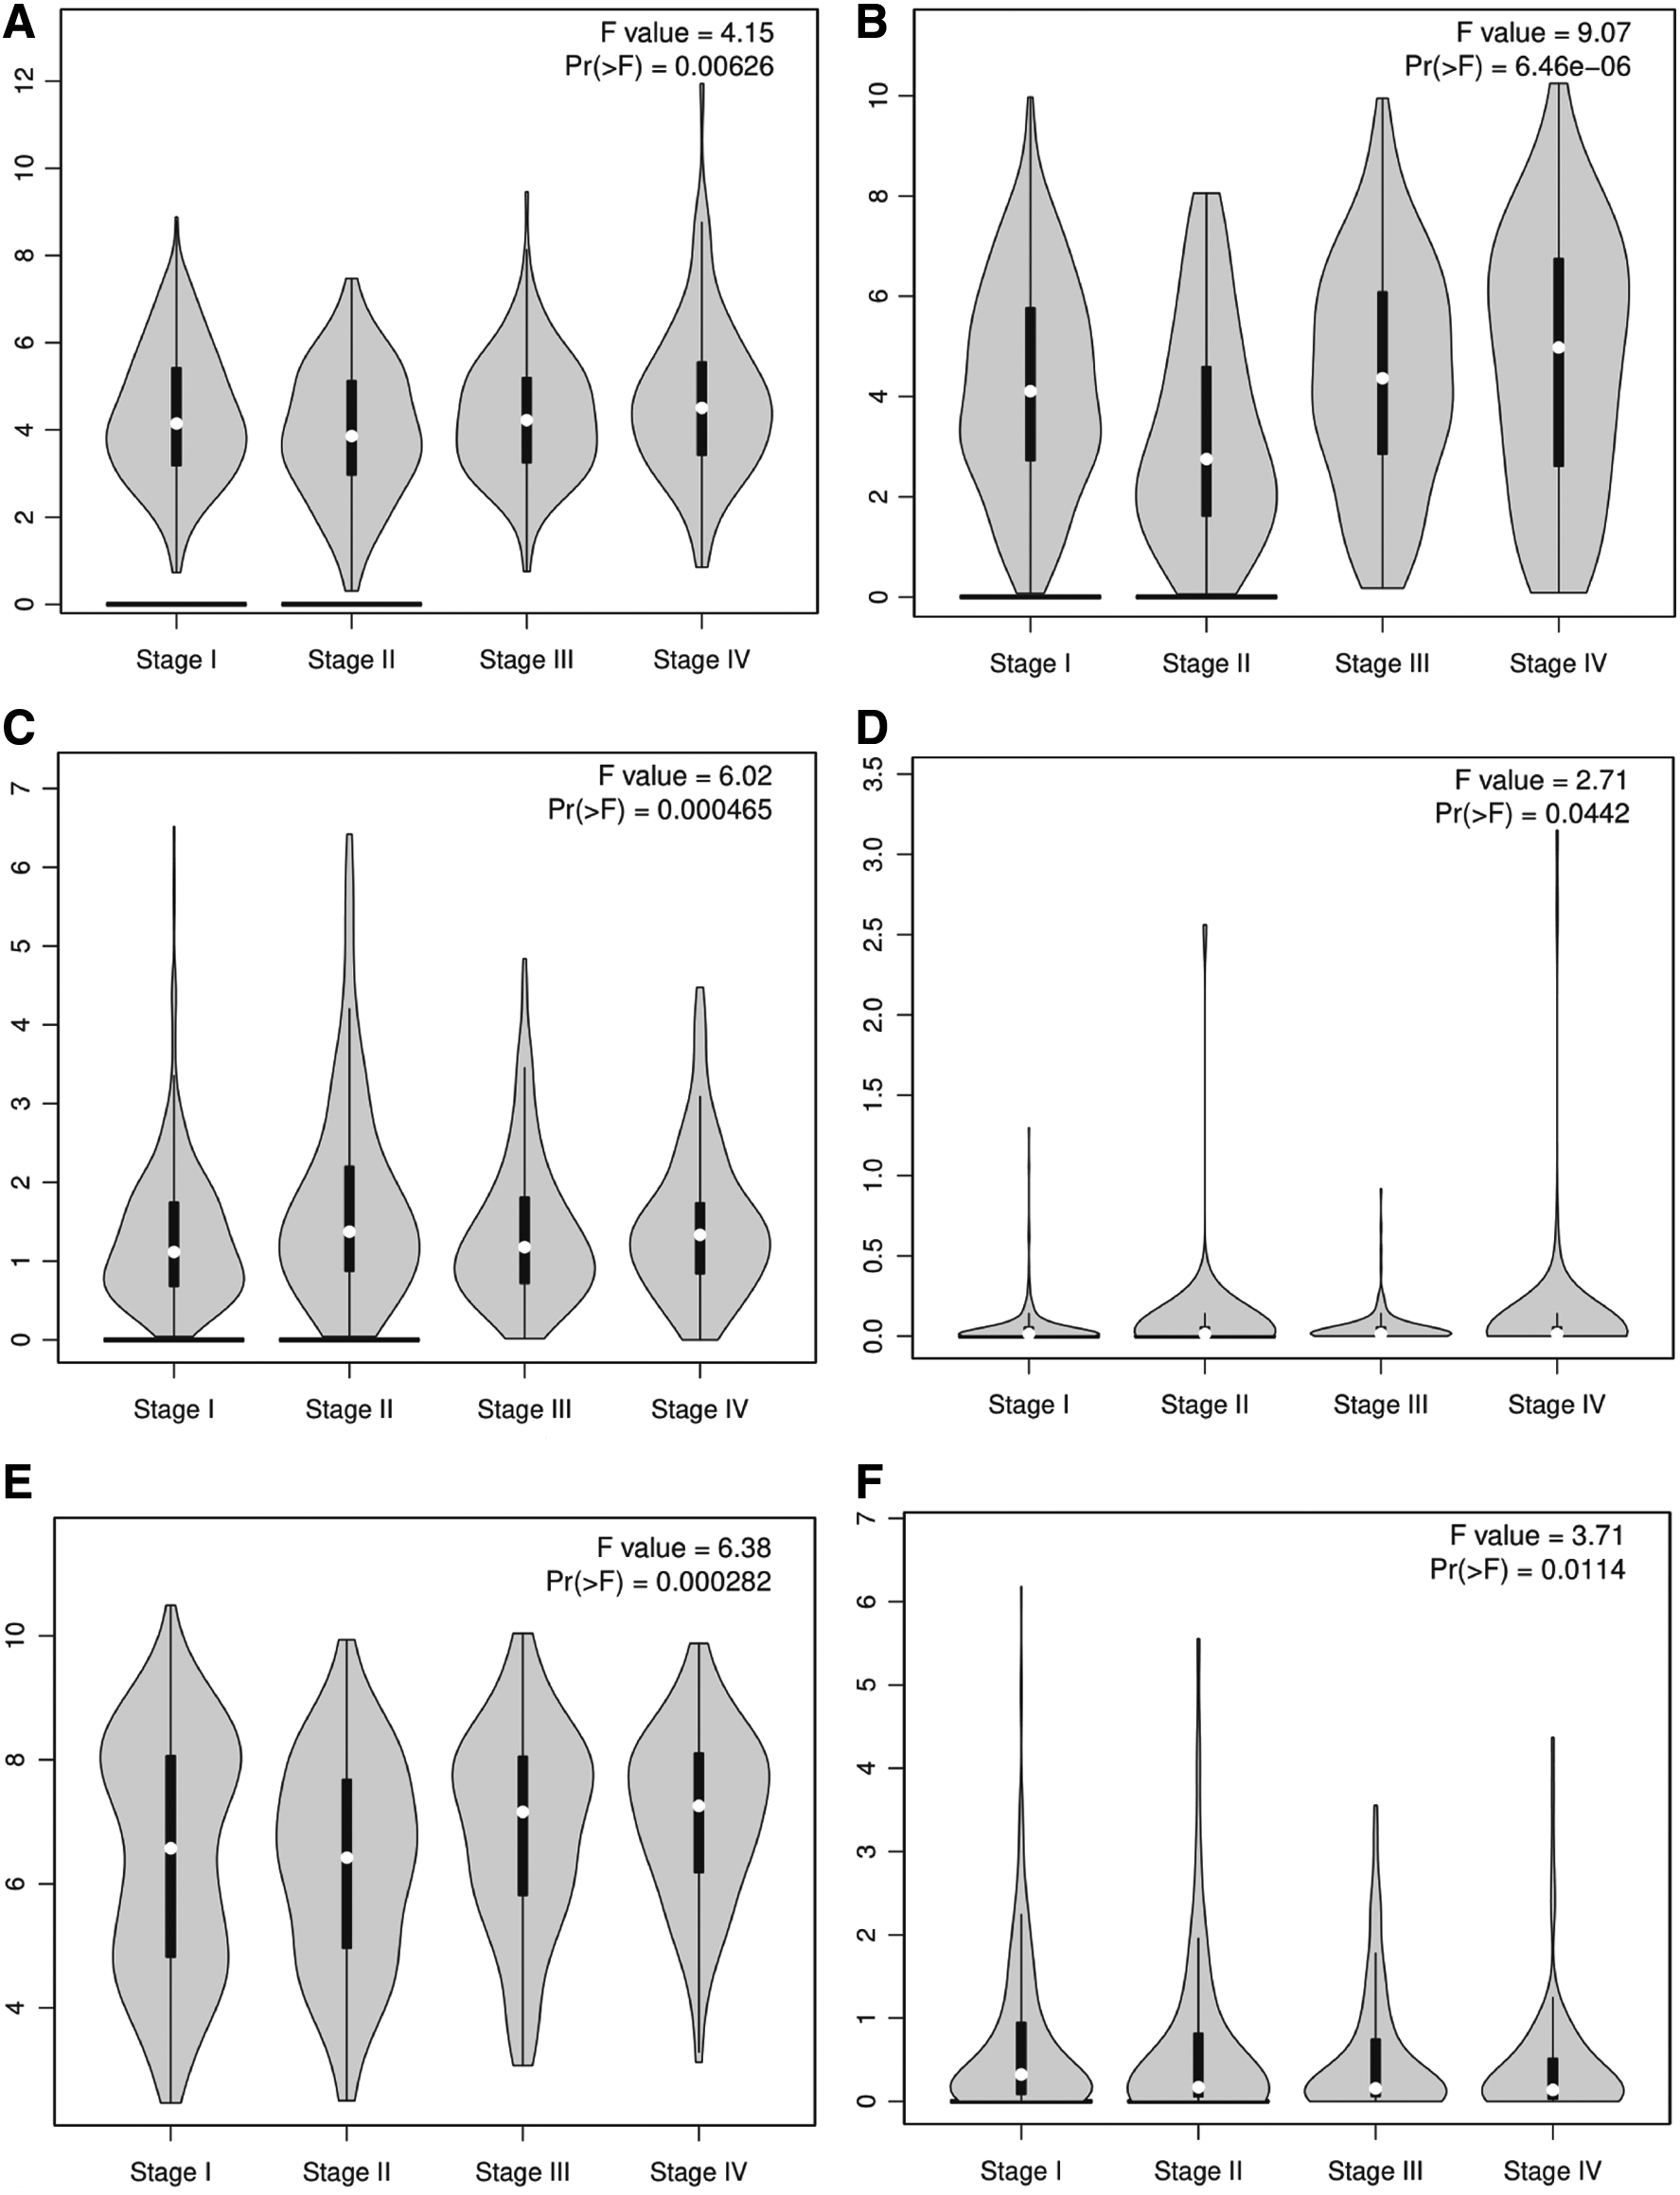
Validation of the hub genes in the Cancer Genome Atlas (TCGA) database. Pathological Stage Plot showing the expression of the hub genes in mRNA expression in RCC tissues, using data from the TCGA database in GEPIA. The statuses of the expression of eight genes were the same as in our study, and their p-values <0.05 (TBXA2R and UTS2 were not statistically significant).
3.5. Immunohistochemistry validation of hub gene using the Human Protein Atlas database
To further confirm the aforementioned results, hub gene protein expression was analyzed in clinical specimens from The Human Protein Atlas. These tissue samples are from renal cancer in the Human Protein Atlas (Fig. 8). COL2A1, CASR, and TBXA2R were not found in the Human Protein Atlas.

Validation of the hub genes on a translational level using the Human Protein Atlas database.
3.6. Survival analysis
The OS rate analysis of the hub genes displayed that MMP2, DCN, COL4A1, CASR, GPR4, UTS2, and LDLR may play a key role in the OS rate in patients with RCC. Among these genes, only CASR and LDLR were positively correlated with the OS rate in patients with RCC. And MMP2, DCN, COL4A1, GPR4, and UTS2 were negatively correlated with the OS rate in patients with RCC (p < 0.05) (Fig. 9).

Survival curve of hub genes (MMP2, DCN, COL4A1, CASR, GPR4, UTS2, and LDLR). All of these genes are correlated with OS of patients with RCC. Data were analyzed by GEPIA. Patients with expression above the median are indicated in red line, and patients with expressions below the median in black line. HR.
3.7. Identification of hub genes
The CTD database showed that hub genes targeted tumor or metastasis system, which appears in Figure 10.
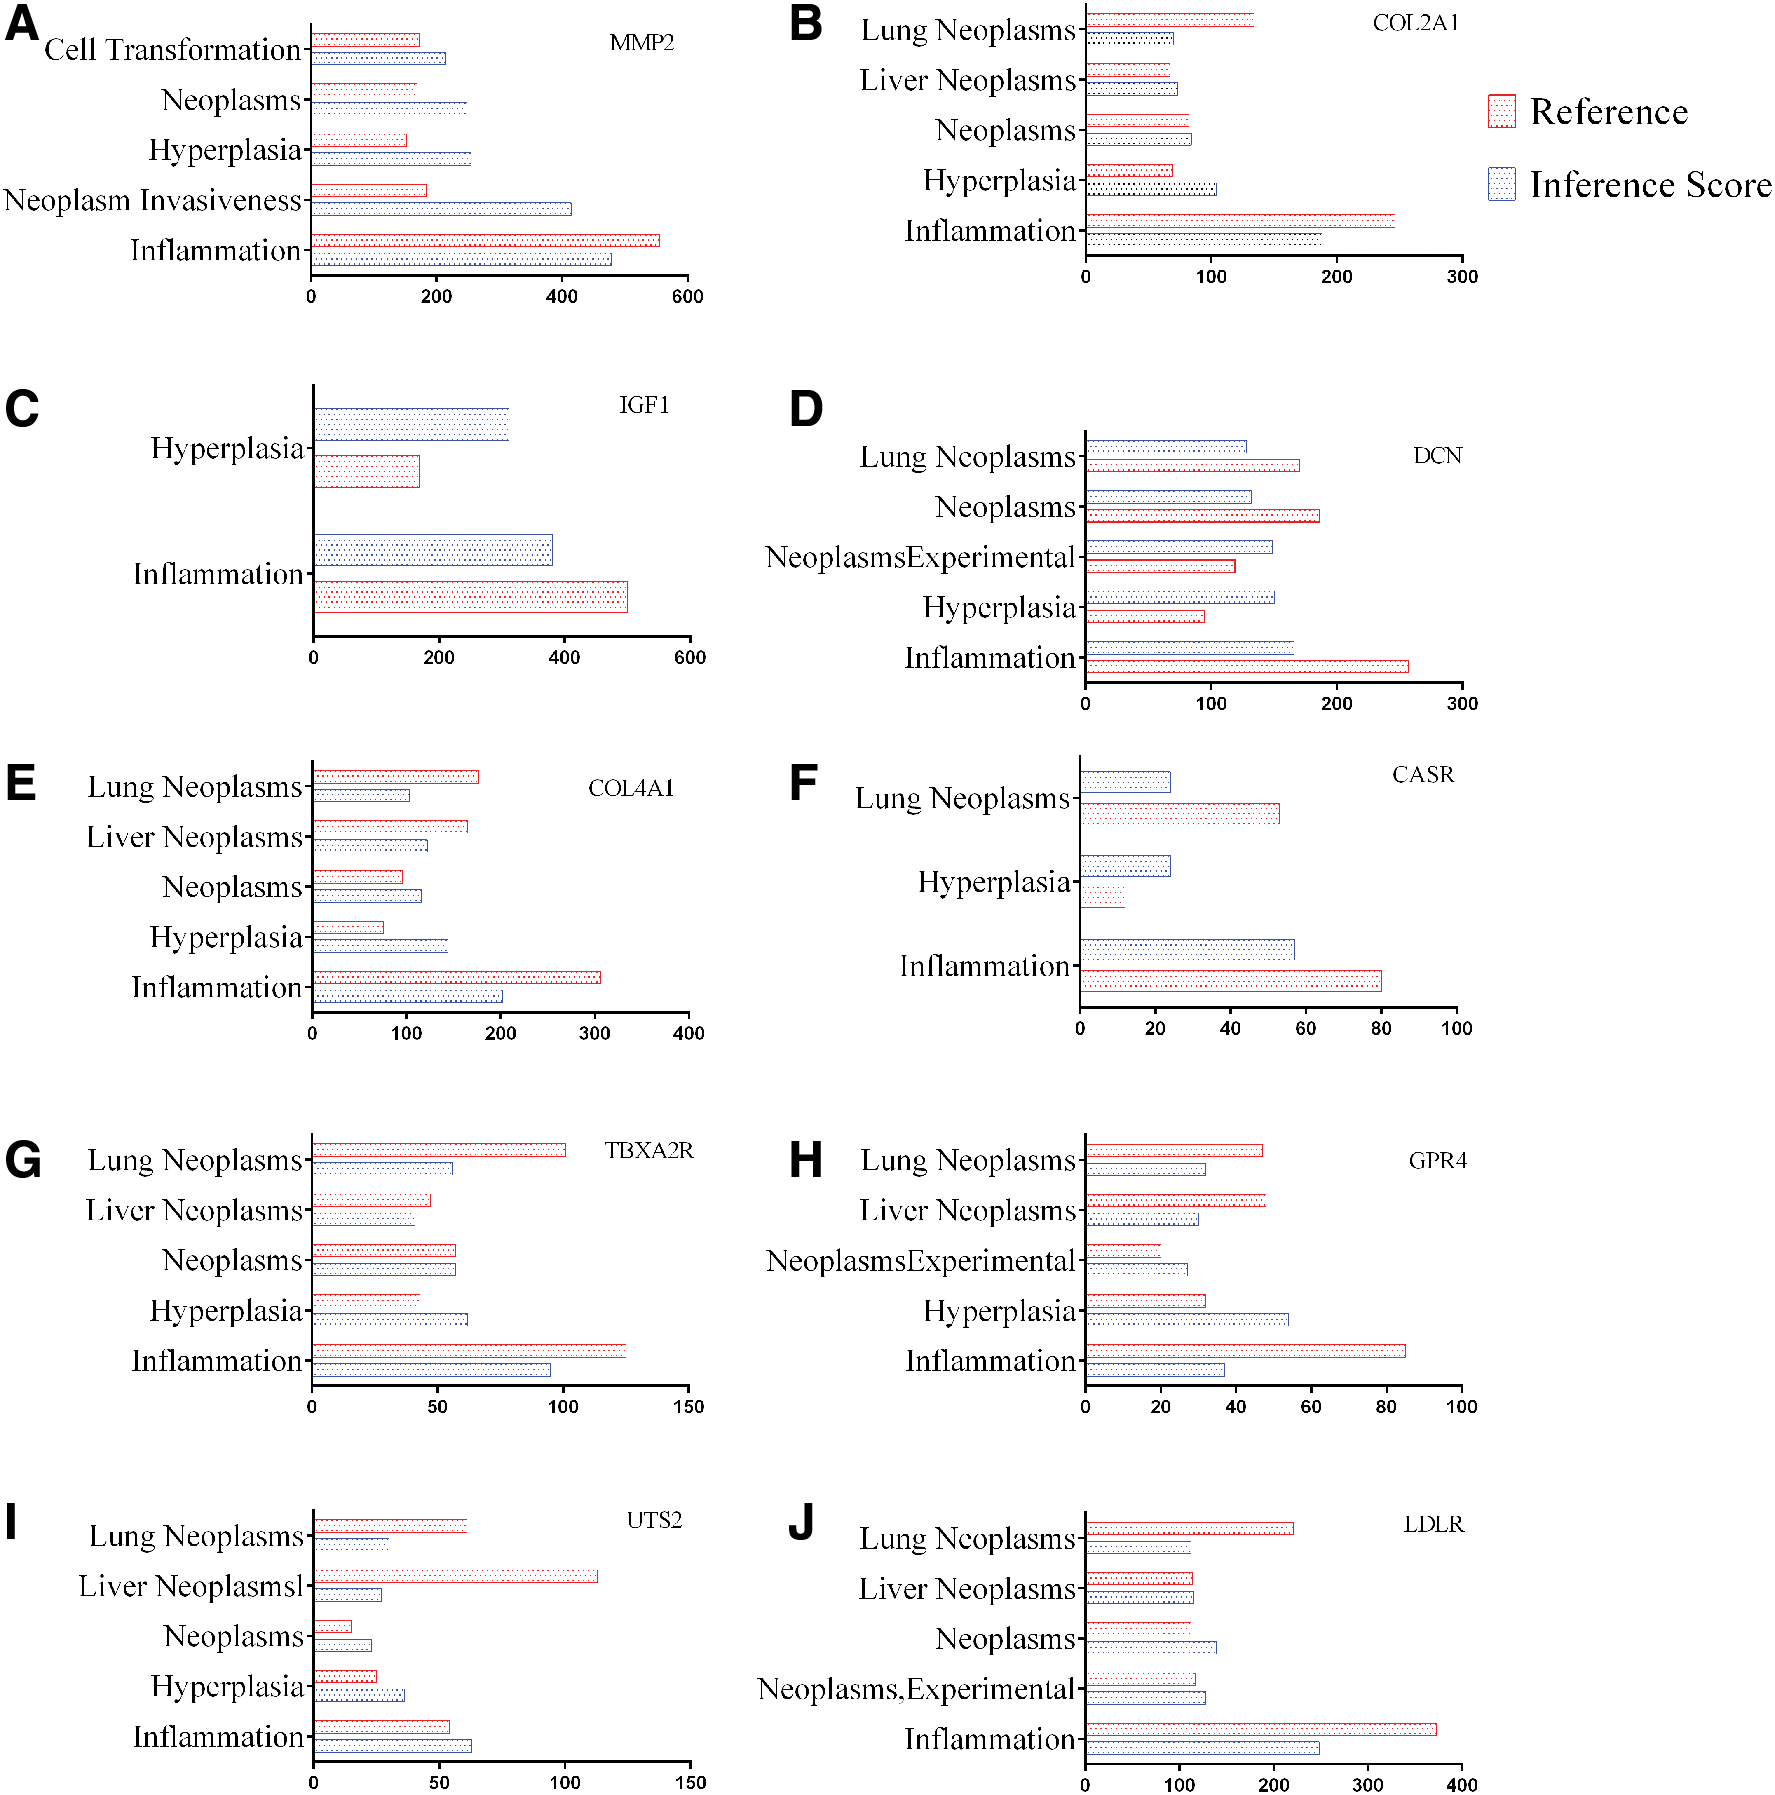
Relationship to tumor or metastasis related to hub genes based on the CTD database.
4. Discussion
RCC is among the most commonly diagnosed solid tumors; however, until recently there were few systemic treatment options for this disease. This malignancy is associated with high mortality and severe morbidity. Despite commendable progress in the prevention, detection, and treatment of RCC, the prognosis of patients with RCC is still poor. Numerous studies have shown that surgical treatment at early stage is the most suitable therapy for RCC patients (Posadas et al., 2017). However, because of high frequency of intrarenal and extrarenal metastasis, there are many patients who remain undiagnosed until an advanced clinical stage and are not suitable for surgery, which leads to poor prognosis of RCC. The key point to improve survival rate and prognosis is early detection before metastasis occurred. The pathogenesis of cancer metastasis consists of a series of sequential and interrelated steps, such as vascularization, the enhanced expression of a series of enzymes, and immune evasion. However, the underlying molecular mechanisms in RCC remain unclear. Our study may significantly advance our understanding of RCC and lead to more effective prevention and detection of RCC metastasis.
In this study, we obtained gene-expression-profile dataset GSE12606 and GSE19949 from GEO database. Based on GO enrichment analysis of GSE12606, regarding the “biological processes” category, “cell–cell recognition” has the highest enrichment score in the “biological process” category, which could regulate recognition of tumor cells by NK cells (Fuchs and Colonna, 2006). “Negative regulation of adaptive immune response” could enhance immune evasion (Liu and Shipp, 2017; Zuo et al., 2017). It has been reported that “plasma membrane fusion” is associated with targeting metastatic cancers (Lauritzen et al., 2015; Nicolson, 2015). “Regulation of hydrogen peroxide-induced cell death” is associated with cell apoptosis, which plays a key role in cancer metastasis (Zou et al., 2016; Burikhanov et al., 2017; Wang et al., 2017). Moreover, “regulation of T cell differentiation” is highly correlated with objective clinical responses for patients with advanced cancer (Zhang et al., 2018).
Regarding the “cellular component” category, “CXCR chemokine receptor binding” shows the highest score; CXCR7 is primarily expressed on tumor-associated endothelium, which plays an important role in angiogenesis and lymphangiogenesis (Wu et al., 2016). For the MF category, “
For the KEGG analysis of GSE12606, “Cytokine–cytokine receptor interaction” has the highest enrichment score; cytokines are proposed to play important roles in tumor biology especially brain tumor biology, which may be associated with brain metastases (Ilyin et al., 2000). “Nucleotide excision repair” could result in cancer predisposition, which has been reported in head and neck cancers, colorectal cancer, and skin cancer (Marteijn et al., 2014; Kap et al., 2016; Merolla et al., 2016; Pawlowska et al., 2016). For the KEGG analysis of GSE19949, “Cytokine–cytokine receptor interaction” has the highest enrichment score too. “ECM-receptor interaction” is associated with kidney cancer cell proliferation and invasion (Zhang et al., 2016). Moreover, for “p53 signaling pathway,” previous study has shown that p53 is a key tumor suppressor and p53 pathway holds the potential to induce selective cell death in tumor cells (Richardson et al., 2017; Wei and Wang, 2017).
In this study, we have identified common DEGs from two independent datasets. Based on GO and KEGG enrichment analysis of the common DEGs among different datasets, “extracellular matrix organization” has the highest enrichment score, which is associated with tumor metastasis (Gilkes et al., 2014; Tzanakakis et al., 2018), while “blood vessel morphogenesis” is associated with tumor metastasis too (Wenes et al., 2016; Weichand et al., 2017). It has been known that “epithelial tube morphogenesis” is the major cause of the epithelial-to-mesenchymal transition, which is a highly conserved morphogenetic program essential for cancer metastasis (Jimenez et al., 2016). Finally, “cell-substrate” is a critical process for the control of invasion and metastasis of cancer cells; the deregulation of this function is linked to the promotion of more aggressive and metastatic cancers in humans (Singh et al., 2012; Ravasio et al., 2015).
PPI network analysis provides detailed interaction/connection among the common DEGs. The top 10 hub genes were DCN, COL4A1, COL2A1, IGF1, MMP2, LDLR, GPR4, CASR, TBXA2R, and UTS2. DCN (decorin) encodes a member of the small leucine-rich proteoglycan family of proteins, and it has been reported that DCN overexpression could inhibit RCC cell proliferation and metastasis by unregulated P21 and E-cadherin expression (Xu et al., 2016). COL4A1 (collagen type IV alpha 1 chain) and COL2A1 (collagen type II alpha 1) encode collagen protein and play a crucial role in tumor invasion through the induction of tumor budding (Miyake et al., 2017). GEPIA online database revealed that high expression of COL4A1 and COL2A1 was negatively associated with the OS rate in patients with RCC, which confirmed the role of these two genes. IGF1 (insulin like growth factor 1) is a member of a family of proteins involved in mediating growth and development. IGF1 was a key regulator of tissue growth and development, whereas IGF1 has been implicated in the initiation and progression of cancers (De Santi et al., 2016). MMP2 belongs to matrix metalloproteinase family; the upregulated MMP2 could lead cancer cells to more easily enter or exit the circulation (Xu et al., 2017; Zhu et al., 2017). LDLR is associated with metabolic reprogramming, which regulates glucose, glutamine, and lipid metabolism to supply the bioenergetics and biosynthetic demands of rapidly proliferating cancer cells (Guo et al., 2014).
GPR4 is a proton-sensing G-protein-coupled receptor coupling to multiple intracellular signaling pathways. It has been reported that overexpression of GPR4 in human tumors plays a role in driving or maintaining tumor formation by inducing angiogenesis (Sin et al., 2004; Jing et al., 2016). CASR is a plasma membrane G protein-coupled receptor. Numerous studies have shown that CASR gene appears to be involved in cancer biology and physiology (Jeong et al., 2016; Yang et al., 2018). TBXA2R was a member of the G protein-coupled receptor family, while TBXA2R is highly expressed in aggressive tumors and linked with poor prognosis in breast cancer; TBXA2R thus may be a potential biomarker in RCC (Watkins et al., 2005; Orr et al., 2016). UTS2 is a somatostatin-like cyclic tiny peptide identified by its potent vasoconstrictor activity. There is strong evidence that suggests UTS2 as the significant contributor of angiogenesis, as well as cell proliferation and tumor biology (Sin et al., 2004; Jing et al., 2016).
In conclusion, our study profiled consistently DEGs between RCC tissues and metastatic RCC tissues in kidney, which play a key role in the development and metastasis of RCC. These novel biomarkers may have clinical utility for the diagnosis and prognosis of metastasis RCC. With these potential biomarkers, it is possible to diagnose metastasis RCC at an early stage. All of these may provide effective prevention, detection, and treatment.
Availability of Data and Materials
Data were obtained from GEO database (www.ncbi.nlm.nih.gov/geo).
Footnotes
Author Disclosure Statement
The authors declare there are no financial conflicts of interest.