
Abstract
Abstract
It is important to explore potential structural characteristics of biological networks and regulatory mechanisms of network behaviors at the system level. In this study, a dynamic Bayesian network structure search method (DBNSSM) based on a genetic algorithm is employed to infer and locate functional connections in pulsed neural networks (PNNs) as typical artificial neural networks. In the process of network structure searching, a minimum description length score is calculated for each candidate network structure. The score indicates two characteristics of the network structure: (1) the likelihood based on network dynamic response data and (2) the complexity. Both should be considered together on selecting network structures. The DBNSSM is applied to analyze time-series data from PNNs, thereby discerns functional connections showing network structures collectively. It is feasible to analyze multichannel electrophysiological data of biological neural networks using the DBNSSM.
1. Introduction
Molecular regulatory mechanisms in neural systems have been intensely studied, and basic processes of information handling by neurons have been well understood (Trimble et al., 1991; Schuldiner et al., 1995). However, few pieces of evidence indicate delicate structures of complex biological neural networks (BNNs) based on two major reasons (Wu et al., 2006; Greicius et al., 2009): (1) noninvasive measurements are absent to record the electrical activity of BNNs in high temporal and spatial resolutions; and (2) even if mass data are available, effective “inverse engineering” methods are still required to retrieve basic structure information and fundamental working mechanisms of BNNs.
Many substantial endeavors have been made to identify functional connections in BNNs. Some prospective experimental methods such as multiple neuron recordings (Kruger, 1983), voltage-sensitive dyes (Baker et al., 2005), and multielectrode arrays (Erickson et al., 2008; Kang et al., 2009; Spira and Hai, 2013) can simultaneously monitor electrical activities of a large number of neurons in real time, and provide multichannel neural spike data with sufficient temporal and spatial resolutions. Experimental data obtained through multichannel simultaneous recordings can produce multivariable datasets, containing abundant causal information on the investigated biological networks. Further, the datasets can be used to infer network structures and regulatory mechanisms. Thus, data-based inference of connective structures and secondary examination of underlying regulation mechanisms play a central role in cutting edge studies of neuroscience and computational biology research (Watabeuchida et al., 2012).
Various methods inferring biological network structure were developed in recent decades, such as the Boolean network model (Shmulevich et al., 2002), differential equation modeling (Kim et al., 2007), the likelihood-ratio test method (Caines and Chan, 1975), and Granger causality (Doerfler et al., 2013). These existing methods have been extensively applied to investigate causal dependency among protein–protein networks, genetic regulatory networks, and metabolite networks. However, most of these techniques are limited in analyzing BNNs due to simplification or linearization of system dynamics and additional requirements for detailed a priori knowledge on system order and structure. Due to the nonlinear threshold property of neuronal membrane potential and neuronal plasticity, the dynamics of BNNs are more complex and require exploring a nonlinear or probabilistic method.
Bayesian networks (BNs) are probabilistic graphical models naturally representing the static probability dependency among involved network variables. Currently, BNs have been intensively applied to multivariable biological network data analysis (Jansen et al., 2003; Yu et al., 2004). Dynamic Bayesian networks (DBNs) can model stochastic evolution of a set of random variables over time horizon (Perrin et al., 2003; Hanks and Madigan, 2005; Zou and Conzen, 2005), thus being more suitable for dynamical causality analysis of the multivariable datasets. DBNs modeling method is essentially a multivariable time-series analysis method analyzing all dynamical couplings in network causality analysis, simultaneously. DBNs possess significant advantages over competing representations, such as the Granger causality test (Doerfler et al., 2013), essentially based on a linear system analysis method, Kalman filters (Chen, 2003) handling only unimodal posterior distributions with linear models, and hidden Markov models (HMMs; Smyth et al., 1997), whose parameterization exponentially increases with increasing number of state variables. In the last decade, DBNs have been extensively applied to investigating causal dependency among genetic regulatory networks (Friedman et al., 2000; Jansen et al., 2003; Perrin et al., 2003; Zou and Conzen, 2005). Nevertheless, the use of DBNs to characterize neuronal networks at single neuron and ensemble levels has not been fully studied.
In this study, a dynamic Bayesian network structure search method (DBNSSM) based on a genetic algorithm (GA) is employed to infer and locate underlying dependent structures of pulsed neural networks (PNNs), typical artificial BNNs. In the process of network structure sorting, a minimum description length (MDL) score, including both the likelihood of the network structure and the complexity of the network connective structure, is evaluated for each candidate network structure. A global optimal structure is achieved using a GA, which is a globally searching method that mimics the process of DNA evolution (Whitley, 2014). Finally, the DBNSSM is applied to time-series data obtained from PNNs, which are based on “integrate and fire” neurons (Doerfler et al., 2013). As a result, functional connections in PNNs can be correctly inferred, which shows the effectiveness of the DBNSSM for BNN structure inference. The remaining sections of this study are organized as follows: the DBNSSM is presented in Section 2. Numerical studies and parameter robustness tests are conducted in Section 3. Conclusions and discussions are detailed in Section 4.
2. Methods
2.1. Dynamic Bayesian networks
BNs (Lam and Bacchus, 1994) are the special case of a diagrammatic representation of probability distributions, called probabilistic graphical models (Buntine, 1994; Bach and Jordan, 2004; Friedman, 2004). The BN represents probabilistic dependency among variables using a directed acyclic graph (DAG), comprised of nodes (also called vertices) connected by directed links (also called edges or arcs), and prohibiting any cyclic path.
BNs construct a common modeling framework for various existing modeling methods, such as a naive Bayesian model, implicit class model, HMM, and Kalman filters. Among many potential “inverse engineering” approaches applied to infer the functional connections of BNNs (ranging from simple unions and intersections of datasets to Kalman filters, artificial neural networks, Granger causality, HMM, and support-vector machines), BNs take several advantages (Friedman et al., 1997; Heckerman, 1999): (1) enabling the combination of highly dissimilar types of data (i.e., numerical and categorical), converting these data into a common probabilistic framework without unnecessary simplification; (2) accommodating missing data; and (3) naturally weighting each information source according to its reliability. However, BNs may encounter some fundamental limitations, like specific requirement of an acyclic structure and only static data processing when they are applied to multichannel biological data. To overcome the shortcomings, DBNs are introduced to represent and rationalize stochastic evolution of a set of dynamical random variables over time (Yu et al., 2004), and are more suitable for dynamical causality analysis of multivariable data.
A biological network containing n nodes represented as a discrete variable set
With vij (j = 1,2…, pi) representing the j-th unique instantiation of Pa(Xi), the conditional probability
A BN is defined as a DAG with a joint probability distribution over a variable set
A BN is used to describe the probability distribution of a biological network over a static dataset. However, a DBN extends this representation to modeling of dynamical processes, which can explain the dynamical causality among biological networks. In the formulation of a DBN, the joint probability distribution over the time stamps, t = 1,2…, T, is written as follows:
where the vector
2.2. MDL criteria
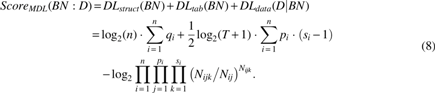
A variety of methods can evaluate the “loss functions” of BNs or DBNs with respect to a certain network dataset. Loss functions are constructed using a number of typical criteria: expectation–maximization (Friedman, 1998), Akaike information criterion (Akaike et al., 1998), Bayesian information (Schwarz, 1978), Bayesian Dirichlet equivalent (Heckerman et al., 1995), and MDL. MDL algorithm was originally proposed in several studies exploring universal coding (Rissanen, 1978). The method was subsequently applied to BNs' structure learning (Lam and Bacchus, 1994). According to MDL criterion, the optimal BN structure is the network with a minimum summation of the network parameter length and the network response data length, suggesting that a balance is required between network complexity and matching degree of the network structure with the response data. For this purpose, the score of MDL consists of the following two parts:
The network parameter length An n-node BN requires a data length of
However, in a CPT, each variable Xi has
The compressed length of the response data Suppose all data instances are independent and the dataset
where
Based on the MDL criterion, the optimal model structure is selected as the one with a MDL.
2.3. GA for network structure optimization
Many algorithms can be used to search the optimal structure of a BN with the lowest loss function, that is, the minimum MDL score. Currently, due to their computational simplicity, best first searching (Chickering, 2003) or greedy searching (Burnhan and Anderson, 2002) is commonly employed for BNs' structure optimization. These two algorithms are limited by which they often converge to local optimal solutions severely depending on the initial structure. Compared with the aforementioned two methods, simulated annealing (SA; Glover, 1990) might be an alternative choice for network structure optimization, since SA is a global optimization algorithm. However, SA algorithm is typically criticized for its relative long computational time to converge (Glover, 1990).
In this study, a global optimization algorithm is utilized for structure inference of DBNs in PNNs. A combination of DBNs and GA is reported in the references (Wang et al., 2006; Ross and Zuviria, 2007), focusing on the theoretical derivations of GAs for the DBN structure searching. A genetic algorithm is one type of parallel searching algorithm by mimicking the inheritance and mutation of genetic information from parents to children. Thus, the fitness of children can be rapidly improved globally by three repeated major steps: mutation, crossover, and selection (Schmitt, 2004). Details of the GA used in the DBNSSM are provided in Section S1 in Supplementary Material.
2.4. Pulsed neural networks
The DBNSSM with GA is applied to time-series data obtained from PNNs (Maass and Bishop, 1999) to test its effectiveness for network structure inference. PNNs are artificial, based on “integrate and fire” neurons, also called spiking neurons (Back and Hoffmeister, 1991). Spiking neuron models use recent insights from neurophysiology and temporal coding to pass information between neurons (Maass, 1997), which closely mimics realistic communications between neurons. Its fundamental mathematical description can be found in Section S2 in Supplementary Material, where Supplementary Figure S1 provides the kernel functions used in mathematical modeling and the firing process of a membrane voltage.
3. Results
3.1. Inferring functional connections among PNNs
To illustrate the ability to infer functional connections, the DBNSSM is used to 2, 3-node PNNs of the topologies (Fig. 1). Simply, we hypothesize that synaptic efficacy remains the same and is inversely proportional to the number of network nodes:

All potential topologies of 2, 3-node PNNs
For all tested 2, 3-node PNN topologies, the same set of parameter values were assigned to each neuron (Supplementary Fig. S1). Each network runs a simulation for 5 seconds and generates n-channel spike trains of n neurons (n = 2 or 3). The spike recordings are sampled by the protocol in Section S3 in Supplementary Material.
For an example of a 3-node PNN (Fig. 2a), spike trains generated through network simulations are shown in Figure 2b, and binary discretized time series are shown in Figure 2c. Based on these time-series data, the DBNSSM was applied to the 2, 3-node PNNs for inferring inside functional connections. For network structure sorting, GA is employed to search for the optimal structure based on the multivariable time series from network simulation. Major parameters for the GA are selected as described in Section S1 in Supplementary Material. As a result, functional connections can be successfully inferred for most of 2, 3-node network topologies. The inference results are summarized in the first two rows of Table 1.

Simulation of a 3-node PNN.
Functional Connection Inference Results for 2- to 50-Node Pulsed Neural Networks Using the Dynamic Bayesian Network Structure Search Method
For each network scale, 100 randomly connected networks are tested using the dynamic Bayesian network optimization method. The CIR, FPIR, and FNIR are calculated.
CIR, correct inference ratio; FNIR, false-negative inference ratio; FPIR, false-positive inference ratio.
The DBNSSM can also be applied to 4, 5, 10, 20, 30, 40, 50-node PNN structures. We randomly construct 100 network structures for each network scale and conduct similar simulations as to 2, 3-node networks. The connectivity ratio is set as 20%, which closely mimics the real situation of in vitro cultured biological neuronal networks. Self-connections of every node are prohibited; thus, the total number of connections and disconnections is
3.2. A comparison between GA and SA
To show the advantage of the GA over other network structure search methods, we also test the SA algorithm (Glover, 1990), a global optimization method, to optimize DBN structures of PNNs. The SA algorithm is set up as follows:
SA algorithm starts from the empty network structure
Ten turns of 100 simulations were conducted for the two different algorithms, and CIR, FPIR, and FNIR of the connection inference are separately tested according to different network scales. Statistical hypothesis tests show that the CIR by the GA is significantly greater than the one by the SA algorithm. Details of Behrens–Fisher tests are listed in Section S4 in Supplementary Material.
Results of hypothesis tests are summarized in Table 2. The null hypothesis for the mean value of the CIRs, H0 (i), was rejected for 3-, 4-, and 5-node networks. In addition, the null hypothesis for the mean value of FPIRs, H0 (ii), was rejected for 3-, 4-, and 5-node networks. This evidence shows that the mean value of the CIR based on the GA is significantly greater than the one based on the SA algorithm for 3-, 4-, and 5-node simulations.
A Comparison Between the Genetic Algorithm and Simulated Annealing Algorithm for Functional Connection Inferences of Pulsed Neural Networks
For each network scale, 10 turns of 100 simulations were conducted for each algorithm. The CIR, FPIR, and FNIR of the connection inference using different searching algorithms are separately tested according to different network scales. Double sample t-tests (for left tail) are performed to show that the mean value of the CIR of the GA is significantly greater than the mean values of the CIR of the SA algorithm. A significance level at
CIR, correct inference ratio; GA, genetic algorithm; SA, simulated annealing.
4. Discussion and Conclusions
In this study, the DBNSSM is developed to investigate the synthetic BNN structure. Aided by the MDL and GA, the DBNSSM rapidly identifies and locates functional connections without a priori knowledge of the synthetic BNN structures. Particularly, the method is efficient for nonlinear neuronal dynamics, which often reflects the threshold property of neuronal membrane potential and neuronal plasticity. Although DBNs have been extensively applied to investigate causal dependency among genetic regulatory networks (Friedman et al., 2000; Jansen et al., 2003; Perrin et al., 2003; Zou and Conzen, 2005), these analyses have not been fully explored and widely reported in application to BNNs due to the threshold property of neuronal membrane potential and neuronal plasticity.
In addition, the proposed method only requires the measurement of dynamic expression profiles of network nodes. With the advances in high-throughput measurement methods, such as multiple single neuron recordings, voltage-sensitive dyes, or multielectrode array technology, this modeling technique may soon become applicable in describing large-scale in vitro or in vivo BNNs. The DBNSSM might greatly improve on understanding the relationship between network dynamics and network topologies.
5. Data Reports
The data used in this study originated from the mathematical model of PNNs for testing the effectiveness of the proposed network structure inference method. The synthetic model and dataset are available to Journal of Computational Biology editors and reviewers during peer review, and can also be provided to any readers if required at the time of publication.
6. Studies Involving Human Subjects, Animal Research, and Clinical Trail
None.
Footnotes
Acknowledgments
This work was financially supported by grants from the National Natural Science Foundation of China (Grant Nos. 61364018, 81503167, and 61863029), the Inner Mongolia Autonomous Region Natural Science Foundation (Grant No. 2016JQ07), and the Program for Young Talents of Science and Technology in Universities of Inner Mongolia Autonomous Region (Grant No. NJYT-15-A05).
Authors' Contributions
C.D. and C.Y.D. conceived and designed the algorithms. X.Y.C. performed the simulations and acquired the data. C.D., C.Y.D., and X.Y.C. analyzed the data. C.D. and C.Y.D. prepared the article.
Author Disclosure Statement
The authors declare that there are no competing financial interests.
References
Supplementary Material
Please find the following supplemental material available below.
For Open Access articles published under a Creative Commons License, all supplemental material carries the same license as the article it is associated with.
For non-Open Access articles published, all supplemental material carries a non-exclusive license, and permission requests for re-use of supplemental material or any part of supplemental material shall be sent directly to the copyright owner as specified in the copyright notice associated with the article.