
Abstract
In the past 20 years, zebrafish has gradually become an important animal model for studying the function of human genes. At the same time, identification of zebrafish reference genome sequences and >10,000 protein-coding genes indicates that they are at least 75% homologous to human genes, further validating its utility as a research model for growth and developments (GDs). However, the molecular mechanism of zebrafish GDs has almost no molecular interactions, so a protein–protein interaction (PPI) network is highly desirable. The project extracted 58 genes on the fifth chromosome of the model organism, and studied and modeled its GDs mechanisms, which encompassed 296 interactions between the 58 proteins involved in GDs. This includes not only accurate predictions of PPI but also those molecular interactions collected from the literature and experimentally derived. These molecules then interact, modularize, look for central genes, analyze, and predict their GDs processes, and hope to help scholars study the process of GDs, providing hypotheses and help.
1. Introduction
The zebrafish was first identified as a genetically managed organism in the 1980s. The development of zebrafish is divided into six stages: cleavage stage, blastocyst stage, gastrula stage, division stage, forming stage, and incubation period (Fu and Wang, 2013). During the first 24 hours, zebrafish development begins with activation of the egg and then continues to occur in subsequent fertilized eggs, cleavage, blastocysts, gastrointestinal and schizophrenia. Therefore, they are involved in the main stages of pattern formation: cell proliferation, cell differentiation, axial determination, primary genital production, and the appearance of primary organ systems to establish a basic vertebrate body plan.
Zebrafish attracts the attention of many researchers because of their small size, low cost of breeding, large-scale breeding, and many advantages. After more than 30 years of research application and system development, there are ∼20 zebrafish strains. The zebrafish gene has relevant data in the National Center of Biotechnology Information (NCBI) database for query and download, which is convenient for research. The zebrafish cell marker technology, tissue transplantation technology, mutation technology, haplotype technology, transgenic technology, gene activity inhibition technology, etc. have matured, and there are thousands of zebrafish embryo mutants, which are the molecular mechanisms for studying embryonic development (Webb and Miller, 2000). As for these good resources, some can also be used as a model of human disease. Zebrafish has become one of the most important vertebrate developmental biology models, and its use in other disciplines has shown great potential. Since the zebrafish gene has 87% similarity to the human gene, which means that the results obtained by doing drug experiments on it are also applicable to the human body in most cases, it is valued by biologists.
Zebrafish can be applied to cell lineage analysis, mutation identification, saturation mutagenesis analysis, gene transfer research, and gene linkage map construction in developmental biology, and its in vitro fertilization, embryo body transparency, and rapid cell division make it more comparable with large mice (Kanehisa et al., 2004). They have a unique advantage. The zebrafish is transparent and observable. The early embryos of zebrafish are transparent and grow in vitro. The development of embryos at various stages can be well observed through a microscope. Today, scientists have also developed zebrafish that are transparent throughout adulthood (Yang et al., 2014). Cannono said, “This is very exciting, because under the microscope you can observe the development of their organs and systems, you can see their blood flowing, their heart is beating.”
Systematic application of gene screening results in a large number of phenotypic traits of mutation. These mutations, when driven to homozygotes, can produce defects in the pathology of various organ systems similar to human diseases. These studies have made important contributions to our understanding of the development of vertebrates. Using zebrafish, one can study the basic problems of life sciences and reveal the molecular mechanisms of embryonic and tissue development (Isogai et al., 2001).
2. Methods
2.1. Data source
Data were obtained from the NCBI Gene Expression Omnibus (www.ncbi.nlm.nih.gov/geo). Due to the high homology between human and zebrafish, from the 47,036 zebrafish genes 58 representative zebrafish growth and developments (GDs) related genes of the fifth chromosome of zebrafish were selected.
2.2. Identification of GDs
After obtaining raw data, the data were normalized using python software, and then a one-sample t-test was performed to identify the GDs (Van Houcke et al., 2015). The confidence interval is chosen to be 99% as the cutoff criterion (Table 1).
Results of Confidence Interval on Growth and Development from Gene Expression Omnibus Databases
2.3. The functional enrichment analysis of the GDs
Kyoto Gene and Genomic Encyclopedia (KEGG) is a database for genome deciphering. It is a well-recognized comprehensive database that systematically analyzes gene function and genomic information databases, which helps researchers conduct research on genes and expressions as a whole, including various biochemical pathways. In this study, the KEGG database was used to study the enrichment analysis of GDs to find biochemical pathways that may affect the GDs of zebrafish (Yang et al., 2014). Database for Annotation, Visualization and Integrated Discovery (DAVID) was used to perform KEGG pathway enrichment analysis with p value <0.025 and gene count >2.
2.4. Protein–protein interaction network construction
Since proteins rarely function independently, it is important to understand the interaction of these proteins by studying the larger functional groups of proteins (Kanehisa et al., 2010). In this study, the STRING online tool was used to analyze the protein–protein interactions (PPIs) of GDs with a composite score >0.15 cutoff criteria. We abandon the relationship of node degrees ≤5, and then use the Cytoscape software to build the network. From previous studies, most of the PPI networks obtained were subject to scale-free attribution. Therefore, the node degree of the network is analyzed and used to obtain the central protein in the PPI network, and the connectivity degree ≥20 is selected as the central node, and it is predicted that it may play an important role in the aging research progress of zebrafish (Kimmel et al., 1995).
2.5. Network module analysis of the GDs
The nodes and edges of the PPI network are very complex, and we need to use the Cluster ONE Cytoscape plugin for enrichment analysis. Before running Cluster ONE to disclose the rich functional modules of the PPI network, we set the parameter minimum size >5 and the minimum density <0.05. We also performed gene ontology (GO) functional enrichment analysis on modular genes to analyze gene function at the molecular level (Panula et al., 2006). In addition, we also used DAVID to perform the KEGG pathway enrichment analysis of the best enrichment module, and also performed K-means clustering.
2.6. Training support vector machine model
To predict functional PPI, we trained a support vector machine (SVM) model based on the integration of four different types of data sets as described in Section 2 (Venkat et al., 2017). The SVM model was evaluated using 10-fold cross-validation, with 10 cross-validations repeated 100 times, and the same number of negative samples as the positive samples was randomly selected to train the SVM model each time (Nakayama et al., 2006). To show the performance of the training model against the baseline data set, the average of 10 cross-validations was used as the final output of the model. It can be seen that our well-trained models are highly accurate, indicating the reliability of our predicted PPI.
2.7. Results and discussion
2.7.1. Normalized GDs
For the data after preprocessing, according to the information obtained by the known database, normalization of python is performed, and the minimum–maximum normalization process, also called the deviation standardization, is a linear transformation of the original data, so that the result values are mapped to between [0, 1]. The conversion function is as follows:
In this project, this type was used to first quantify the protein–protein correlation of zebrafish GDs, and then do a single-sample t-test. The one-sample test is also called the t-test of the comparison of the sample mean and the population mean (Kanehisa et al., 2008). N samples were taken in the population for normal distribution, and it is judged whether the population mean μ is the same as the known population mean μ(). We screened out the highly relevant protein genes we wanted. The results are as follows.
2.7.2. KEGG pathways analysis
To further understand the function of GDs, DAVID was applied to identify the KEGG pathway of significant dysregulation (Cherkassky and Ma, 2004). The pathways obtained from p values <0.05 and gene counts >2 from all aging-related genes are given in Table 2, respectively. According to the enrichment results, focal adhesion, inositol phosphate metabolism, extracellular matrix (ECM)–receptor interaction, and mammalian target of rapamycin (mTOR) signaling pathway were significantly enriched. There are also some pathways that we might have predicted before, such as autophagy, and we have reason to believe that these protein interactions can lead to or predict factors in the GDs of zebrafish that we have not considered before (Srihari and Leong, 2012).
The Kyoto Gene and Genomic Encyclopedia Pathways of Growth and Development
ECM, extracellular matrix; FoxO, Forkhead box O; MAPK, mitogen-activated protein kinase; mTOR, mammalian target of rapamycin; TGF, transforming growth factor.
2.7.3. PPI network construction
The STRING tool is used to obtain the PPI relationship of GDs. When the comprehensive score was >0.4, a total of 324 PPI relationships were obtained. After filtering out the nodes with degrees ≤5, we finally constructed a network with 48 nodes and 296 edges (Fig. 1). We calculated the connectivity of each node of the PPI network and output as shown in Figure 2.

A network constructed with 48 nodes and 296 edges on STRING.
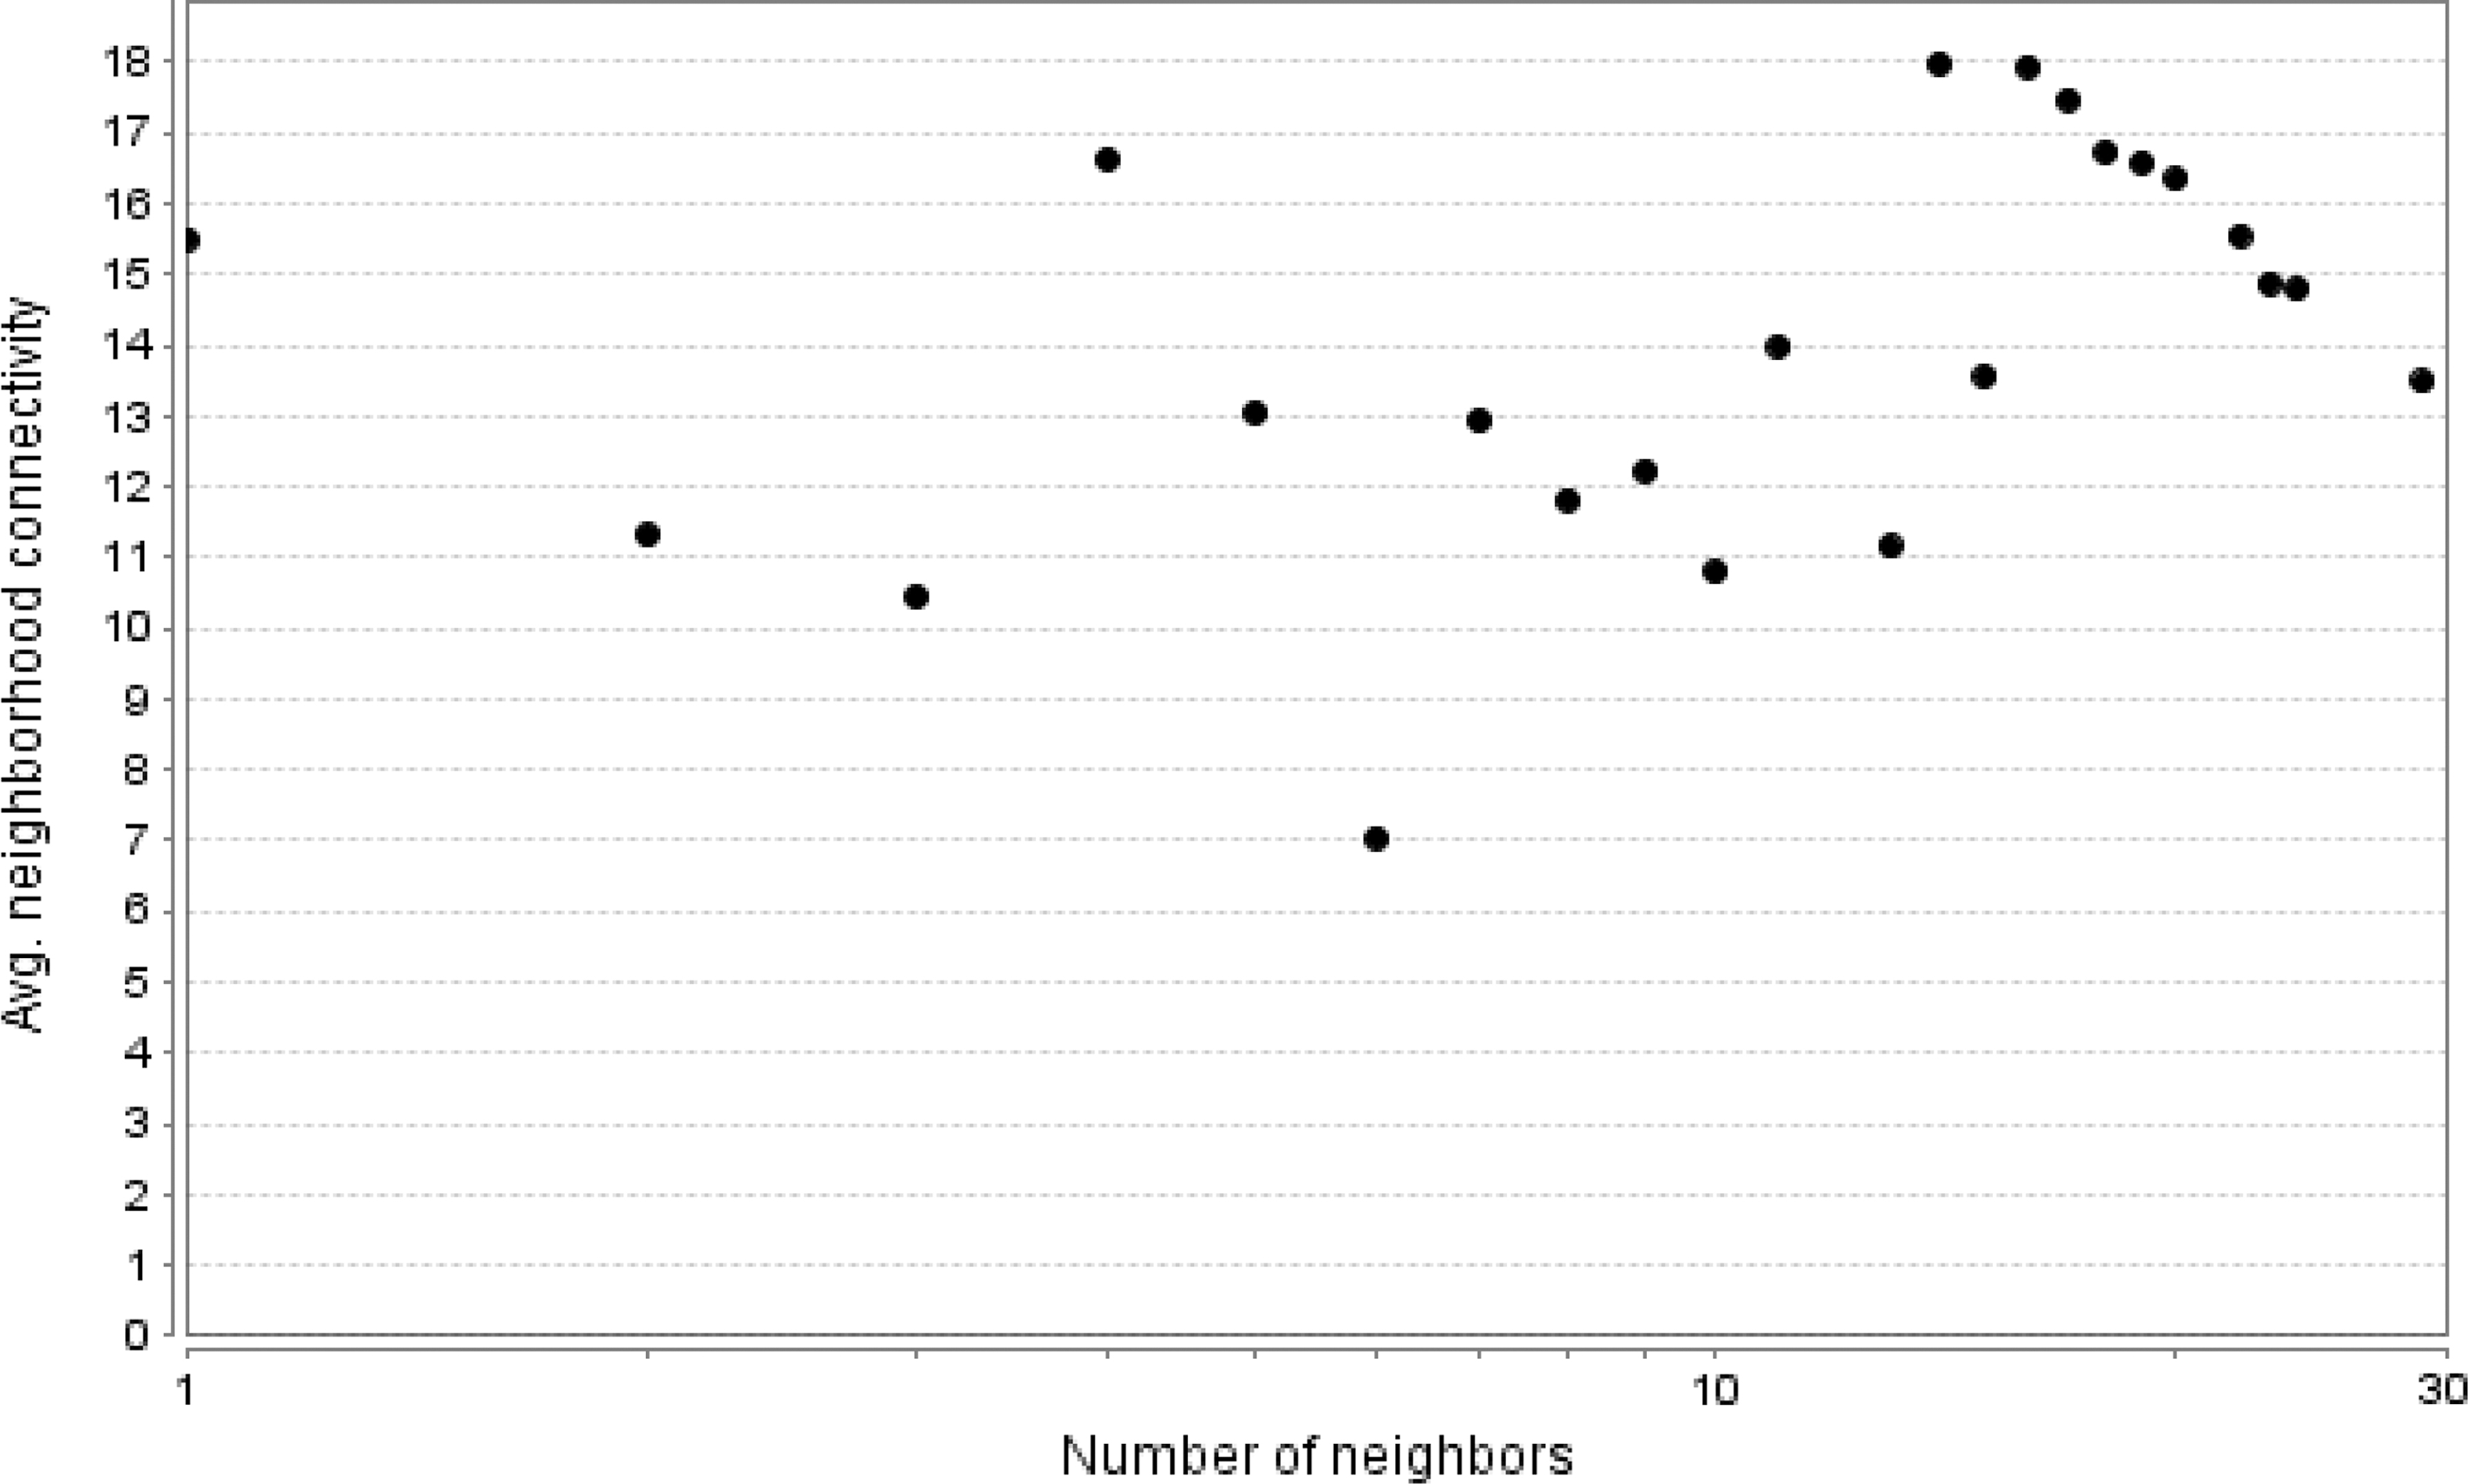
The connectivity of each node of the protein–protein interaction network.
Tumor protein p53 (Tp53), phosphatase and tensin homolog B (Ptenb), cyclin-dependent kinase 2 (Cdk2), tumor protein p53 binding protein 1(Tp53bp1), serine/threonine kinase (Atr), checkpoint kinase 1 (Chek1). A node with a high connectivity ≥20 is considered a central gene (Sui et al., 1999).
2.7.4. Module analysis
PPI network enrichment is one of the main methods for studying and identifying functional proteins. In this study, eight important modules (p < 1 × 10 − 3) were enriched by the Cluster ONE plug-in with a minimum parameter ≥5 and a minimum density of <0.05. The most important enrichment modules A (p = 0.1 × 10 − 2), B (p = 0.9083 × 10 − 4), and C (p = 0.12 × 10 − 2) are shown in Figure 3. According to Figure 3, it is obvious that module A may be the best module because it has 38 nodes and 210 edges, whereas module B has 10 nodes and 44 edges, and module C has 7 nodes and 21 edges (Alexandrov et al., 2018).

A network constructed with 38 nodes on Cytoscape.
o further investigate functional changes during tumor progression, we performed a GO function annotation in module A (Gilks, 2004). Module A's GO enrichment score is 11.28. Therefore, module A may be the most suitable module for further functional analysis. There are 38 genes in module A (Fig. 3), which coincide with the central genes we hypothesized previously. The hypothetical central genes are also labeled in Figure 1. Module A may, therefore, be the most suitable module for further functional analysis. Module A has 38 genes that are enriched in biological processes such as cell aging, cell cycle, and regulation of metabolic processes, and then the results of the analysis by KEGG enrichment are given in Table 3 (Jeong et al., 2001).
The Results of the Kyoto Gene and Genomic Encyclopedia Enrichment Analysis in Module A
2.7.5. Prediction of PPI on SVM
According to the recent article on the interaction network of corn proteins and the concepts and experimental operations proposed by a scholar, we found that SVM can be used to predict PPI, and the correct rate can reach an ideal credibility. Therefore, we carry out a series of classification and sorting of data (Worsley et al., 1997). Our data are not only from NCBI but also from BioGrid, DIP, IntAct, etc., while some of the predicted PPIs are derived from coexpression, and some are from experimental determination. Some are determined by the database, and some are automatically detected. Based on these data, some processing is performed on the data. The predicted protein interactions and the proportions after training the data are as given in Table 4.
The Number of Molecular Interactions Deposited in Growth and Development and the Number of Proteins Involved
PPIs, protein–protein interactions.
3. Results
This project introduces the GDs mechanism of the fifth chromosome NC_007116.7 of zebrafish, which covers 296 interactions between 58 proteins related to aging. This includes not only accurate predictions of PPI but also those molecular interactions obtained from literature collection and experiments (Bowen et al., 2009). Then we networked to find the central genes (Tp53, ptenb, cdk2, tp53bp1, atr, and chek1), which coincides with the important genes derived from the subsequent module enrichment. In the process of module A analysis of zebrafish aging, functional enrichment such as biological regulation, biological process, and molecular metabolic process is obtained, which indicates that it plays an important role in the GDs of zebrafish. At the same time, the SVM is used to train the obtained data to obtain the accuracy of the experiment, which further proves our prediction (Dooley and Zon, 2000).
4. Discussion
Zebrafish has become a popular creature in the study of gene function in vertebrates. Almost transparent embryos of this species and the ability to accelerate gene research by gene knockdown or overexpression have led to the widespread use of zebrafish in detailed studies of vertebrate gene function and the increasing study of human genetic diseases (Irizarry et al., 2003). However, to effectively mimic human genetic diseases, it is important to understand the extent to which zebrafish genes and gene structures are related to orthologous human genes. In this study, we selected 58 representatives from the NCBI (https://www.ncbi.nlm.nih.gov) 47,036 zebrafish genes based on the homology of zebrafish to mice and humans of aging related genes; sexual zebrafish aging related genes. Most of these genes are rich in biological processes and biological regulation, and some genes are rich in cellular metabolic processes.
In addition, we also used the STRING tool to obtain the PPI relationship of the DEG and obtained a network with 87 nodes and 767 edges (Ritchie et al., 2007). In the network, Tp53, ptenb, cdk2, tp53bp1, atr, and chek1 are selected as hub nodes because their connectivity is ≥20. Finally, we performed a module analysis of the PPI network. Module A containing 38 genes has been shown to be closely related to zebrafish GDs. Through GO analysis, the genes in module A are enriched in biological regulation, biological processes, molecular metabolic processes, etc., indicating that telomere wear and cell aging play an important role in the GDs of zebrafish. At the same time, to predict the accuracy, we used SVM to train the predicted PPI, and obtained higher accuracy, which further verified our hypothesis.
5. Conclusion
As a result of the study, we confirmed the GDs mechanism of zebrafish and mTOR signaling pathway, ECM–receptor interaction, inositol phosphate metabolism, and focal adhesion molecular metabolism (Huang et al., 2007). In addition, we also pointed out that genes such as Tp53, ptenb, cdk2, tp53bp1, atr, and chek1 may play an important role in GDs, and they are predicted source genes.
Footnotes
Acknowledgments
The research was partly supported by the program for Professor of Special Appointment (Eastern Scholar, 15HJPY-MS02) at Shanghai Institutions of Higher Learning and National Natural Science Foundation of China (Grant No. 61775139).
Author Disclosure Statement
The authors declare there are no competing financial interests.