
Abstract
This study aimed to assess mRNA and lncRNA expression differences between lung squamous cell carcinoma (LUSC) and lung adenocarcinoma (LUAD). Cancer tissues were obtained from three LUSC and three LUAD patients, followed by RNA-seq. Differentially expressed mRNAs (DE-mRNAs) and lncRNAs (DE-lncRNAs) were identified between LUSC and LUAD, after which functional enrichment analysis and protein–protein interaction (PPI) network construction was performed on DEGs. Coexpression analysis of lncRNA-gene and prediction of DEG-related miRNAs as well as function enrichment analysis, and construction of competing endogenous RNAs (ceRNA) regulatory network were then conducted. Moreover, survival analysis on differentially expressed RNAs was performed based on data downloaded from The Cancer Genome Atlas (TCGA) database. In this study, 518 DEGs and 117 DE-lncRNAs were identified between LUSC and LUAD. The DEGs were mainly associated with cell adhesion, PI3K-Akt signaling pathway, and focal adhesion. PPI network analysis indicated several genes with highest connectivity, such as CCND1. DE-lncRNAs that coexpressed with DEGs were also associated with tight junction and DE-lncRNAs that had more corepressed relationships with DEGs included GSEC, NKX2-1-AS1, LINC01415, and LINC00839. Moreover, the genes and lncRNAs with higher connectivity in the ceRNA network included NEAT1, SLC5A3, LINC00839, ETV1, CMTM4, and SNX30. Several genes were significantly related to the survival of patients with LUSC and LUAD, including ETV1, RTKN2, SNX30, PAK2, and CCND1. Genes and lncRNAs associated with cell junction have specific patterns in two major histological subtypes of NSCLC. GSEC, NKX2-1-AS1, NEAT1, CCND1, and ETV1 may be potential novel biomarkers for personalized treatment strategies of NSCLC.
1. Introduction
Lung cancer is counted as a leading cause of cancer mortality worldwide, with an estimated 224,000 new cases and >158,000 estimated deaths in the United States in 2016 (Garrison, 2016). Lung cancers are generally classified as two broad categories: nonsmall cell lung cancer (NSCLC) and small-cell lung carcinoma (SCLC); NSCLC is the most common histological type accounting for nearly 80%–90% of all cases of lung cancer (Esposito Abate et al., 2018). The most abundant subtypes of NSCLC are lung squamous cell carcinoma (LUSC) and lung adenocarcinoma (LUAD), which is thought to be mainly derived from epithelial cells that line the larger airways and epithelial cells that line the peripheral small airways, respectively (Garber et al., 2001).
At present, the treatment strategy of NSCLC has changed from the “one size fits all” governed decisions to the individualized and precise multidisciplinary treatment guided by histological types and gene mutations (Perez-Moreno et al., 2012; Munfus-McCray et al., 2013). Current advances in the targeted therapies of lung cancer demand a precise histological subtype classification (Bishop et al., 2010). For example, anaplastic lymphoma kinase (ALK) translocations and activating epidermal growth factor receptor (EGFR) mutations are more commonly prevalent in patients with LUAD, which are important determinators for the response to ALK inhibitors and EGFR tyrosine kinase inhibitors in those patients with LUAD (Ma et al., 2017; Kheng et al., 2018; Tsai et al., 2018). In contrast, FGFR1 amplification is found in ∼20% of patients with LUSC but rarely in LUAD (Heist et al., 2012). Moreover, treatment with adjuvant bevacizumab results in an increased risk of hemoptysis in patients with advanced LUSC, whereas bevacizumab improves survival in LUAD (Hellmann et al., 2013). Therefore, a correct histological diagnosis and advanced understanding of the molecular mechanisms underlying subtypes of NSCLC is becoming increasingly important for diagnostic tests and more effective treatment options.
Transcriptome sequencing, or RNA-Seq, is a state-of-the-art technology that offers an unbiased and sensitive approach for annotating coding and noncoding RNA transcripts (White et al., 2014). Long noncoding RNAs (lncRNAs) is an emerging area of focus of lung cancer biology, which will lead to a new field of molecular diagnosis and markers of cancer prognosis as well as novel therapeutic targets (Inamura, 2017). This study was to assess mRNA and lncRNA expression differences between LUAD and LUSC. With this purpose, cancer tissues were obtained from three LUSC and three LUAD patients, followed by RNA-seq. Differentially expressed genes (DEGs) and lncRNAs (DE-lncRNAs) were identified between LUSC and LUAD, after which a comprehensive bioinformatics analysis was carried out. This study may identify novel gene targets and lncRNA targets that hold great promises to develop novel therapies in NSCLC.
2. Materials and Methods
2.1. Patients and tissue samples
The lung cancer tissues were obtained from three LUSC and three LUAD patients who underwent surgery for primary lung cancer in the department of thoracic surgery, Shaanxi Provincial People's Hospital, Xi'an, Shaanxi Province, China, between October 2015 and March 2017. The pathological diagnosis complied with the eighth edition of the Union for International Cancer Control (UICC)/American Joint Committee on Cancer (AJCC) tumor, node, metastasis (TNM) system. Surgery was carried out strictly according to the National Comprehensive Cancer Network (NCCN) clinical practice guidelines on NSCLC.
After surgical removal, the cancerous tissue was cut into 0.5 × 0.8 cm tissue pieces, and washed repeatedly with sterile saline until the tissue became white and the necrotic tissue was cut off. After snap-freezing in liquid nitrogen, the samples were stored at −80°C until RNA isolation. All patients in the study signed the informed consent, and the specimen collection and research process were approved and approved by the ethics committee of Shaanxi Provincial People's Hospital.
2.2. RNA isolation, library construction, and sequencing
Total RNA was extracted with Trizol reagent (Invitrogen, Carlsbad, CA) according to the manufacturer's instructions. After RNA extraction, purification, and library construction, the library was subjected to paired-end sequencing based on the Illumina HiSeq sequencing platform using next-generation sequencing by Shanghai Personalbio Biotechnology (Shanghai, China).
2.3. Data preprocessing and identification of DEGs and DE-lncRNAs
ENSEMBL_id (ensembl_gene_id) was mapped to gene symbol or lncRNA using the annotation file provided by HGNC1 (www.genenames.org). The ENSEMBL_id that does not match gene symbol or lncRNAs was removed. For different ENSEMBL_id mapping to the same gene or the same lncRNAs, we took the mean of different ENSEMBL_id as the final expression value of this gene or lncRNAs, and performed log2 conversion.
The R (3.4.3) software package limma (version 3.34.9) (Ritchie et al., 2015) (http://bioconductor.org/packages/release/bioc/html/limma.html) was used for screening the DEGs and DE-lncRNAs in LUSC samples versus LUAD samples. All genes were subjected to t-test to obtain the corresponding p-value. Finally, the genes/lncRNAs with |log2-fold change (FC)|>1 and p < 0.05 were selected as a significant DEG or DE-lncRNA.
2.4. Gene ontology and pathway enrichment analysis of DEGs
The up- and downregulated DEGs were subjected to Gene Ontology (GO) (Ashburner et al., 2000) functional and Kyoto Encyclopedia of Genes and Genomes (KEGG) pathway (Kanehisa and Goto, 2000) enrichment analysis using the DAVID online analysis tool (Huang et al., 2008) (version 6.8, https://david.ncifcrf.gov/), respectively. The significance level (p-value) of each obtained GO term and pathway that the DEGs involved in was calculated, thereby screening out the significant functions and pathways. The criteria for screening of significant GO terms and KEGG pathways were set as p-value <0.05 and gene count ≥2.
2.5. Protein–protein interactions network construction based on DEGs
Protein network visualization plays an important role in efficiently and intuitively analyzing protein network characteristics and studying the behavior of the cell machinery (Agapito et al., 2013). In this study, the STRING (version: 10.5) database (https://string-db.org) (Szklarczyk et al., 2016) was used to predict whether there is an interaction between the proteins encoded by the DEGs. The input gene set was all the DEGs and the species was set as Homo sapiens. The parameter protein–protein interactions (PPI) score was set to 0.4 (indicating medium confidence), and all the interacted nodes were required to be DEGs. The PPI network was built using Cytoscape software (version: 3.6.1, www.cytoscape.org/) (Shannon et al., 2003).
2.6. Coexpression analysis and functional prediction of lncRNA
The Pearson correlation coefficient of each DEG and DE-lncRNA was calculated, and the correlation test was conducted to screen coexpressed pair of DEG-DE-lncRNAs with the threshold of |r| > 0.9 and p-value <0.05.We analyzed the related functions of lncRNAs through the relationship pairs in lncRNA-mRNA regulatory network. The R-package clusterProfiler (Yu et al., 2012) (version 3.2.11, www.bioconductor.org/packages/release/bioc/html/clusterProfiler.html) was used to analyze the pathways in which the target genes of these lncRNAs were involved. These enriched pathways were considered to be related functions of the DE-lncRNAs. The threshold for the enrichment analysis was set at Benjamini and Hochberg (BH)-corrected adj. p-value (Benjamini and Hochberg, 2000) <0.05 and gene count ≥2.
2.7. DEG-related miRNA prediction and enrichment analysis of miRNAs
In this study, the DEGs were input into the “Gene-miRNA Targets” module n miRWalk 2.0 database (http://zmf.umm.uni-heidelberg.de/apps/zmf/mirwalk2/miRretsys-self.html) that hosts miRNA-target interactions information for screening miRNAs regulating the DEGs. The species was set as Homo sapiens. The prediction was performed based on the information from eight databases, including Microt4, miRWalk, miRDB, miRanda, miRMap, RNA22, PITA, and Targetscan. The database search relationship was set to “OR” and a list of predicted gene-miRNA regulatory relationships that occurred in at least seven databases were selected. Then, miRNA regulatory network was built using Cytoscape (Shannon et al., 2003) based on the screened regulatory relationship.
The R package clusterProfiler (Yu et al., 2012) was used to perform the functional enrichment of the KEGG pathway enriched by the DEGs from the DEG-miRNA pairs. The significance level (p-value) of each pathway was calculated. The BH method was used to correct the p-value. The significant pathways were identified with the criteria of corrected p-value <0.05 and gene count ≥2.
2.8. Competing endogenous RNAs regulatory network analysis
The DIANA-LncBase v.2 database (Paraskevopoulou et al., 2015) (http://carolina.imis.athena-innovation.gr/diana_tools/web/index.php?r=lncbasev2%2Findex) was applied to predict lncRNAs that were related with the miRNAs in the miRNA regulatory network. The lncRNA-miRNA with a threshold score >0.99 was taken as the background of lncRNA-miRNA relationship to screen DE-lncRNA-miRNA regulation relationship. Then, DE-lncRNA-miRNA relationship with miRNA-DEG relationship was integrated and the screened DEG-DE-lncRNAs coexpression relationship (only positive coexpression relationship) was also integrated for the construction of the competing endogenous RNAs (ceRNA) network, that is, lncRNA-miRNA-mRNA network. In addition, the clusterProfiler (Kheng et al., 2018) was used to conduct pathway enrichment analysis of the miRNAs, DE-lncRNAs, and DEGs in the ceRNA network, respectively; the threshold was BH-corrected adj. p-value <0.05.
2.9. Survival analysis on differentially expressed RNAs
RNA-seq data (Level 3) and corresponding clinical data for LUAD and LUSC were downloaded from TCGA database (http://firebrowse.org/) (Deng et al., 2016). A total of 517 LUAD samples and 501 LUSC samples were downloaded. The clinical information related to prognosis in the TCGA database, including overall survival (OS) and survival status, was collected. We divided the DEGs and DE-lncRNAs in the ceRNA network into high and low expression groups, respectively, according to the mean expression of the tumor group, and performed log-rank test, setting p < 0.05 as the significance level. The relationship between each significant differentially expressed RNAs and patient prognosis was analyzed and a Kaplan–Meier (K–M) survival curve was plotted.
3. Results
3.1. Data preprocessing and screening of DEGs and DE-lncRNAs
After data preprocessing, a total of 19,033 mRNAs and 3722 lncRNAs were remained (Supplementary Fig. S1). Through the threshold of |log2FC| > 1 and p < 0.05, a total of 518 DEGs were identified, of which 152 were significantly upregulated and 366 were significantly downregulated; 117 DE-lncRNAs were found between LUSC and LUAD, including 47 upregulated lncRNAs and 70 downregulated lncRNAs. The heat maps of DEGs and DE-lncRNAs are shown in Figure 1A and B, which showed that the LUSC samples (SC4, SC6, and SC18) were well distinguished from the LUAD samples (AD9, AD13, and AD14).
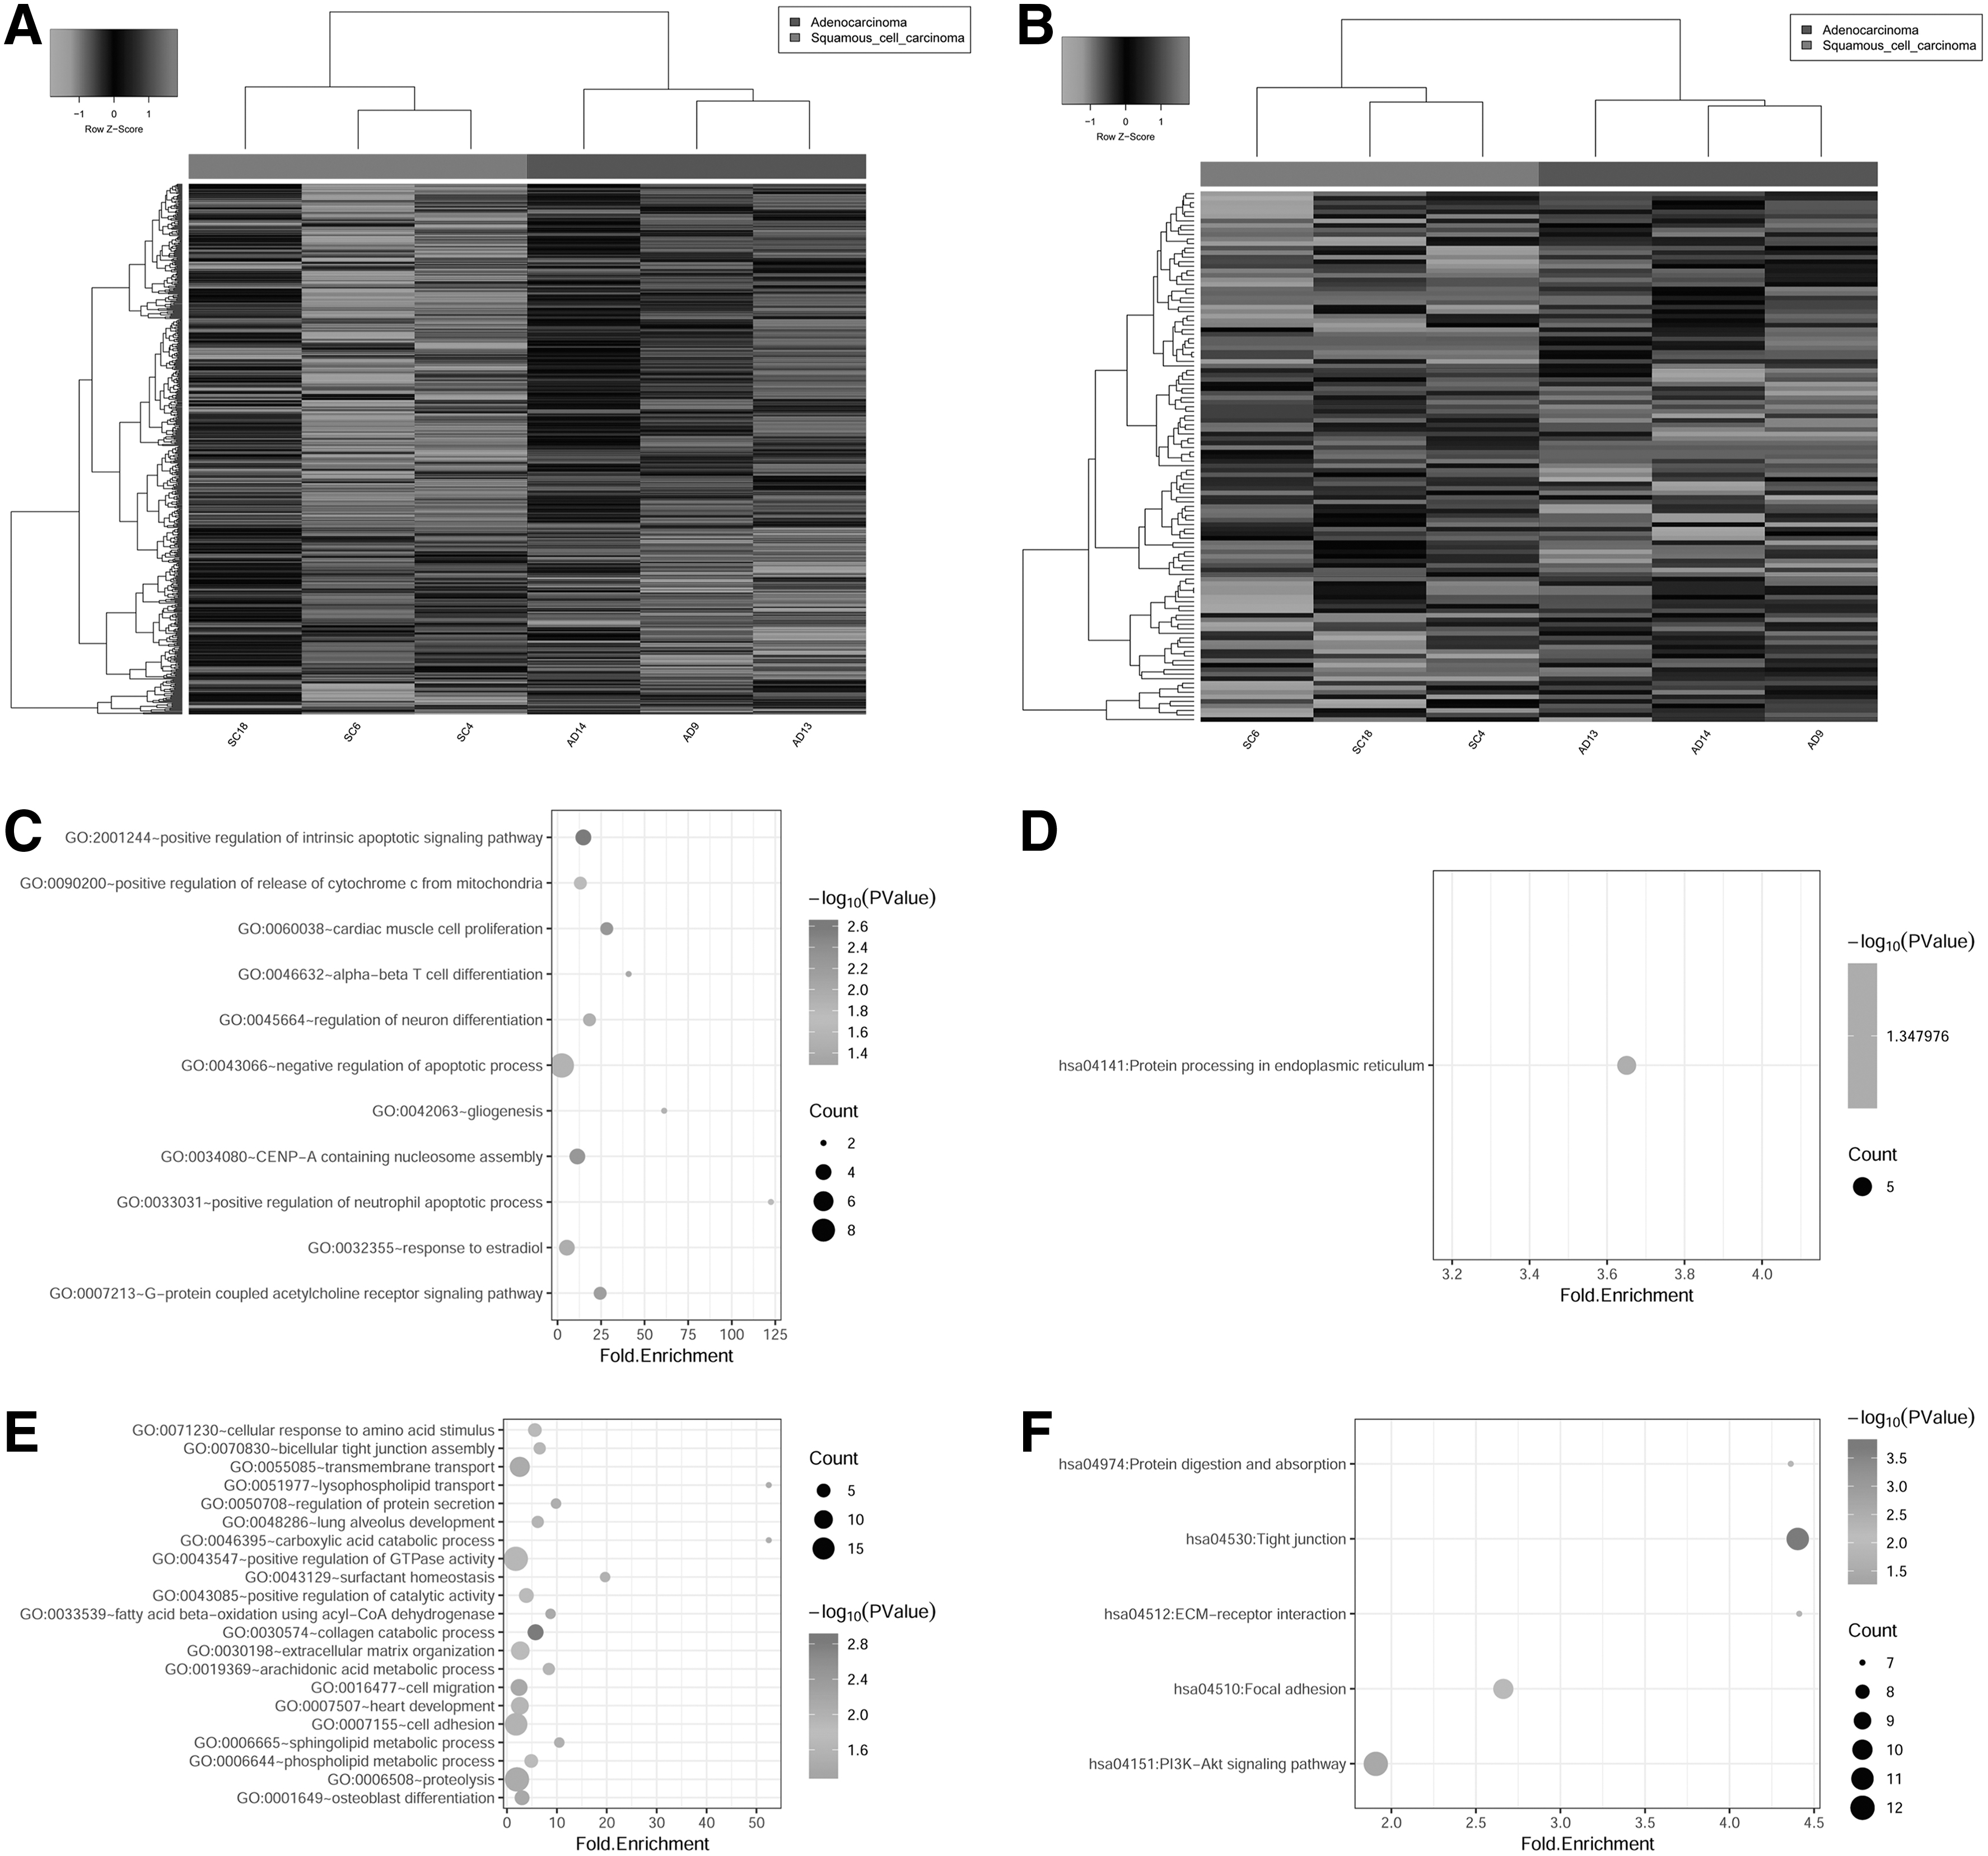
Heat maps of DEGs and lncRNAs (DE-lncRNAs) and functional enrichment analysis.
3.2. Functional enrichment analysis of DEGs
Up- and downregulated genes were subjected to GO functional enrichment and KEGG enrichment analysis, respectively. As shown in Figure 1C–F, the up- and downregulated genes were enriched in different GO terms and pathways. The upregulated genes were mainly enriched in 11 GO terms and one pathway, including negative regulation of apoptotic process, response to estradiol, and protein processing in endoplasmic reticulum; the downregulated genes were mainly involved in 21 GO pathways and 5 pathways, including positive regulation of GTPase activity, cell adhesion, PI3K-Akt signaling pathway, and focal adhesion.
3.3. PPI network of DEGs
PPI network analysis of DEGs included 305 nodes and 575 interaction relationships (Fig. 2). The top 10 nodes with higher degrees, which can be regarded as a key node of the network, were N-acetylneuraminate pyruvate lyase (NPL, upregulated, degree = 18), 2′-5′-oligoadenylate synthetase 2 (OAS2, upregulated, degree = 17), insulin receptor (INSR, downregulated, degree = 17), actin, alpha 2, smooth muscle, aorta (ACTA2, downregulated, degree = 17), cyclin D1 (CCND1, downregulated, degree = 16), E74 like ETS transcription factor 3 (ELF3, downregulated, degree = 15), cystatin B (CSTB, upregulated, degree = 15), GEN1, Holliday junction 5′ flap endonuclease (GEN1, upregulated, degree = 14), HOP homeobox (HOPX, downregulated, degree = 14), and H2A histone family member X (H2AFX, upregulated, degree = 13).
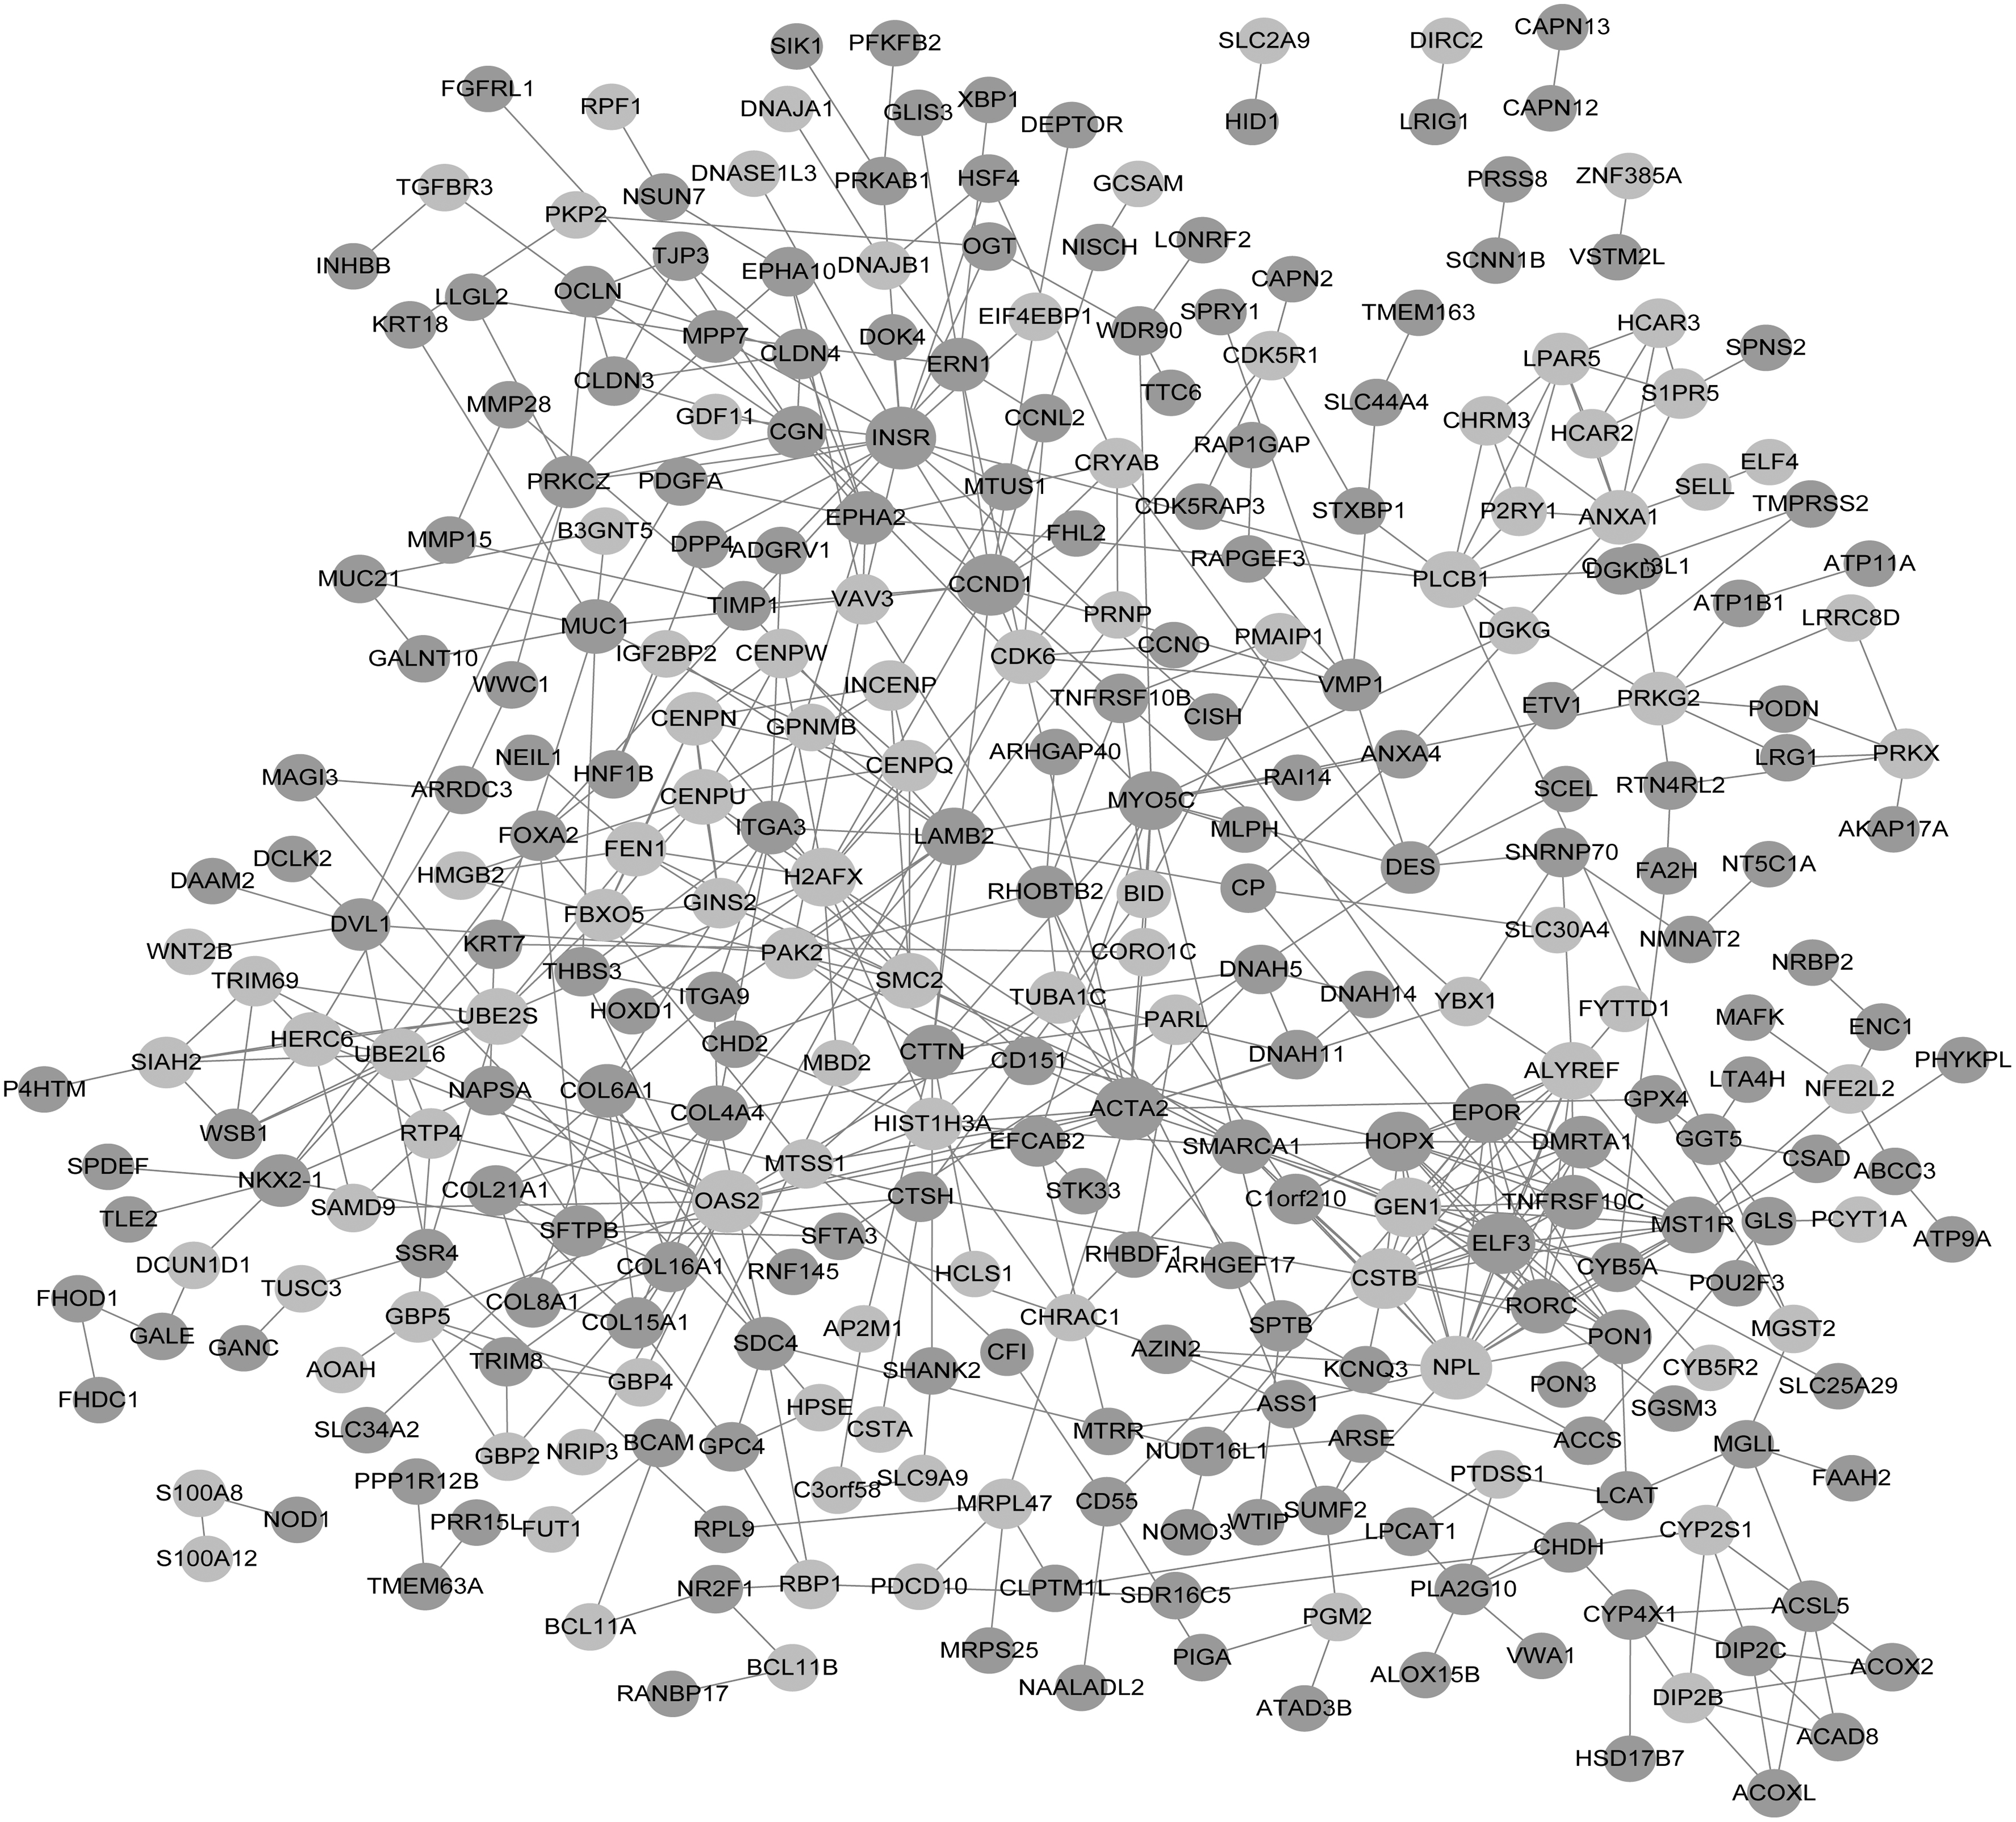
PPI network analysis of DEGs. Light grey circles represent genes that are upregulated, and dark grey circles represent genes that are downregulated. PPI, protein–protein interaction.
3.4. Coexpression analysis and functional prediction of lncRNA
A total of 716 coexpressed DEG-DE-lncRNA pairs were identified, including 106 DE-lncRNAs and 366 DEGs. Among them, the top 10 DE-lncRNAs that had more corepressed relationships with DEGs included GSEC (upregulated), NKX2-1-AS1 (downregulated), LINC01415 (upregulated), LINC00839 (upregulated), LINC00884 (downregulated), IL20RB-AS1 (upregulated), C4A-AS1 (downregulated), LINC00310 (downregulated), C4B-AS1 (downregulated), and PTCHD1-AS (downregulated). Subsequently, the DE-lncRNAs involved in the lncRNA-mRNA coexpression relationship were subjected to KEGG pathway enrichment analysis. The results showed that these DE-lncRNAs were mainly associated with choline metabolism in cancer, galactose metabolism, starch and sucrose metabolism, amino sugar and nucleotide sugar metabolism, and tight junction (Fig. 3A).
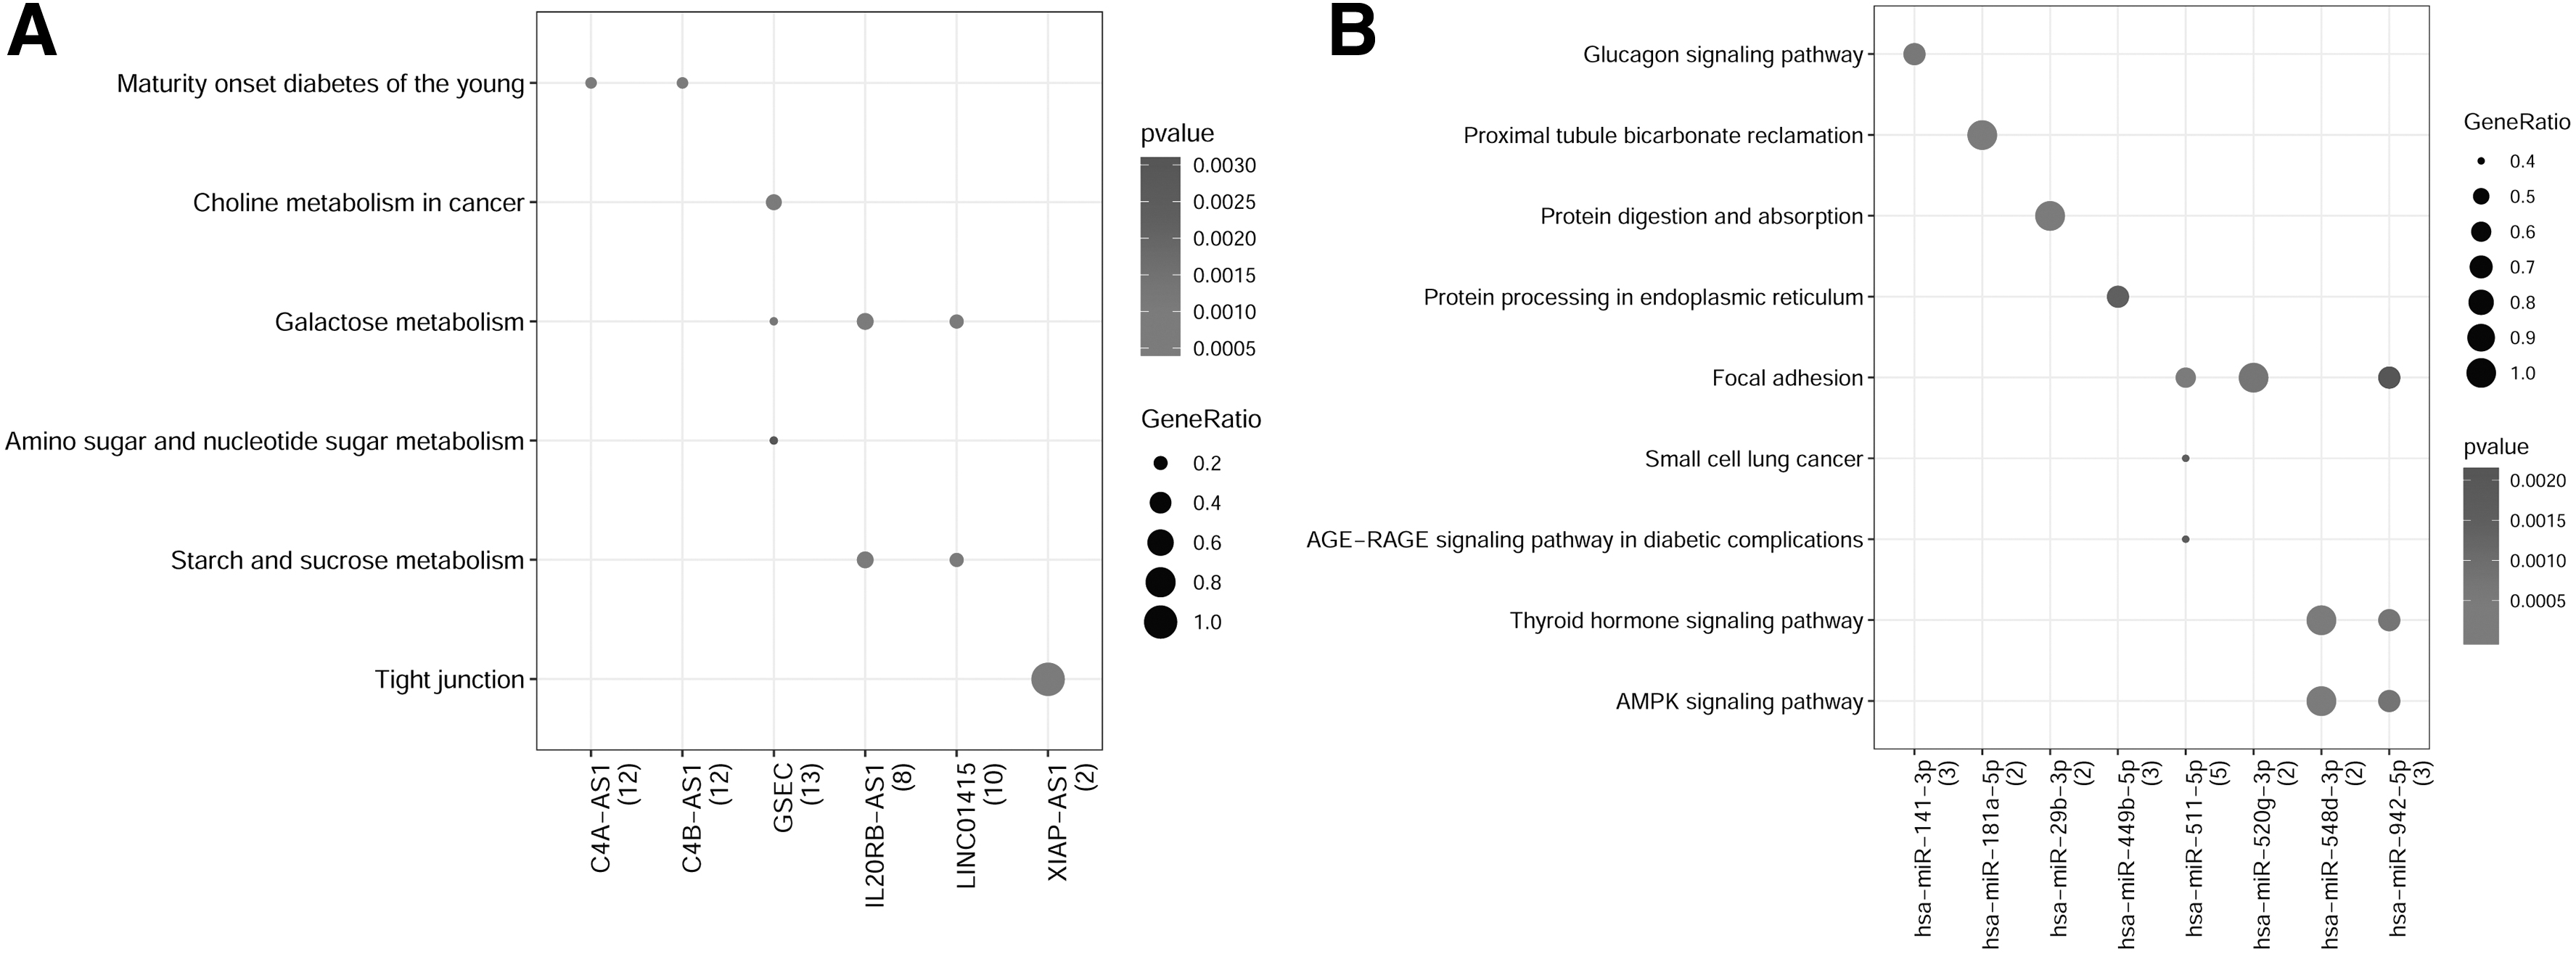
Pathway enrichment analysis of lncRNAs involved in the lncRNA-mRNA coexpression relationship
3.5. Prediction of DEG-related miRNAs and function enrichment analysis of miRNAs
By prediction of DEG-related miRNAs using miRNA target gene prediction tool miRWalk2.0, a total of 718 pairs of target gene relationships were predicted in more than seven databases. After deduplication, 698 pairs of miRNA-mRNA relations were obtained, including 341 miRNAs and 85 mRNAs. The regulatory network is shown in Figure 4. The top 10 nodes with higher degrees in the regulatory network included solute carrier family 5 member 3 (SLC5A3, downregulated, degree = 56), sorting nexin family member 30 (SNX30, downregulated, degree = 32), ETS variant 1 (ETV1, downregulated, degree = 26), P21 (RAC1) activated kinase 2 (PAK2, upregulated degree = 23), rhotekin 2 (RTKN2, upregulated, degree = 23), family with sequence similarity 117 member B (FAM117B, upregulated, degree = 21), CKLF like MARVEL transmembrane domain containing 4 (CMTM4, downregulated, degree = 21), disco interacting protein 2 homolog B (DIP2B, upregulated, degree = 20), LON peptidase N-terminal domain and ring finger 2 (LONRF2, downregulated, degree = 19), and methyl-CpG binding domain protein 2 (MBD2, upregulated, degree = 18).
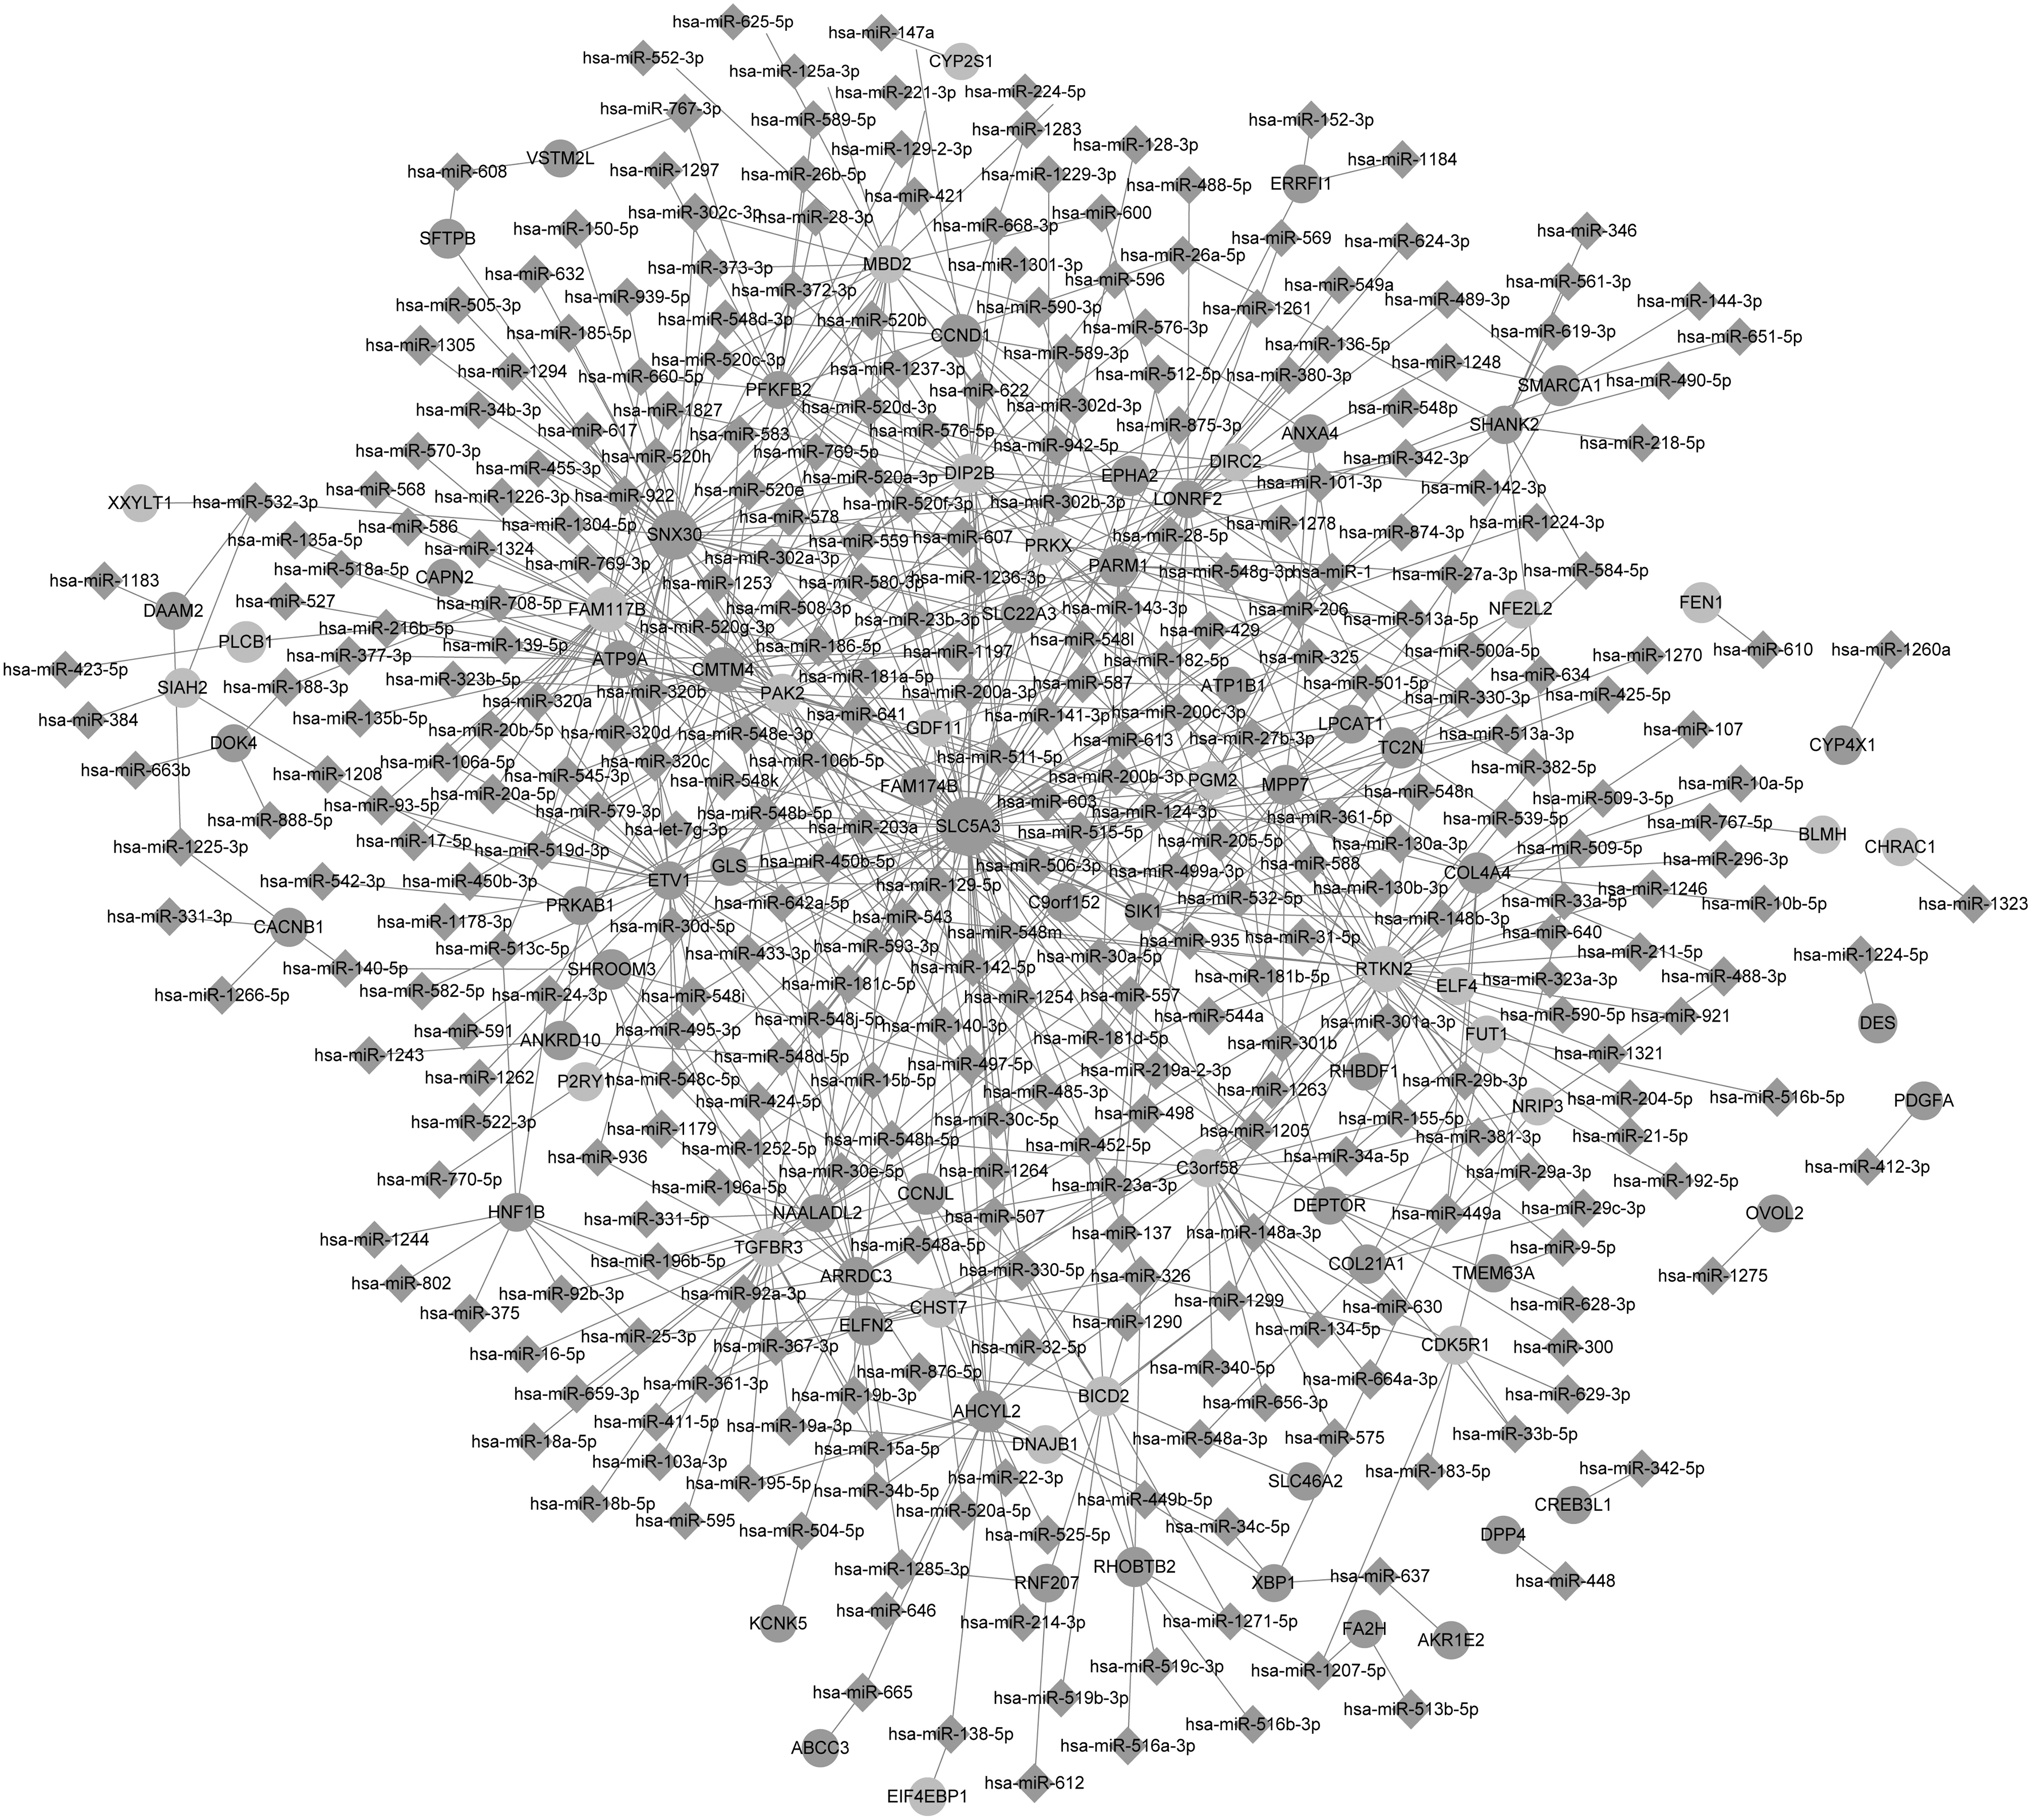
miRNA-mRNA regulatory network. The light grey circle indicates the gene whose expression is upregulated, the dark grey circle indicates downregulated gene, and the diamond indicates miRNA. The size of the node represents the degree of connectivity, that is, the larger the node, the more important the gene is.
Further pathway enrichment analysis of the miRNAs involved in the regulatory network showed that these miRNAs were mainly concerned with the proximal tubule bicarbonate reclamation, protein digestion and absorption, focal adhesion, thyroid hormone signaling pathway, and AMPK signaling pathway (Fig. 3B).
3.6. Construction of ceRNA regulatory network
The miRNA-lncRNA relations downloaded from LncBase v.2 database were identified and the differential lncRNA-related regulatory pairs were selected. A total of 42 miRNA, 12 DE-lncRNAs, and 66 regulatory pairs were obtained. Then, the lncRNA-miRNA-mRNA ceRNA network obtained by further combining with miRNA-target gene regulatory network and coexpression relationship of DEG and DE-lncRNA coexpression relationship, resulting in 42 miRNA, 12 lncRNAs, 46 DEGs, and 147 regulation relationships in the ceRNA network (Fig. 5). The top 10 nodes with higher degrees in the ceRNA network were as follows: LINC01410 (degree = 18, upregulated lncRNA), NEAT1 (degree = 11, downregulated lncRNA), SLC5A3 (degree = 9, downregulated gene), hsa-miR-497-5p (degree = 8), LINC00839 (degree = 7, upregulated gene), ETV1 (degree = 6, downregulated gene), CMTM4 (degree = 6, downregulated gene), hsa-miR-515-5p (degree = 6), hsa-miR-922 (degree = 6), and SNX30 (degree = 5, downregulated gene).

ceRNA network. The light grey circle represents the gene with upregulation, the dark grey circle represents the downregulated gene, the light grey triangle represents the lncRNA with downregulated expression, the dark grey triangle represents the lncRNA with upregulated expression, the diamond represents the miRNA, and the dotted line indicates for coexpression regulation. The solid line indicates ceRNA regulation. In the regulatory relationship, the T-shaped arrow indicates the lncRNA-miRNA regulatory relationship, the triangular arrow indicates the miRNA-mRNA regulatory relationship, and the size of the node represents the degree of connectivity, that is, the larger the node, the more important the gene is.
KEGG pathway enrichment analysis was performed on mRNA, miRNA, and lncRNA in the ceRNA network, respectively. No pathway was enriched by the DEGs in the ceRNA network. As shown in Figure 6, lncRNAs in the ceRNA network were mainly involved in protein digestion and absorption and Wnt signaling pathway; whereas miRNAs in the ceRNA network were enriched in different pathways such as galactose metabolism and transcriptional misregulation in cancer.

Pathway enrichment analysis of miRNAs
3.7. Survival analysis
K–M curve analysis was then carried out on the 46 DEGs and 12 DE-lncRNAs in the ceRNA network to investigate OS in patients with LUAD and LUSC. As a result, we found that these 12 DE-lncRNAs were not significantly associated with the patient OS (p > 0.05, Table 1). In contrast, the expression levels of some DEGs were associated with the patient OS (p < 0.05). The genes that were hub nodes in the PPI network or miRNA regulatory network or ceRNA network such as LONRF2, ETV1, RTKN2, DIP2B, SNX30, and PAK2 were associated with the OS of patients with LUAD (Supplementary Fig. S2). Thereinto, two genes DIP2B (log-rank p = 0.006047) and PAK2 (log-rank p = 0.003839) were negatively associated with the patient OS while LONRF2 (log-rank p = 0.049739), ETV1 (log-rank p = 0.048147), RTKN2 (log-rank p = 0.036488), and SNX30 (log-rank p = 0.003889) prolonged survival time. In contrast, the expression level of CCND1 (log-rank p = 0.040189) was negatively associated with the OS of patients with LUSC (Supplementary Fig. S3). Moreover, CCNJL and SFTPB were associated with the OS of both patients with LUAD and patients with LUSC (Supplementary Figs. S2 and S3). Nevertheless, high expression levels of CCNJL (log-rank p = 0.027078) and SFTPB (log-rank p = 2.42E-05) prolonged survival time of patients with LUAD; on the contrary, CCNJL (log-rank p = 0.029681) and SFTPB (log-rank p = 0.035284) were negatively associated with the OS of patients with LUSC.
Log-Rank Test of Differentially Expressed Genes in the ceRNA Network for the Overall Survival in Patients with Lung Adenocarcinoma and Lung Squamous Cell Carcinoma
The bold log-rank test p-value represents p < 0.05. LUAD, lung adenocarcinoma. LUSC, lung squamous cell carcinoma.
4. Discussion
In this study, a total of 518 DEGs and 117 DE-lncRNAs were screened out between LUSC and LUAD. The DEGs were mainly associated with cell adhesion, PI3K-Akt signaling pathway, and focal adhesion. PPI network analysis indicated several genes with highest connectivity, such as CCND1. DE-lncRNAs that coexpressed with DEGs were also associated with tight junction and DE-lncRNAs that had more coexpressed relationships with DEGs included GSEC (upregulated) and NKX2-1-AS1 (downregulated). Moreover, the genes and lncRNAs with higher connectivity in the ceRNA network included LINC01410, NEAT1, SLC5A3, LINC00839, ETV1, CMTM4, and SNX30. Several genes were significantly related to the survival of patients with LUSC or LUAD, including ETV1, SNX30, and CCND1.
Some of the proteins relevant to intercellular junctions and cell polarity are particularly widespread in LUSC (Bonastre et al., 2016). Compared with adenocarcinoma, a remarkably high expression of desmosomal cadherins molecules was observed in LUSC, which may be associated with the late pattern of metastasis in LUSC (Boelens et al., 2007). Previous study has demonstrated that the major subtypes of NSCLC are characterized by specific patterns of cell junctions and distinct sets of cell adhesion molecule expression (Kuner et al., 2009). In this study, we found that the DEGs and DE-lncRNAs between LUSC and LUAD were significantly involved in tight junction. Taken together, the mRNA and/or lncRNA expression patterns may participate in complex networks orchestrating cell junction in different subtypes of NSCLC.
In addition, our study showed that several significant lncRNAs and genes showed distinct expression patterns between LUSC and LUAD. A recent study demonstrated that the GSEC (G-quadruplex-containing sequence lncRNA) plays a critical role in cancer cell migration (Matsumura et al., 2016). Remarkably, another study identified significant difference in expression level of NKX2-1-AS1 between LUAD and LUSC (Zhao et al., 2014). Amounting evidence indicates the significance of NEAT1 in lung cancer progression (Pan et al., 2015; Sun et al., 2016). There was significantly more frequent lung metastasis in the ETV1-overexpressing animals (Heeg et al., 2016). Previous investigation showed that CCND1 overexpression and PTEN promoter hypermethylation significantly shortened survival in patients with LUSC (Dragoj et al., 2015), which was consistent with our finding. Thus, our findings suggested that these lncRNAs and genes may be effective and novel targets for the development of NSCLC specific therapeutic strategies; in addition, the signature of these genes and lncRNAs in NSCLC should consider subtype-dependent effects.
In conclusion, our study demonstrated mRNA and lncRNAs expression patterns that may be used to discriminate histological subtypes of LUAD and LUSC. Genes and lncRNAs associated with cell junction have specific patterns in these two major histological subtypes of NSCLC. GSEC, NKX2-1-AS1, NEAT1, CCND1, and ETV1 may provide potential valuable biomarkers for personalized treatment options of NSCLC. Nevertheless, these findings should be validated in larger prospective cohorts to adequately confirm the diagnostic and prognostic importance.
Footnotes
Author Disclosure Statement
The authors declare they have no conflicting financial interests.
Funding Information
This study was supported by Shaanxi Province Natural Science Research Project (Program No. 2018JM7044), Key Projects of Social Development Research Programs of Shaanxi Province (Program No. 2017SF-199), Research Foundation of Shaanxi Provincial Administration of traditional Chinese Medicine (Program No. JCPT039), Xi'an Science and Technology Bureau of social development projects [Program No. 2016047SF/YX03(4); 201805093YX1SF27(9)], Xi'an Medical College Advanced Subjects Project Funded (Program No. 16SXK), and Shaanxi Province Health Commission research projects (Program No. 2016D036 and 2018D019).
References
Supplementary Material
Please find the following supplemental material available below.
For Open Access articles published under a Creative Commons License, all supplemental material carries the same license as the article it is associated with.
For non-Open Access articles published, all supplemental material carries a non-exclusive license, and permission requests for re-use of supplemental material or any part of supplemental material shall be sent directly to the copyright owner as specified in the copyright notice associated with the article.