
Abstract
We aimed to identify differentially expressed genes (DEGs) in epidermal stem cells (epiSCs) in response to high fat diet (HFD). DEGs were identified by time-series analysis of the gene expression profile (GSE84510) in Gene Expression Omnibus (GEO) database. Functions and pathways affected by HFD were identified by functional annotation of DEGs. Key factors responding to HFD was identified by protein–protein interaction (PPI) network analysis. Two groups of genes with the same tendency in response to HFD were identified. ECM-related processes and PI3K pathway were altered in the early stage of obesity. A PPI network was constructed to delineate the interactions among proteins encoded by DEGs and ICAM1 and RELA were key epiSC factors respond to HFD. Our studies may provide valuable insights into the molecular mechanisms underlying how obesity affects the functions of epiSC.
1. INTRODUCTION
Obesity is characterized by excessive accumulation of fat in adipose tissue or other organs and has been considered as a big threat to human health in both developed and developing countries (Hruby and Hu, 2015). Obesity may lead to various complications, including hypertension, coronary heart disease, stroke, gallbladder disease, cancer, noninsulin-dependent diabetes, dyslipidemia, osteoarthritis, and sleep apnea (Pi-Sunyer, 2009). In addition to poor physical conditions, obese people also suffered from social prejudice and discrimination, which may discourage them from seeking medical assistance (Puhl and Brownell, 2001; Forhan and Salas, 2013).
Obesity has an obvious feature of fat accumulation in the skin (Yosipovitch et al., 2007). The skin and its appendages play various roles in animal's survival (Blanpain and Fuchs, 2006). Stem cells are responsible for the maintenance of tissue homeostasis (Blanpain and Fuchs, 2009; Biteau et al., 2011). In the skin, the stem cells are called epidermal stem cells (epiSCs) and critical for skin homeostasis (Blanpain and Fuchs, 2009). As other adult stem cells, epiSCs can generate themselves by self-renewal capacity and differentiate into mature cells by differentiation capacity (Roobrouck et al., 2008; Blanpain and Fuchs, 2009). In the published article, researchers have found that epiSC undergo circadian reprogramming in the mice fed with high fat diet (HFD) (Solanas et al., 2017). But how HFD affects the other functions of epiSCs remains unknown.
In this study, we reanalyzed the data GSE84510 deposited in Gene Expression Omnibus (GEO) database (Solanas et al., 2017), performed time-series analysis of gene expression profile, and selected differentially expressed genes (DEGs) in response to HFD. Key DEGs were further selected from protein–protein interaction (PPI) network. Functions and pathways affected by HFD were identified by functional annotation.
2. MATERIALS AND METHODS
2.1. Data source and preprocessing
Expression profile data GSE84510 were downloaded from GEO database (Barrett et al., 2007). The mRNA expression profile data of epiSC samples from 21 HFD mice at 6 zeitgeber-time points (ZT0, ZT4, ZT8, ZT12, ZT16, and ZT20) were used in our analysis. The data were obtained based on GPL11180 [HT_MG-430_PM] Affymetrix HT MG-430 PM Array Plate.
The primitive data (CEL format) were preprocessed (background adjustment, quantile normalization, and finally summarization and log base 2 scale) by oligo (version 1.58.0) package in R (Bolstad et al., 2003). The probes (probe ID) were mapped to the miRNAs using the annotation file of the platform. Probes with no matched miRNAs were excluded. The expression value of the miRNA that matched with multiple probes was defined as the mean value of these matched probes. Finally, the standardized matrix file at six time points was obtained.
2.2. Time-series expression analysis
Short Time-series Expression Miner (STEM) (version 1.3.11) was used for cluster analysis of all the genes obtained in the previous step (Ernst and Bar-Joseph, 2006). STEM is a program specifically designed for analyzing short time-series microarray gene expression data, and it provides a unique approach for comparing, clustering, and visualizing the data. We set the number of cluster genes as ≥20, the correlation coefficient of gene expression in each cluster as >0.7, and the significance p-value as <0.05.
Gene modules clustered by STEM were grouped by their trends (color consistency) and genes in the same module group were pooled as a single gene set, which was used for further analysis.
2.3. Functional annotation of DEG sets
Functional annotation was performed for each DEG set by the online tool DAVID (Huang et al., 2008) (version 6.7). p-Value <0.05 and gene count >2 were set as the selection thresholds for significant Gene Ontology (GO) biological processes (Ashburner et al., 2000) and Kyoto Encyclopedia of Genes and Genomes (KEGG) pathways (Kanehisa and Goto, 2000).
2.4. PPI network construction and module analysis of DEGs
The STRING (version 10.0) database was used to predict and analyze the interactions between the proteins encoded by DEGs (Szklarczyk et al., 2014). The PPI score was set as 0.4 (median confidence). The PPI network was constructed by Cytoscape (version 3.2.0) (Shannon et al., 2003).
The CytoNCA (version 2.1.6) was used for the analysis of topology properties of the PPI network, with parameter of without weight (Tang et al., 2015). The nodes were ranked according to their scores and the top 20 nodes were considered as the key nodes in the PPI network. GO and KEGG pathway enrichment analysis were conducted for the top 20 genes. To further explore the relationships among the top 20 genes and the enriched pathways, we constructed a PPI-gene-pathway network based on the enrichment results using Cytoscape.
3. RESULTS
3.1. Time-series analysis of gene expression profile
After analysis by STEM, a total of eight clusters, including cluster 37, 33, 31, 28, 9, 25, 42, 16, and 5, were significantly enriched (Fig. 1). Consistent colors indicated consistent trends and, therefore, clusters with consistent color could be grouped together. Among these clusters, cluster 37 and 33 were consistent and cluster 31 and 28 were consistent. The remaining four clusters showed distinct colors. Therefore, cluster 37 and cluster 33 were grouped as a cluster, and cluster 31 and cluster 28 were grouped as a cluster. The two groups were used for further investigation.

Gene time-series expression cluster. Each square represents a set of gene cluster by STEM. The number on the upper left of the square indicates the number of the cluster gene set; the black discount in the square indicates the overall trend of the expression of all genes in the gene set; the gene set with shadow is significant, and the set with same color have similar tendency. STEM, Short Time-series Expression Miner.
3.2. Functional and pathway enrichment analysis
KEGG pathways enriched by genes in the cluster (37 and 33) included tumor necrosis factor (TNF) signaling pathway, ECM receptor interaction, and PI3K-Akt signaling pathway (Fig. 2A). GO functions enriched by the cluster (37 and 33) included positive regulation of gene expression, proteinaceous extracellular matrix, and cell adhesion (Fig. 2B). No KEGG pathway was enriched by the cluster (31 and 28) and the GO functions enriched by the cluster (31 and 28) included negative regulation of smooth muscle cell proliferation, extracellular space, and extracellular region.

KEGG and GO pathway analysis.
3.3. PPI network analysis and enrichment analysis of key nodes
A PPI network (Fig. 3) was constructed to delineate the PPIs among proteins encoded by genes in the red cluster and green cluster. The PPI network contained 108 nodes and 166 interaction pairs. The nodes were ranked according to their topological scores and the top 20 nodes were considered as the key nodes of the PPI network (Table 1). The top three nodes were intercellular adhesion molecule 1 (ICAM1), RELA and prostaglandin-endoperoxide synthase 2 (PTGS2).
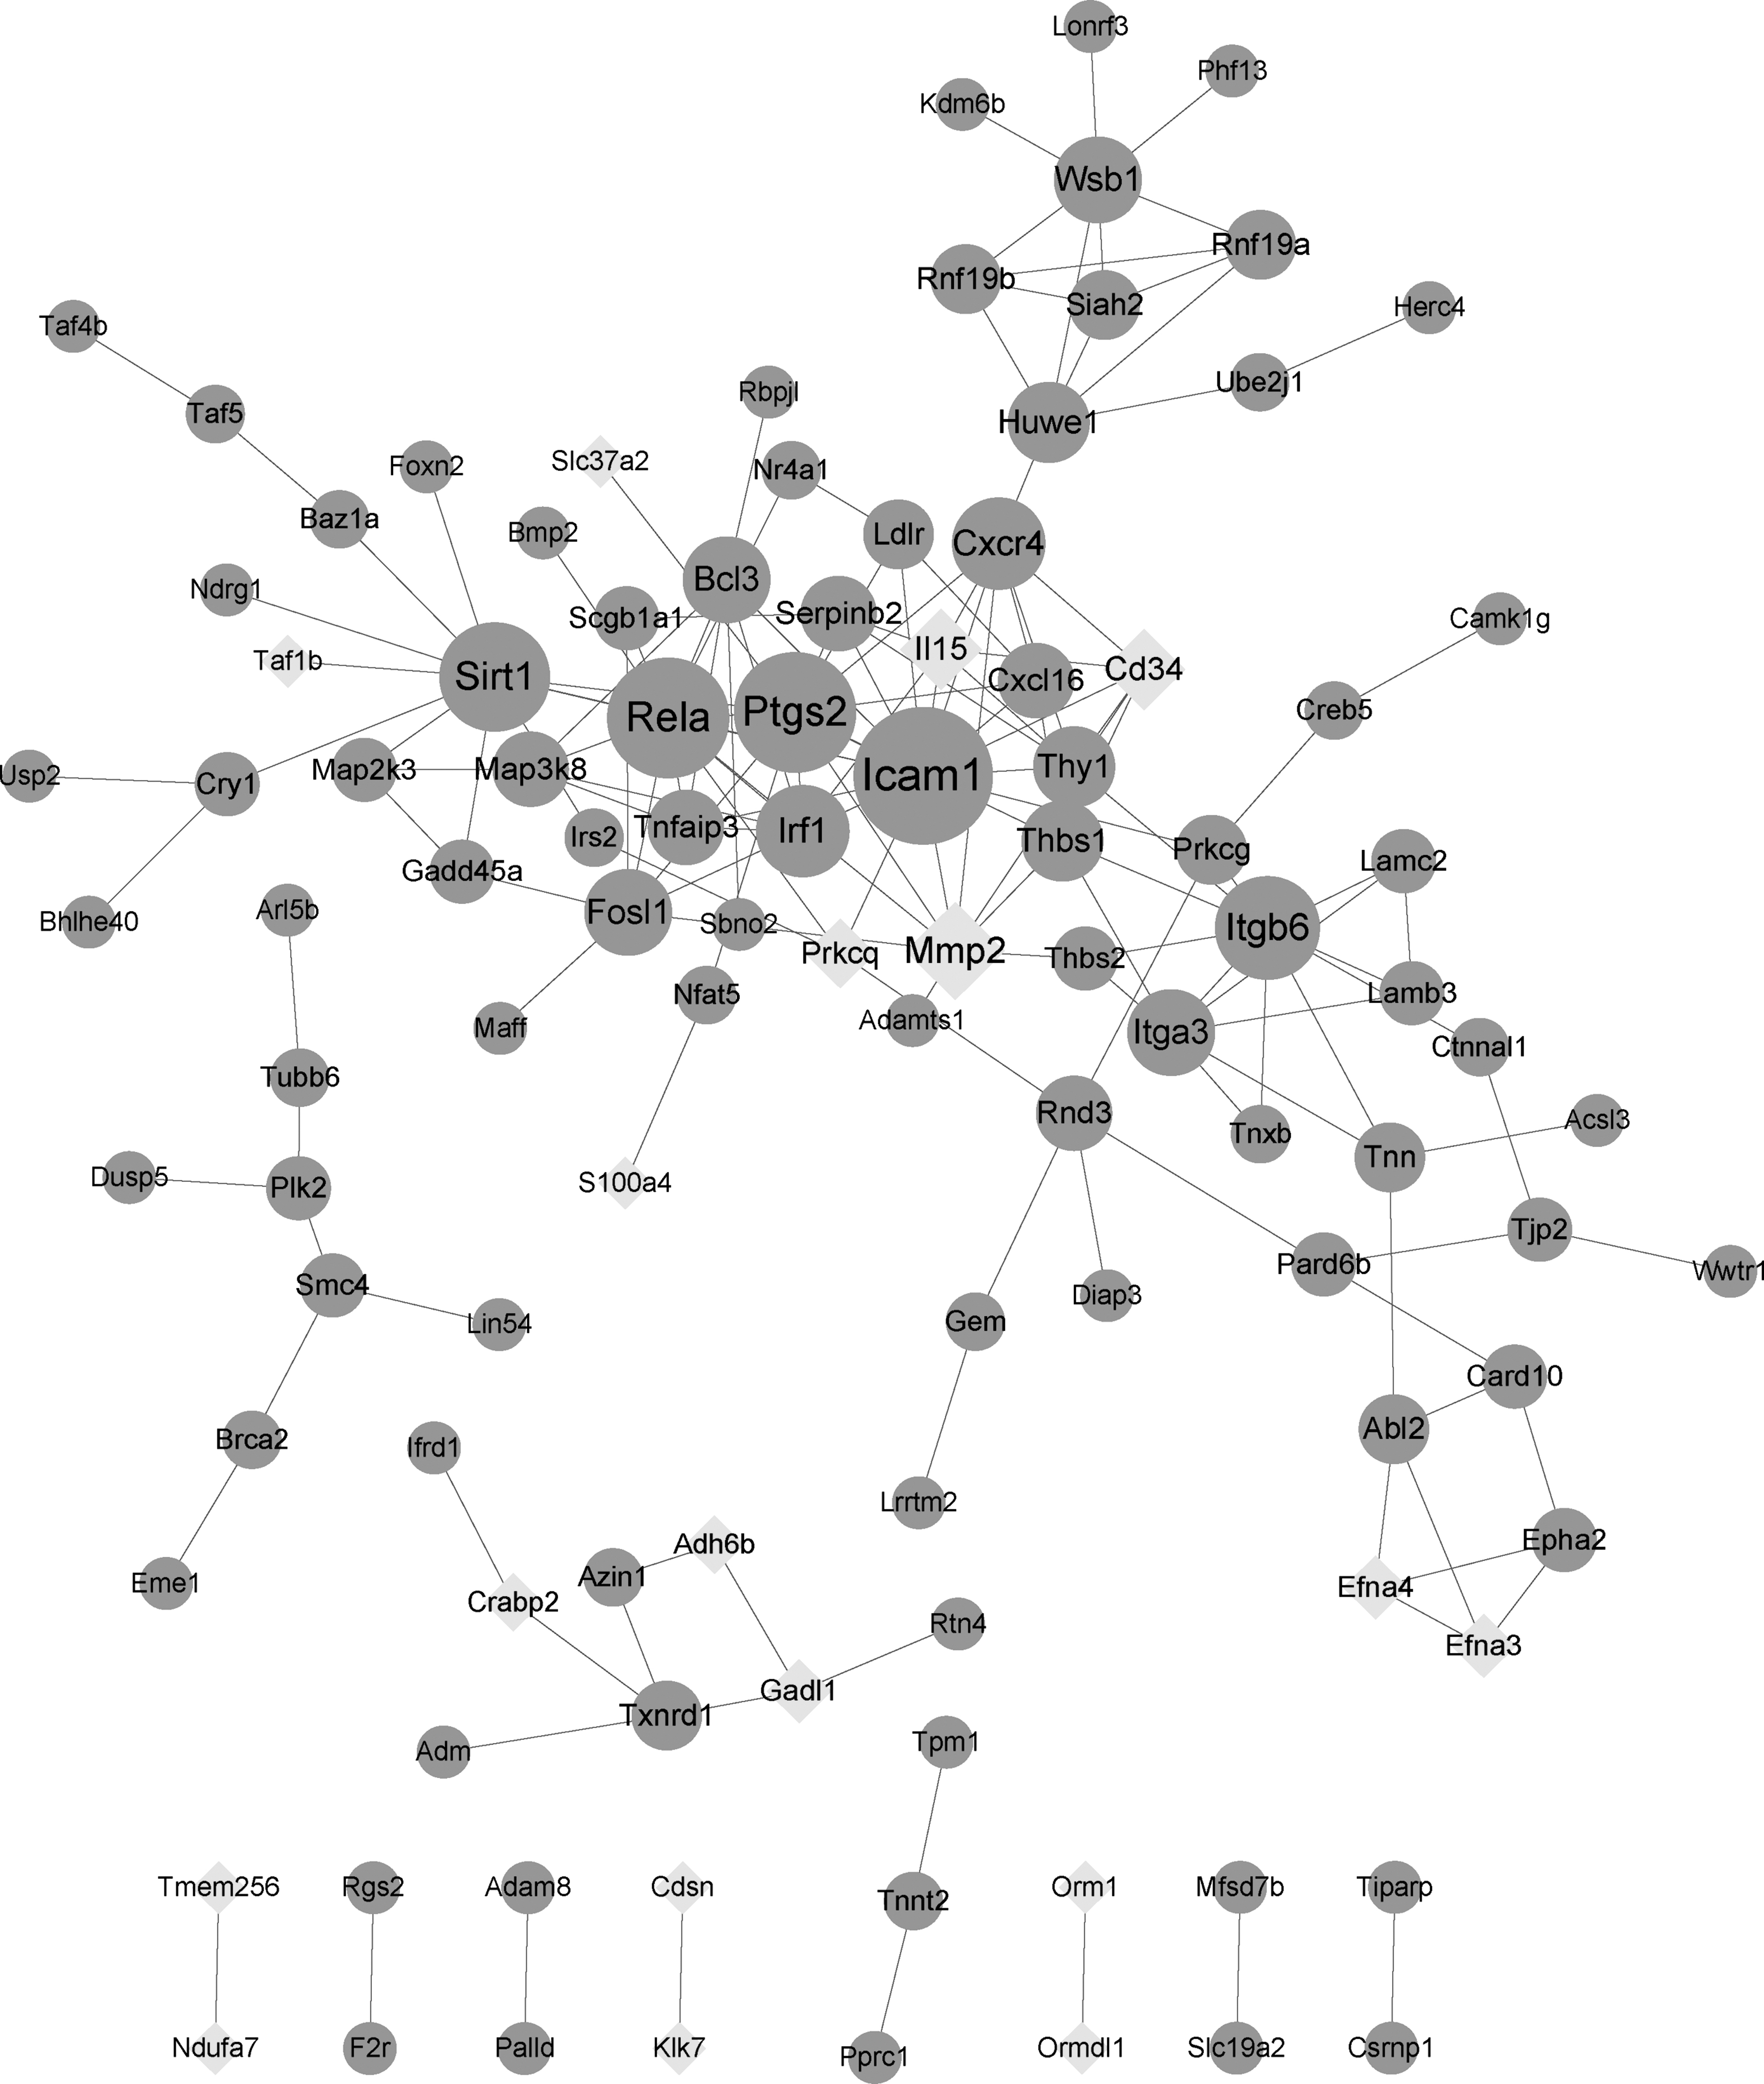
The PPI network of genes from cluster (37 and 33) and cluster (31 and 28). The circle is gene from the cluster (37 and 33) and the rhombus from cluster (31 and 28). The size of the nodes is in proportion to the degree of the corresponding nodes. PPI, protein–protein interaction.
Key Nodes in the Protein–Protein Interaction Network
We also performed KEGG pathway and GO enrichment analysis using the top 20 genes. The enrichment results are shown in Figure 4. A PPI-gene-pathway network (Fig. 5) was further constructed for the top 20 genes. The network contained 11 red cluster genes, 2 green cluster genes, and all the 8 KEGG pathways in Figure 4. In this network, ICAM1 and RELA were key factors. ICAM1 was highly related to ECM pathway, and RELA was associated with PI3K-Akt signaling pathway.

KEGG pathway and the top 10 GO terms of the key nodes of the PPI network.

The PPI-gene-pathway network. The circles are genes from the cluster (37 and 33) and the diamonds are genes from the cluster (31 and 28).
4. DISCUSSION
In this study, two groups of genes showing consistent expression tendency in response to HFD were identified by time-series analysis. Our functional annotation showed that ECM-related processes and PI3K pathway were affected by HFD. In addition, our PPI network analysis showed that RELA and ICAM1 were key factors in response to HFD. Altogether, our studies may provide valuable insights into the molecular mechanisms underlying how HFD affects the functions of epiSC.
It has been reported that HFD can affect various types of stem cells. For example, HFD may result in changes of intestinal stem cell and is also associated with increased risks of tumorigenesis (Beyaz et al., 2016). HFD may activate lung stem cells of adult mouse and accelerate some aging-induced effects (Hegab et al., 2018). In this study, we revealed that HFD can result in gene expression changes in mouse epiSCs. EpiSCs were essential for skin homeostasis and we speculated that HFD can affect skin homeostasis, which remains to be investigated in the future.
According to our functional annotation analysis, ECM-related pathways in epiSCs were significantly altered in response to HFD. It has been reported that ECM can act as a regulator of epiSC fate (Morgner et al., 2015). ECM is an important component of the microenvironment (niche) (Gattazzo et al., 2014). In the skin, there are at least three types of epiSC niches: the basal layer of hair follicle bulge, interfollicular epidermis, and the base of the sebaceous gland (Watt and Jensen, 2009). However, whether the epiSC niches were affected by HFD remains to be investigated. Moreover, our study also showed that PI3K-Akt signaling in epiSCs was also affected by HFD. Researchers have reported that the PI3K/AKT pathway promotes the survival, proliferation and stemness of many stem cells, including epiSCs (Lee et al., 2009; Xia and Xu, 2015). Taken together, our results showed that HFD may impose a substantial effect on signaling pathways in epiSCs.
In the PPI network, we identified key factors, ICAM1 and RELA. ICAM1 belongs to immunoglobulin superfamily of the adhesion proteins, which has a similar structure of repeating immunoglobulin-like domains (van de Stolpe and van der Saag, 1996). Researchers find that ICAM1 can mediate cell–ECM interaction (Chen et al., 2013). In mouse, ICAM1 in the bone marrow niche can serve as a regulator that controls quiescence and functions of hematopoietic stem cells (Liu et al., 2018). Besides, in lymphocytes, ICAM1 is also identified as a co-stimulatory ligand that regulates lymphocyte function (O'Gorman et al., 2000; Lebedeva et al., 2005). Moreover, as the other key factors, RELA (p65) is a member of the nuclear factor kappa B (NF-κB) family, which is expressed in almost all cell types and tissues and plays a key role in immunity, inflammation, cell proliferation, survival, and differentiation (Oeckinghaus and Ghosh, 2009). NF-κB activity is mediated through post-translational modification of its subunits (Huang et al., 2010). RELA acetylation at discrete sites can regulate distinct nuclear functions of NF-κB (Chen et al., 2002). Besides, some studies suggested that PI3K-Akt pathway can regulate the transactivation of RELA through alteration of its state of phosphorylation (Madrid et al., 2001) and epidermal p65/NF-κB signaling is important for carcinogenesis of skin (Kim and Pasparakis, 2014). Altogether, in our study ICAM1 and RELA were key epiSC factors responding to HFD.
One of the major advantages of our study was the use of time-series analysis to identify epiSC genes respond to HFD. Besides, the PPI network provided a comprehensive view of the interaction among key genes, which may improve our understanding of the potential mechanisms of homeostasis of the skin. Nevertheless, there were also some limitations in our study. Validation data sets are needed to validate the key genes. Furthermore, cell or animal experiments are also needed to provide an understanding regarding whether the epiSC niches can response to HFD.
5. CONCLUSION
In conclusion, we identified two clusters of genes that have the same tendency in response to HFD. Among these genes, ICAM1 and RELA were key factors responding to HFD in epiSC. Besides, ECM-related processes and PI3K signaling pathway were significantly altered by HFD in epiSC. Our studies may advance our understanding about how HFD affects the functions of epiSC.
ETHICAL APPROVAL
This article does not contain any studies with human participants or animals performed by any of the authors.
Footnotes
AUTHOR DISCLOSURE STATEMENT
The authors declare they have no competing financial interests.