




Abstract
Angiitis, also known as vasculitis, is a chronic inflammatory disease characterized by the infiltration of inflammatory cells in surroundings of blood vessels, accompanied by vascular damage including fibrin deposition, collagen fiber degeneration, myocyte, and endotheliocyte necrosis. This work aimed to perform an integrated bioinformatic analysis of three data sets concerning vasculitis to explore and examine the potential diagnostic and therapeutic makers contributing to illuminating the pathomechanisms of vasculitis. We collected three sets of gene expression data designed by dual-channel method from Gene Expression Omnibus, which were based on the same platform (Agilent-014850 Whole Human Genome Microarray 4x44K G4112F). The meta-analysis was used to analyze the gene expression profiles and screen the differentially expressed genes followed by functional features identification. Subsequently, a protein–protein interaction and transcriptional regulation network were conducted for further investigation of expression mechanisms of vasculitis. Totally, 73 consistently upregulated genes, 49 consistently downregulated genes, and 26 genes with different expression directions were identified. Functional enrichment and transcription regulation analysis suggested upregulated genes (PPBP, PLAU, and HIST1H2BH) and downregulated genes such as IL23A gene were predominately associated with immune responses and cytokine receptors function. In addition, specific cancer-related genes such as MRVI1 was also extracted and considered as promising biomarkers of the development and progression of vasculitis. This study established an integrated meta-analysis approach and identified novel biomarkers involved in vasculitis, which further facilitate to explore and unravel the etiopathogenesis of vasculitis.
Introduction
Vasculitis is a systemic disease characterized by inflammation and injured vascular wall and heterogeneity on the basis of organs involved (Hoffman and Calabrese, 2014; Luqmani, 2015; Elefante et al., 2018). The clinical heterogeneity and confusion in the nomenclature has presented barriers for advancing our understanding of the fundamental pathogenesis of this multisystem disorder (Scott and Watts, 2013; Wrzodek et al., 2013; Allali and Chizzolini, 2014). Fortunately, over a long period of time, various groups have focused more attention on microarray data based on high-throughput sequencing technology available and efficient data mining techniques to identify potential diagnostic makers and therapeutic targets for management of vasculitis (Kobayashi et al., 2008; Muso et al., 2013; Feng et al., 2017; Huang et al., 2018).
Takayasu arteritis (TA) as a type of large-vessel vasculitis represented a chronic inflammatory condition with significant intimal proliferation and fibrosis. Okuzaki et al. (2010) pointed out that interferon-induced genes (G1P2, IFI44, IFIT1, IFIT2, and IFIT27), in the light of the microarray analysis, were downregulated in many TA patients and were correlated with the development of TA. Transcriptional regulation network analysis of differentially expressed genes (DEGs) was implemented in later investigation with the TA microarray database. According to this work, 932 DEGs were extracted and RHOA, FOS, and EGR1 were considered potential targets for the diagnosis and treatment of TA (Huang et al., 2018).
Microscopic polyangiitis (MPA) belongs to another category of systemic vasculitis that primarily affects small blood vessels and is thought to be frequently related to antineutrophil cytoplasmic antoantibodies (Ahn et al., 2017). It was previously reported that ficolin-1 expression, which acts as a recognition molecular in the complement system, was consistently upregulated in MPA patients compared with the control individuals (Muso et al., 2013). In addition, Kobayashi et al. (2008) founded that EGR1 and GOS2 were probably implicated in the underlying mechanisms of vasculitis and autoimmune disease such as systemic lupus erythematosus (SLE) and rheumatoid arthritis. Feng et al. (2017) elaborated that FOS and UBB predominately have crucial roles in the pathogenesis of systemic vasculitis through inflammatory response signaling and Notch signaling pathway, respectively. Alternatively, there were multiple examinations that proposed that some specific cancer-related genes such as YWHAZ were also involved in systemic vasculitis (Nishimura et al., 2013).
Because of the complex pathological features of vasculitis, exhaustive investigations of pathogenetic components are still required to elaborate the underlying mechanisms of vasculitis to obtain adapted therapy regimens. Of note, an integrated bioinformatics analysis has not only extensively performed in revealing molecular mechanisms of a large number of refractory diseases, but also provided deeper observations and insights for gaining an effective treatment option (Wang et al., 2017; Chi et al., 2018; Falzone et al., 2018). Although previous studies have achieved the significant development in exploring the vasculitis pathophysiology based on gene expression profiles, an integrated bioinformatic analysis strategy based on meta-analysis has not been applied in discovering etiological factors of systemic vasculitis.
In this study, three data sets based on dual channel sequencing were collected and used to isolate DEGs between patient groups and normal groups. Functional enrichment analyses and functional annotation of candidate genes were carried out followed by the transcriptional factor identification and corresponding transcriptional regulatory network construction. Furthermore, cancer-related genes were also screened by systematically analyzing and comparing with cancer gene database to determine sensitive gene makers, which will contribute to promote understanding of systemic vasculitis.
Methods
Data source
The three data sets (GSE16945, GSE33910, GSE41744) (Okuzaki et al., 2010, 2012; Muso et al., 2013), based on Agilent-014850 Whole Human Genome Microarray 4x44K G4112F platform and designed by dual-channel method, were searched and downloaded from the National Center for Biotechnology Information Gene Expression Omnibus repository (www.ncbi.nlm.nih.gov/geo). The data set GSE16945 contained 13 patients with vasculitis and 16 healthy individuals. These experimental samples and the corresponding normal controls were all collected from peripheral blood mononuclear cells (PBMCs). For GSE33910, it was composed of PBMCs derived from 8 cases of TA patients and 17 normal controls. GSE41744 database included 8 specimens and 17 control samples that were all achieved from PBMCs of MPA patients and corresponding healthy individuals.
Data preprocessing and identification of DEGs
The raw gene expression profiles data were subjected to background correction using limma package (Smyth, 2004) to decrease heterogeneity. The normexp method (Smyth, 2004) was used to normalize microarray data derived from different data sets, followed by probe summarization with average method (Smyth, 2004) to obtain effective expression values matrix. Afterward, each data set was assessed and analyzed individually. A significant test was carried out using the empirical Bayes method based on limma package to identify DEGs related to angiitis between patient groups and healthy controls. Simultaneously, mean values of differential gene expression values and variance were calculated, respectively.
Meta-analysis of microarray data
The combined p value was calculated using the Fisher method (Fisher, 1925) and required to conform to chi-square distribution. Synchronously, the false discovery rate (FDR) can be obtained and the adjusted FDR value (FDR_P) was acquired using Benjamini method (Benjamini and Hochberg, 1995). Meanwhile, we used the ratio of mean values of each gene expression difference and variance as an effect size and z statistic was defined as the ratio of effect sizes and their standard errors. After that, p value was determined by comparing with the standard normal distribution and the FDR effect size (FDR_ES) was adjusted by Benjamini method. Heterogeneity (P_heterogeneity) (WG, 1954) was calculated and evaluated using a random effects model. Finally, qualified DEGs were selected according to the thresholds of FDR_P <0.05, FDR_ES <0.05 and P_heterogeneity >0.01 and were regarded as candidate genes for further investigations.
Enrichment analyses and functional annotation of DEGs
The functional enrichment analysis of DEGs was conducted based on Gene Ontology (GO) database (Ashburner et al., 2000), which mainly focused on terms representing biological process, molecular function, and cellular component. In addition, the Kyoto Encyclopedia of Genes and Genomes (KEGG) pathway enrichment analyses (Du et al., 2014) were performed by the hypergeometric distribution approach with 0.05 served as the cutoff.
Gene function prediction
Screened specific genes were tagged according to the transcription factor database (Matys et al., 2003; TRANSFAC) that consisted of data resource about transcription factors, target genes, and their binding sites to specify transcriptional regulation roles. Similarly, the relevant database resource including tumor suppressor (TS) genes (Zhao et al., 2013) and tumor-associated genes (TAG; Chen et al., 2013) was implemented to select cancer-promoting genes and suppressor genes involved in vasculitis.
Protein–protein interaction network and transcriptional regulatory network construction
A group of genes that their encoded proteins interacted with the targeted genes were selected and used for further protein–protein interaction (PPI) analysis based on the STRING database using the combined score of 0.95. The STRING database pools protein pairs data on the basis of experimental verification, coexpression analysis, and text mining (Szklarczyk et al., 2017). The interacting pairs at least contained one DEG. In addition, prediction of target genes of transcription factor was carried out using FDR = 0.05 as a cutoff, establishing the regulatory network of DEGs and their transcription factors.
Results
The characteristics of DEGs
The meta-analysis of three gene expression profiles associated with angiitis was examine to minimize heterogeneity, expand sample size, and screen the potential DEGs. According to the identification criteria mentioned in the Methods section, 148 DEGs were discriminated totally between patient groups and healthy groups, which included 73 consistently upregulated genes, 49 consistently downregulated genes, and 26 genes with different expression directions in the three data sets. In addition, the distribution patterns of these DEGs screened in each data set are given in Figure 1.
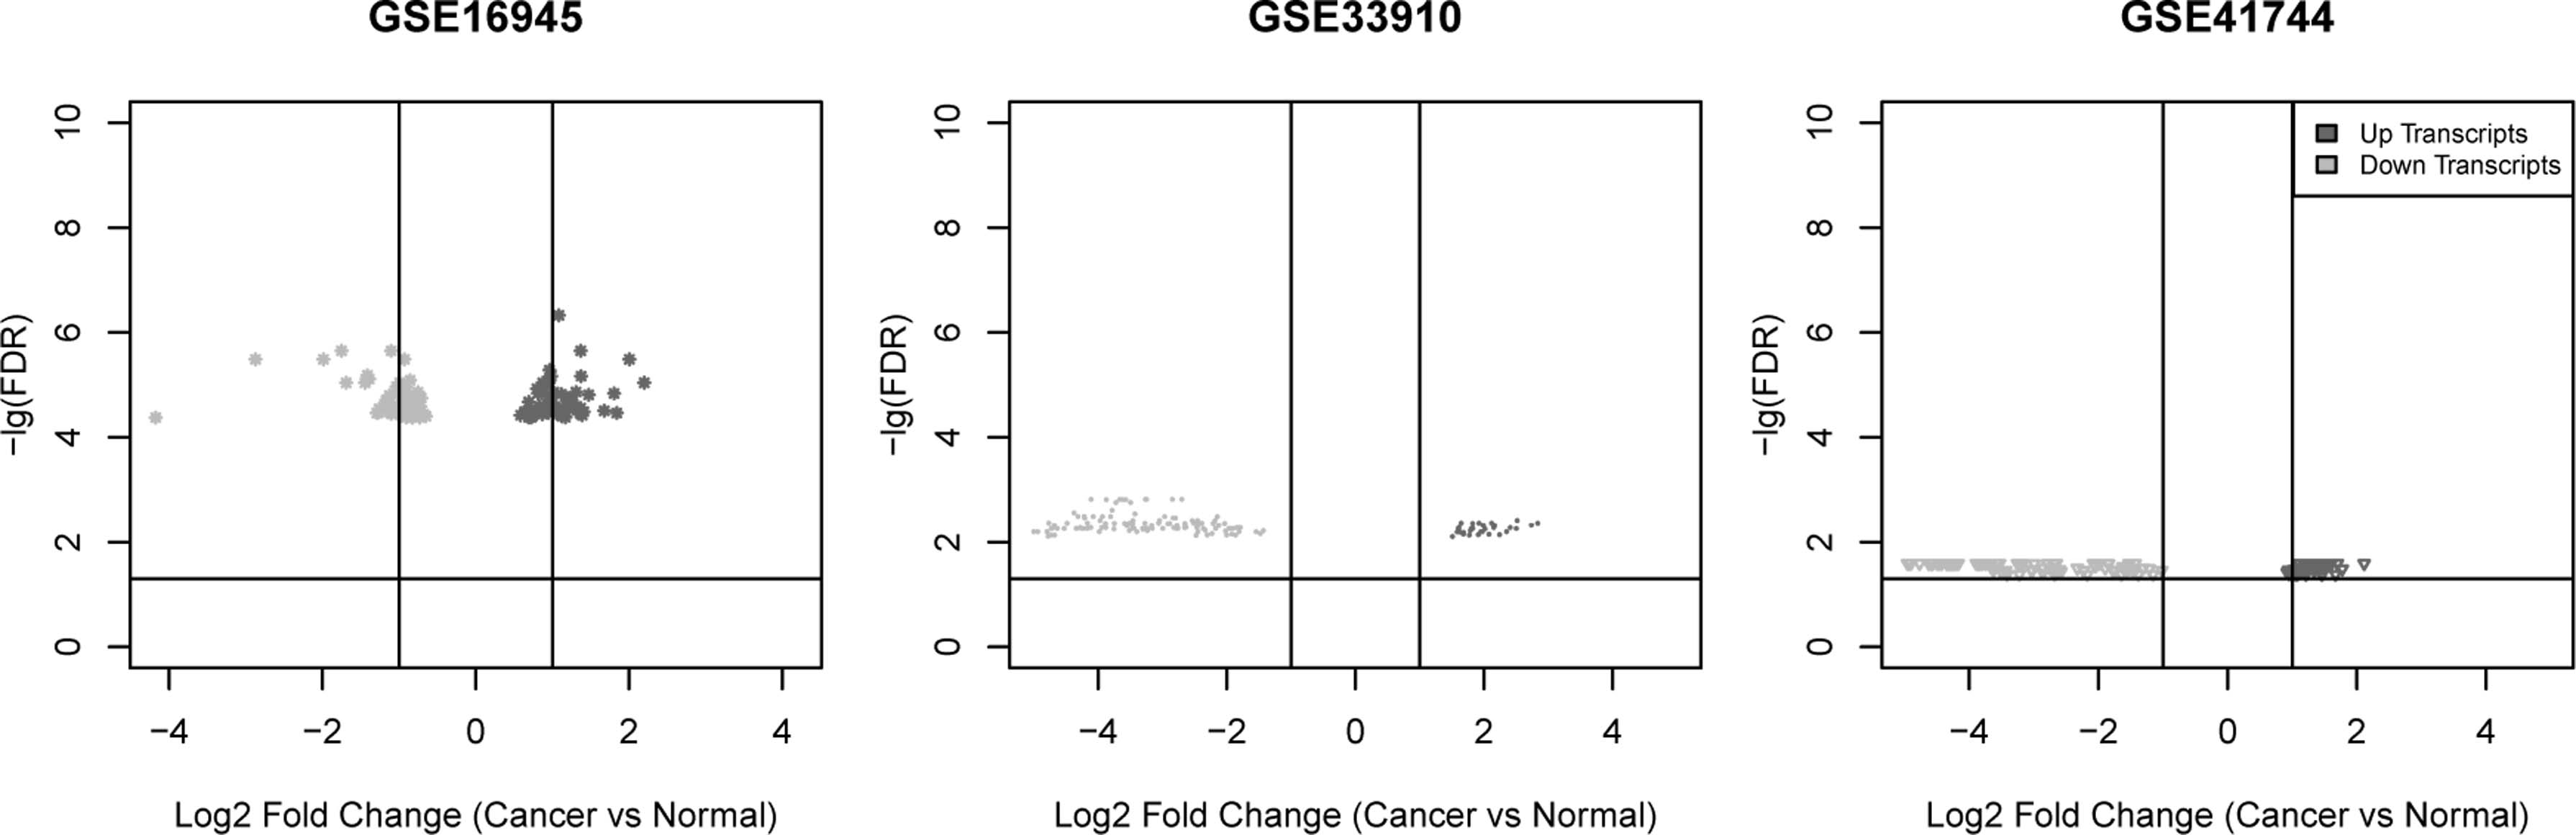
Volcano plots of DEGs. Vertical represents the value of Log2 fold change between cancer and normal samples and horizontal axis represents the value of −lgFDR. Red denotes up transcripts and green represents down transcripts. DEG, differentially expressed gene; FDR, false discovery rate.
GO enrichment analysis of DEGs revealed that upregulated DEGs were mainly concentrated on terms concerning the assembly of chromatin, endocrine regulatory systems containing negative regulation of insulin secretion, and negative regulation of peptide secretion, and immune response-related functions, such as regulation of response to wounding and lymphocyte proliferation (Table 1). For downregulated DEGs, remarkably, the significant enriched terms also contained immune responses such as natural killer cell activation and leukocyte-mediated immunity and cell killing (Table 1). Meanwhile, these downregulated DEGs also enriched in terms of nucleotide metabolism processes such as nucleobase-containing compound catabolic process and guanosine-containing compound metabolic process (Table 1).
Gene Ontology Terms for Up- and Downregulated Genes in Patients with Systemic Vasculitis
Gene Ontology Terms for Up- and Downregulated Genes in Patients with Systemic Vasculitis
Term: the name of GO; gene count: the number of DEG that were enriched in the specific term; p value: the significant measurements in enrichment process.
DEG, differentially expressed gene; GO, Gene Ontology.
In addition, the KEGG pathway analysis of upregulated GEGs demonstrated that the significantly enriched pathways included SLE, vascular smooth muscle contraction, and complement and coagulation cascades (Table 2). Of note, the consistently downregulated and 26 other genes with different expression direction did not enrich in any pathway.
Enriched Pathways for Upregulated Genes Systemic Vasculitis
Gene counts: the number of upregulated DEGs that were enriched in specific pathway; p value: the significant measurements in enrichment process.
KEGG, Kyoto Encyclopedia of Genes and Genomes; SLE, systemic lupus erythematosus.
The transcription factors and TAG from DEGs screened in our data set was detected. The results are given in Table 3, suggesting that four vital marked moleculars were screened including one upregulated transcription factor, one downregulated transcription factor, and a upregulated oncogene.
Function Statistics of Differentially Expressed Genes
Function Statistics of Differentially Expressed Genes
TAG, tumor-associated genes; TF, transcription factor.
To comprehend the functional interaction of DEGs, we constructed a PPI network based on the STRING database (Fig. 2). The top 10 gene nodes with higher degree included pro-platelet basic protein (PPBP; degree = 66), adenylate cyclase 4 (degree = 64), SWI/SNF-related, matrix-associated, actin-dependent regulator of chromatin, subfamily D, member 3 (degree = 51), Toll-like receptor 4 (degree = 46), histamine receptor H4 (degree = 43), plasminogen activator, urokinase (PLAU; degree = 43), endothelial PAS domain protein 1 (EPAS1; degree = 32), interleukin 23 subunit alpha (IL23A; degree = 28), monoamine oxidase A (degree = 28), and spectrin alpha, nonerythrocytic 1 (degree = 24), indicating these hub genes may play crucial roles in the development and progression of vasculitis and they were considered as important candidate genes in further investigations.

The protein–protein interaction network of DEGs. Red circular nodes represent significantly upregulated genes. The green circular nodes represent significantly downregulated genes. The yellow circular nodes represent non-DEGs.
Moreover, the transcriptional regulatory network of DEGs obtained was constructed according to the database regarding the relationship of transcription factors and their target genes. As given in Figure 3, there were 53 transcription factors enriched from 70 DEGs (Table 4). Furthermore, KEGG analysis of these DEGs indicated that these significant genes were implicated in autoimmune responses and cytokine receptor function.
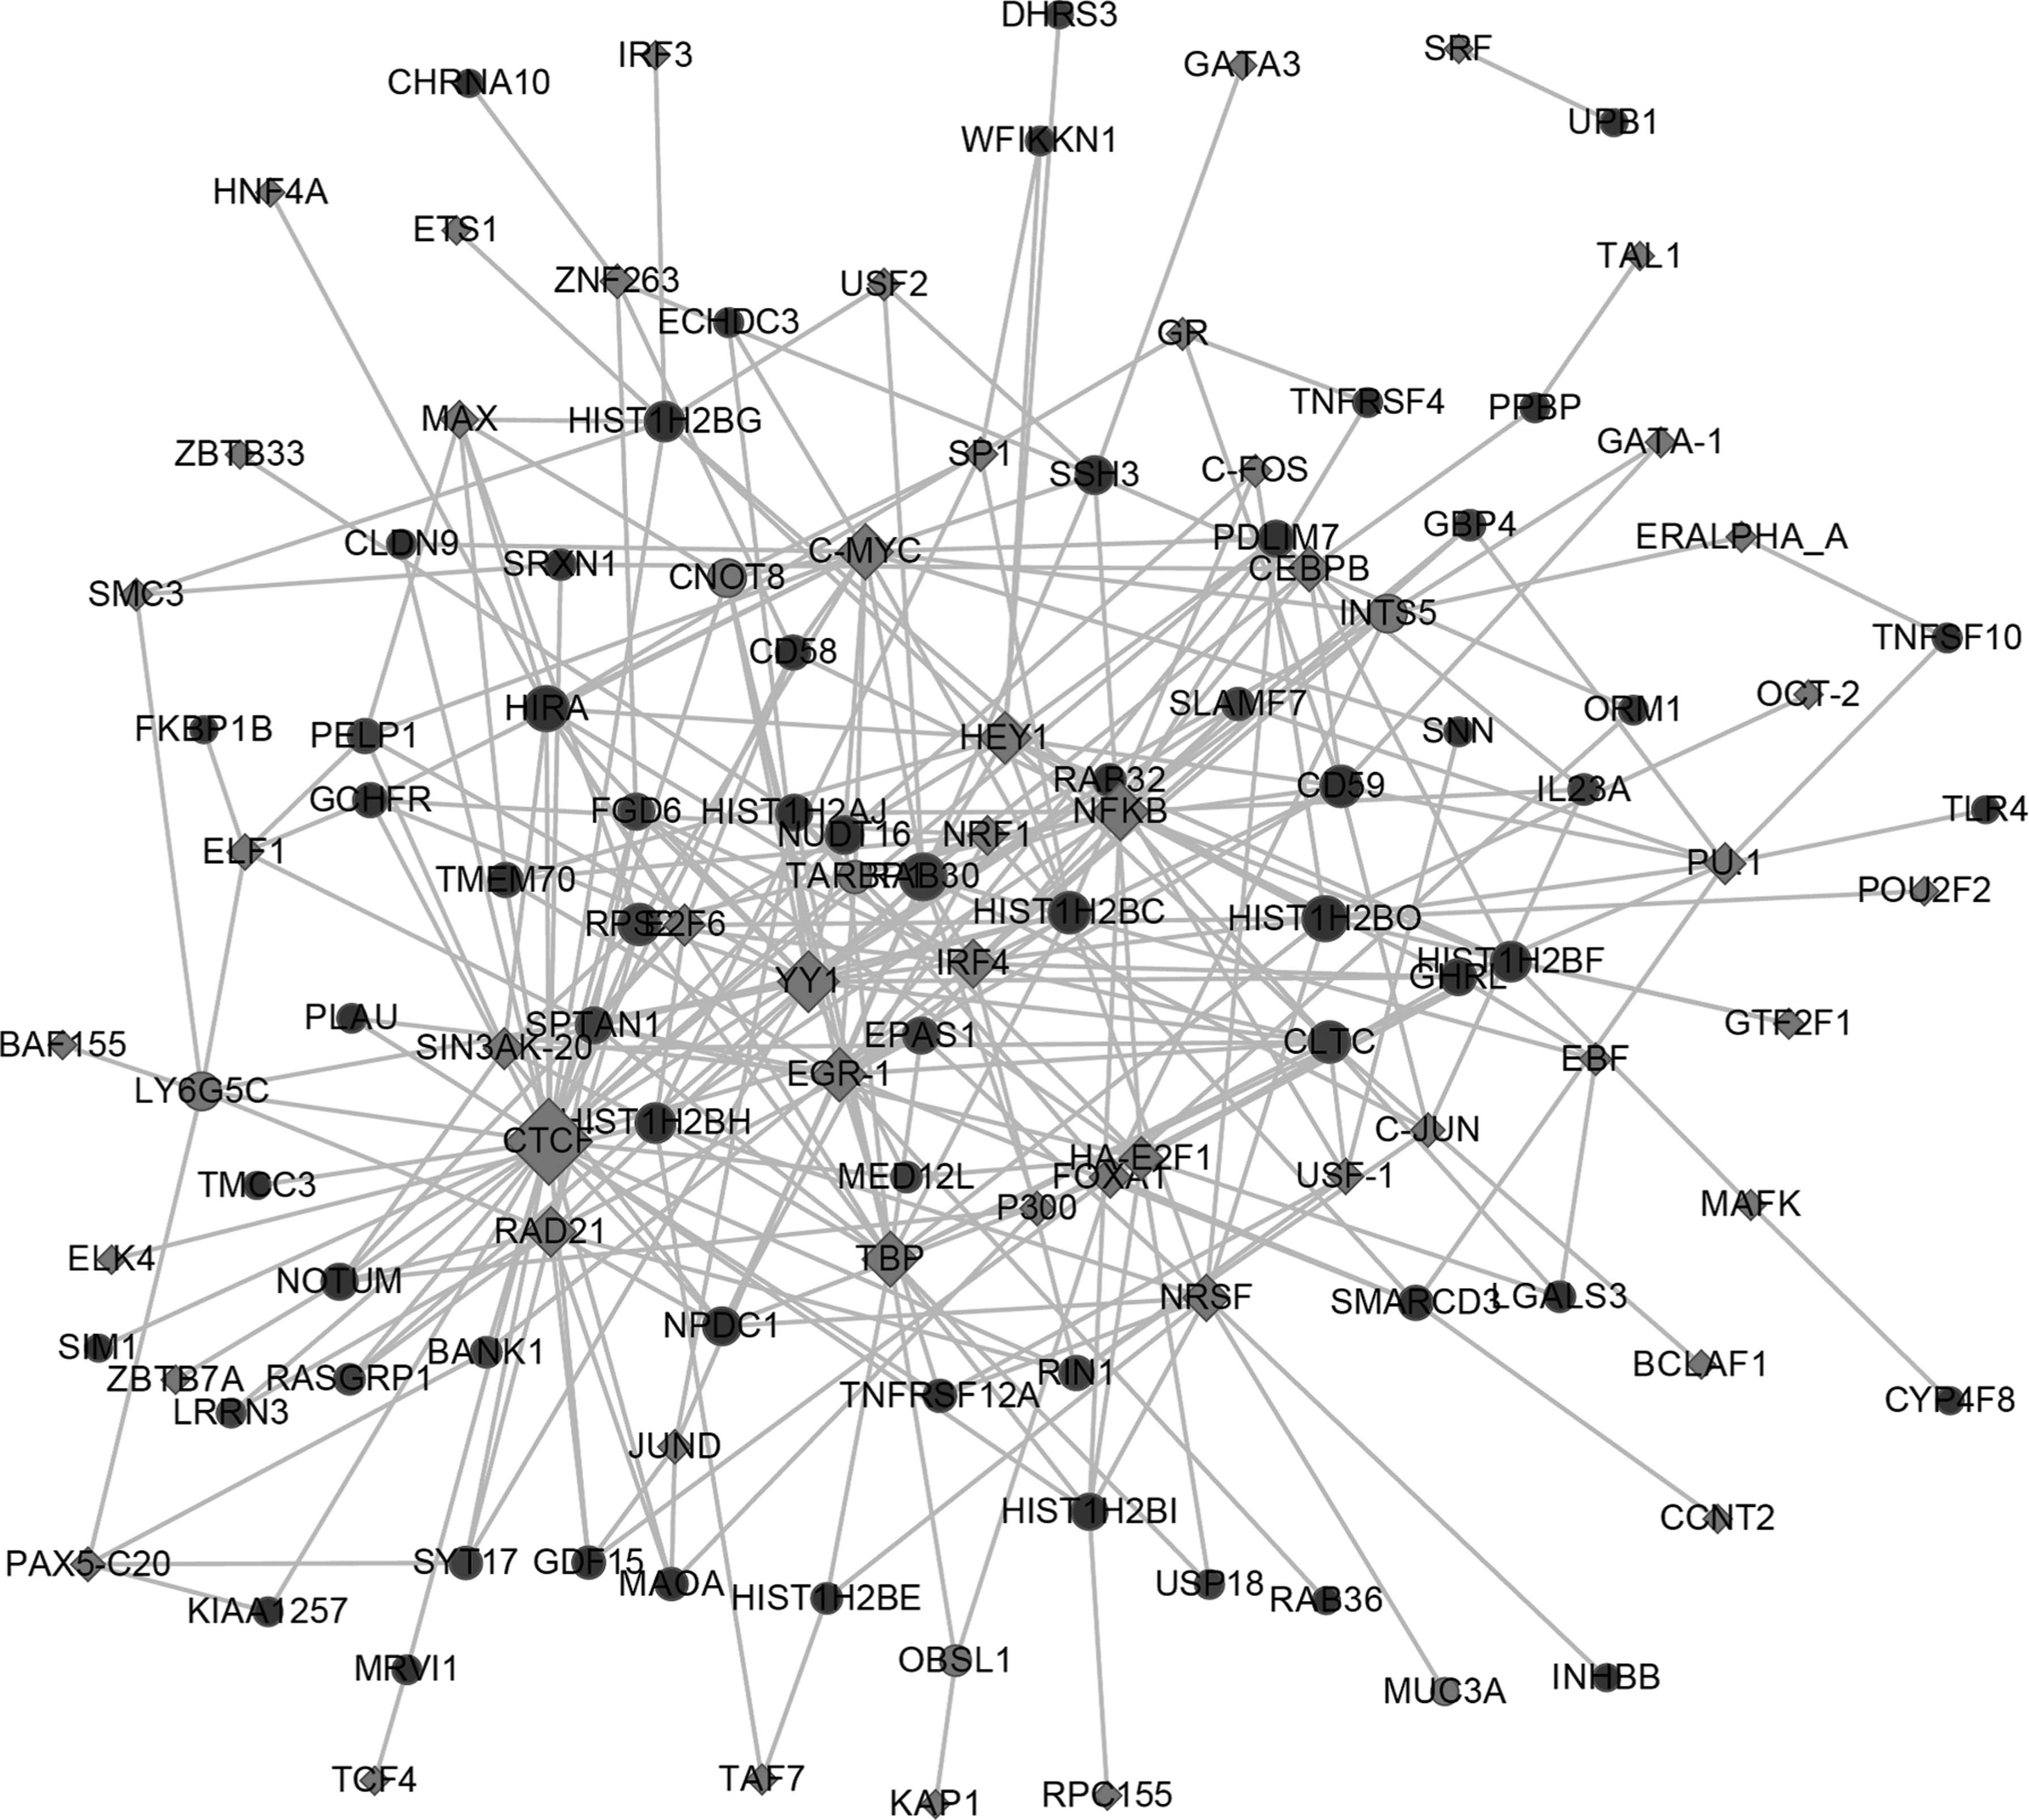
Transcriptional regulatory network. Yellow rhombi represent transcription factors; red circles represent upregulated genes, whereas green circles denote downregulated genes; the degrees indicate the number of target genes regulated by transcription factors.
Kyoto Encyclopedia of Genes and Genomes Pathways for Differentially Expressed Genes That Were Regulated by Transcription Factor
The microarray technology, in the past several decades, has been comprehensively applied in disclosing the potential etiological involvement of a substantial number of disorders, including cancers, cataract, diabetes, and cardiovascular diseases (Cui et al., 2016; Du et al., 2018; Shen et al., 2018; Tian et al., 2018). Moreover, the overwhelming evidence has demonstrated that powerful integrated bioinformatic analysis enables to gain a deeper insight and understanding of pathogenesis of complicate diseases (Li et al., 2018; Sun et al., 2018; Zhu et al., 2018). Although an increasing body of research has concentrated on exploring the occurrence mechanisms of angiitis, a systematic study still requires further investigation to decipher etiopathogenesis on this subject.
In this research, a meta-analysis of three microarray data sets from vasculitis was performed by two statistical methods (combined p value and combined effective size) with FDR <0.05 and p < 0.01. In total, 148 DEGs were subsequently identified, of which, 73 DEGs were steadily upregulated and 49 DEGs were steadily downregulated. In particular, 26 DEGs were expressed inconsistently compared with control groups, which can be explained by random factors such as various experimental processes and sample selection bias. The following functional enrichment analysis indicated that steadily upregulated DEGs were significantly enriched in pathways correlating with immune responses and vasculitis activities. We noted that a recent work demonstrated that immune responses caused by immunodeficiency were correlated with the microenvironment of the vessel wall (Zhang et al., 2018). Furthermore, a previous study examined that how the immune checkpoint pathways affects the progression of autoimmune vasculitis and suggested that some immune checkpoints involved in the development of vasculitis (Hid Cadena et al., 2018).
In addition, we found that these specific upregulated genes, including PPBP, PLAU, and EPAS1, showed higher degrees in PPI network. Xia et al. (2017) claimed that PPBP was also present in the immune response pathway according to their functional analysis. Therefore, we can speculate that PPBP served as a putative pathogenic gene is probably implicated in various immune responses to stimulate the development and progression of vasculitis. Functional enrichment analysis indicated that PLAU was strongly associated with complement and coagulation cascades pathway. Moreover, Acosta et al. (2004) implied that complement and coagulation cascades were responsible for a large number of vascular disorders such as vasculitis and vascular complications. We also observed that complement components were expressed during the involvement of vasculitis and promoted inflammation and vascular leakage based on a previous study (Karpman and Kahn, 2009). Sufficient evidence concerning PLAU, although, had not illuminated molecular mechanisms involved in vasculitis, it can be inferred that PLAU is possibly a new candidate gene in exploring pathogenetic mechanism of vasculitis according to our results.
In addition, alternative transcriptional regulatory network and functional analysis of DEGs enriched in transcription factors showed that IL23A and HIST1H2BH may play pivotal roles in the pathways of SLE and cytokine–cytokine receptor interaction. Of note, HIST1H2BH, another significantly upregulated gene, is primarily responsible for encoding histone proteins. Previous significant findings have demonstrated that SLE was characterized by the high vasculitis prevalence (Li et al., 2017). Meanwhile, it is reported that the clinical manifestations of SLE were predominantly concerned with inflammatory involvement of various sizes of vessels (Shor et al., 2016). Based on aforementioned investigations and findings, we supposed that altered expression of HIST1H2BH was extremely likely to influence vasculitis occurrence combined with the presence of SLE and established as a feasible gene signature for diagnosis and treatment of vasculitis.
Of interest, our results unraveled that downregulated DEGs did not appear in any pathway but enriched in terms of immune responses and nucleotide metabolism processes. We noticed that KEEG analysis of DEGs enriched in transcription factors illustrated that the downregulated IL23A gene, which was also presented with a higher degree in PPI network, focused on cytokine–cytokine receptor interaction pathway. Berti et al. (2018) stated that circulating cytokines played beneficial roles in pathogenesis of MPA patients. The heterodimeric cytokine IL23, which was encoded by IL23A, was able to enhance endothelial cell tube formation and promote tumor angiogenesis (Cai et al., 2016). Espigol-Frigole et al. (2018) argued that IL23A were related to the pathogenesis of vascular inflammation involved in large vessel vasculitis. Thus, IL23A was deduced as a potential therapeutic target for vascular diseases. What is noteworthy is that the cancer-related gene MRVI1 was screened based on the data sets concerning TS genes and TAG. In recent years a mountain of research showed that MRVI1 had association with a wide range of diseases containing cardiovascular disorders, coronary artery disease, and myocardial infarction (Webb et al., 2017; Wobst et al., 2018; Wu et al., 2018), but there is no correlative literature that implied this gene was associated with vasculitis.
Although several novel molecular makers and cancer-related genes have been identified in this study, the exhaustive regulatory mechanisms involved in different types of vasculitis needs further investigation and expatiation. Another weakness, at present, is the limited number of samples available, which only comprised three data sets associated with three categories of vasculitis. Therefore, an integrated microarray analysis with a larger sample size is required in future. Moreover, some experiments such as real-time quantitative polymerase chain reaction (qPCR) as well as in vitro and in vivo studies are also needed to validate our results. In addition, an alternative requirement is clinical evidence to be collected, further verifying the results analyzed by bioinformatic approaches.
Conclusion
In summary, several prominent biomarkers implicated in vasculitis has been extracted, including the upregulated PPBP, PLAU, and HIST1H2BH and downregulated IL23A gene, which will serve as novel therapeutic targets. Meanwhile, according to a combination of transcription factor identification and transcription regulatory network analysis, we found two transcription factor genes (EPAS1 and SIM1) and one oncogene, MRVI1, respectively. But the relationship between these promising target genes and vasculitis processes still needs to be elaborated. Furthermore, an integrated analysis based on a larger sample size and the corresponding verification experiments are thought to be carried out in the follow-up studies to clarify the underlying complicated nosogenesis of vasculitis.
Availability of Data and Material
The data sets used and analyzed during this study are available from the corresponding author on reasonable request.
Author's Contributions
M.W. participated in the design of this study, Y.Z. contributed to the acquisition of data, Z.S. contributed to the analysis and interpretation of data, L.T. performed the statistical analysis, X.Q. drafted the article. X.Y. and X.S. participated in the revision and editing of article. All authors read and approved the final article.
Footnotes
Author Disclosure Statement
The authors declare that they have no competing interests.