
Abstract
We aimed to investigate significant genes associated with diabetic nephropathy (DN), and their potential mechanisms in the process of DN pathogenesis. We downloaded the microarray data of GSE111154 from gene expression omnibus (GEO) database. First, we analyzed differentially expressed genes (DEGs) between early diabetic nephropathy (EDN) samples and nondiabetic control samples. Functional and pathway enrichment analysis was carried out. Disease-related gene sets were analyzed. Then, we constructed the protein–protein interaction (PPI) network and predicted the relation. Finally, transcriptional regulation analyses of microRNA and transcription factors were performed. Totally 554 DEGs between EDN samples and nondiabetic control samples were obtained. Enrichment analysis of disease-related gene sets showed that transforming growth factor beta 1 (TGFB1) was significantly enriched in DN. TGFB1 was involved in more pathways, such as proteoglycans in cancer, malaria, and amebiasis. Furthermore, TGFB1 had the highest degree in PPI network. In addition, TGFB1 was correlated with miR-21-5p, miR-146a-5p, and RAD21. TGFB1, miR-146a-5p, and miR-21-5p are important for DN development. Furthermore, TGFB1 may be involved in DN progression through the regulation of miR-21-5p, miR-146a-5p, and RAD21.
Introduction
Diabetic nephropathy (DN) is the chronic loss of kidney function happening in those with diabetes mellitus (DM) (Jun and Hirofumi, 2013). DN is one of main complications of DM (Gluhovschi et al., 2016). Abnormal characteristics of DN include glomerular hypertrophy, accumulation of extracellular matrix, expansion of mesangium, and glomerular basement membrane thickening (Wang et al., 2016). In hospitalized patients with diabetes, the prevalence of DN reaches about 30%–40% (Guariguata et al., 2014). DN is the main cause of renal failure worldwide (Vivekanand et al., 2013). However, effective methods to identify and inhibit the development of DN remain elusive (Simpson et al., 2016). Better understanding of the molecular mechanisms may provide clues for the finding of effective methods for DN.
Many molecules, such as microRNAs (miRNAs) and transcription factors (TFs), related with DN have been identified in the past years. For example, loss of miR-192 can promote fibrogenesis in DN (Aleksandra et al., 2010). Hou et al. (2016) suggested that miR-27a could promote renal tubulointerstitial fibrosis in DN by inhibiting PPARγ pathway. miR-184 can regulate albuminuria promoting renal fibrosis in DN rats (Zanchi et al., 2017). Furthermore, superoxide dismutase-1 allelic variations are related with the prevalence of DN (Mohammedi et al., 2011). Carnosine peptidase 1 gene was associated with DN in American Indians (Chakkera et al., 2011). In addition, specifically targeting TF activation and function may be applied to inhibit DN development (Sanchez and Sharma, 2009). Upstream stimulatory factor 1 is an important TF for the regulation of diabetic kidney disease (Sanchez et al., 2011). TF early growth response factor 1 may result in DN by enhancing extracellular matrix production and mesangial cells proliferation (Dan et al., 2015). However, the molecular mechanisms of DN remain unknown.
In this study, the microarray data of GSE111154 were applied to the analysis. First, differentially expressed genes (DEGs) analyses between early diabetic nephropathy (EDN) samples and nondiabetic control samples were carried out. Functional and pathway enrichment were analyzed. Disease-related gene sets were analyzed. Then, we analyzed protein–protein interaction (PPI) network and predicted the relation. Finally, transcriptional regulation analyses of miRNA and TFs were performed. We aimed to investigate significant genes associated with DN, and their potential mechanisms in the process of DN pathogenesis.
Materials and Methods
Microarray data
We downloaded the microarray data of GSE111154, including EDN samples (n = 4) and nondiabetic control samples (n = 4), from the National Center for Biotechnology Information (NCBI) gene expression omnibus (GEO) database (Tanya et al., 2013). The platform was GPL17586 [HTA-2_0] Affymetrix Human Transcriptome Array 2.0. We downloaded the latest chip probe annotation data HTA-2_0 Transcript Cluster Annotations, CSV, Release 36 (55 MB, 7/31/18) from Affy official website (www.affymetrix.com/index.affx).
DEGs analysis
The original CEL data were read using Puma (Pearson et al., 2009) in R and Oligo software (Carvalho and Irizarry, 2010). Background adjustment, quantile normalization, and final summarization were performed for all probe expression data by robust multiarray average method (Irizarry et al., 2003). DEGs analysis (END vs. control) was conducted using limma package (Smyth, 2011) in R software. The threshold value was p value <0.05 and |log fold change (FC)|>0.3. Furthermore, the probe was annotated using the downloaded annotation information.
Functional and pathway enrichment analyses
Gene Ontology (GO), which includes biological process (BP), molecular function (MF), and cellular component (CC), can be applied to annotate genes, gene sequences, and products (The Gene Ontology Consortium, 2006). Kyoto Encyclopedia of Genes and Genomes (KEGG) is a database used for systematically analyzing gene functions (Kanehisa and Goto, 2000). GO and KEGG pathway enrichment for DEGs were analyzed by clusterProfiler (Yu et al., 2012). p Value <0.05 was regarded as significantly enriched results. For the obtained GO results, we used simplify to filter out redundant and similar GO terms.
Enrichment analysis of disease-related gene sets
DisGeNET database (www.disgenet.org/web/DisGeNET/menu/home) contains and integrates multiple platforms of genes and mutation sites related to human diseases (Pinero et al., 2017). All gene–disease associations in the database were obtained. All genes in the chip were sequenced according to logFC, and then gene set enrichment analysis was conducted in DN. Disease-related gene sets were identified and significant DEGs were regarded as core genes associated with disease.
PPI network analysis and relation prediction
STRING online tool was applied for PPI network analysis (Damian et al., 2015). Medium confidence (combined score) >0.7 was treated as threshold value of PPI. Cytoscape (Shannon et al., 2003) was applied to construct the network, and the network topology was analyzed. According to the rank of network connectivity, the important nodes in PPI network were obtained. Higher connectivity of nodes represented more important locations in the network, and these nodes were more likely to be key nodes.
Transcriptional regulation analysis of miRNA and TFs
According to ENCODE chip-seq data in Enrichr database (Chen et al., 2013), TFs regulating disease-related key genes were analyzed. The results with p value <0.01 were screened. According to miRTarBase data in Enrichr database (Chen et al., 2013), miRNAs of disease-related genes were predicted. The results with p value <0.01 were screened. In addition, the network was constructed using Cytoscape.
Results
DEGs analysis
After screening, 554 DEGs (182 downregulated and 372 upregulated) between EDN samples and nondiabetic control samples were obtained. Volcano plot for DEGs is presented in Figure 1.
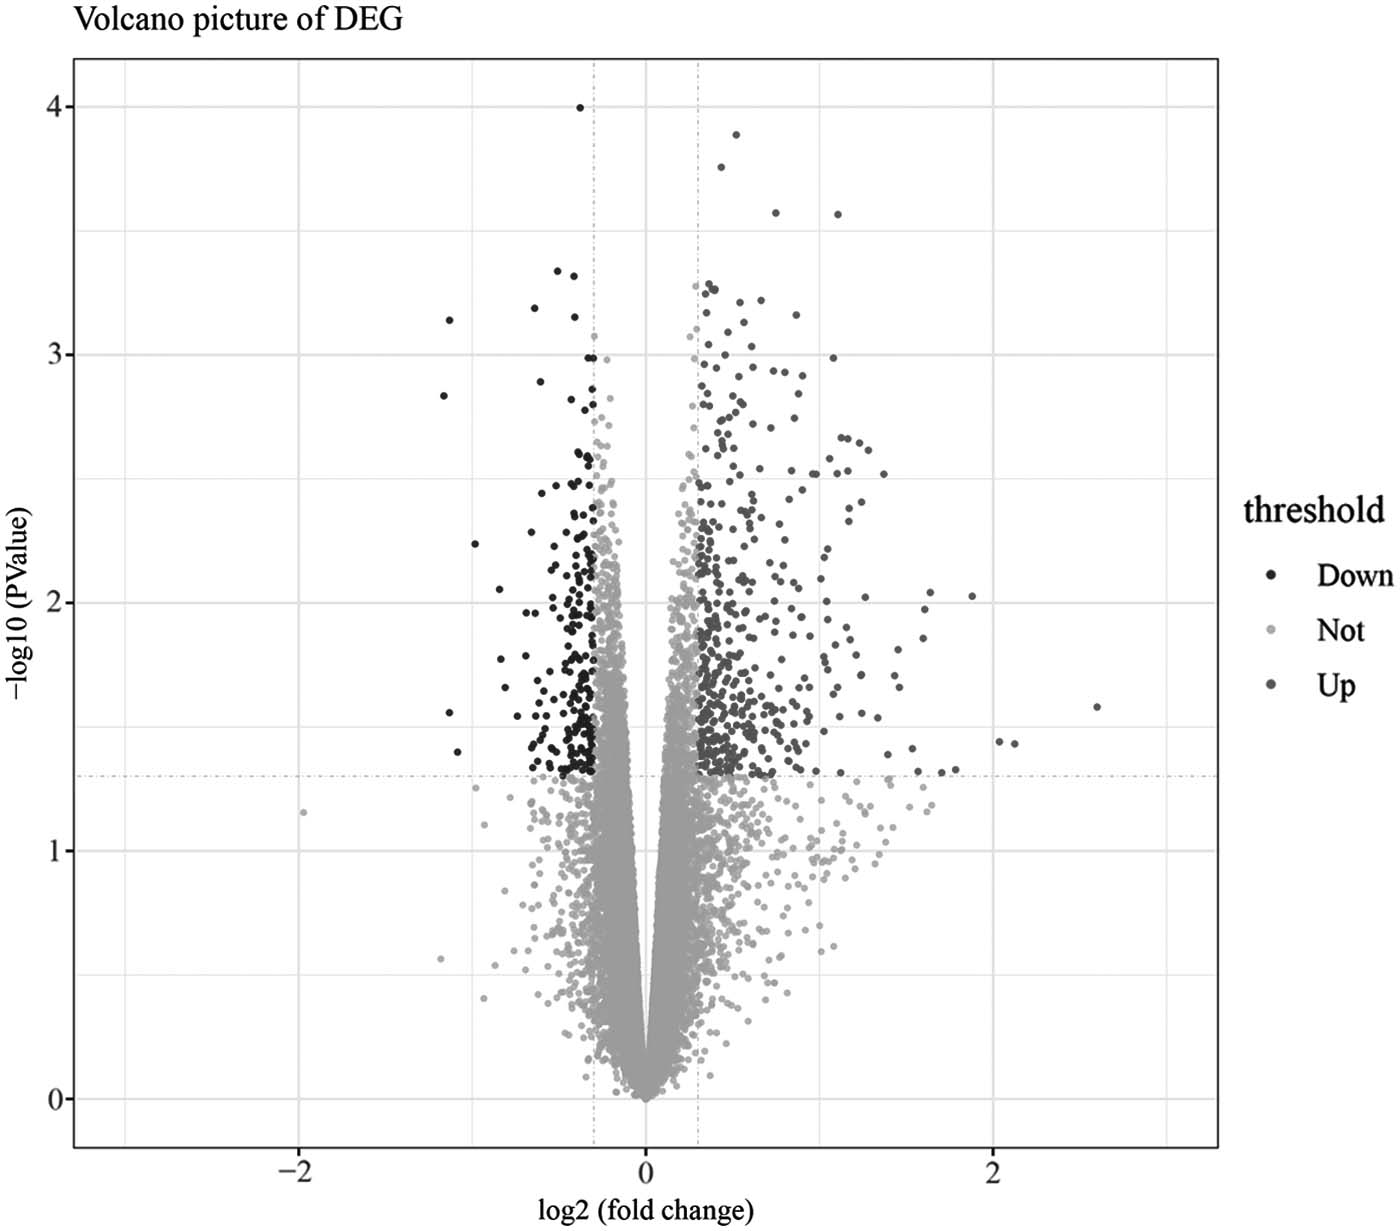
Volcano plot for DEGs. Dark grey dots: upregulated genes; black dots: downregulated genes. DEG, differentially expressed gene.
Results of GO and KEGG pathway enrichment were obtained. As shown in Figure 2, extracellular structure organization was the most significantly enriched GO–BP term; extracellular matrix and proteinaceous extracellular matrix were significantly enriched GO–CC terms; glycosaminoglycan binding and sulfur compound binding were significantly enriched GO–MF terms; the significantly enriched pathways for all DEGs were focal adhesion, complement and coagulation cascades, and dilated cardiomyopathy.
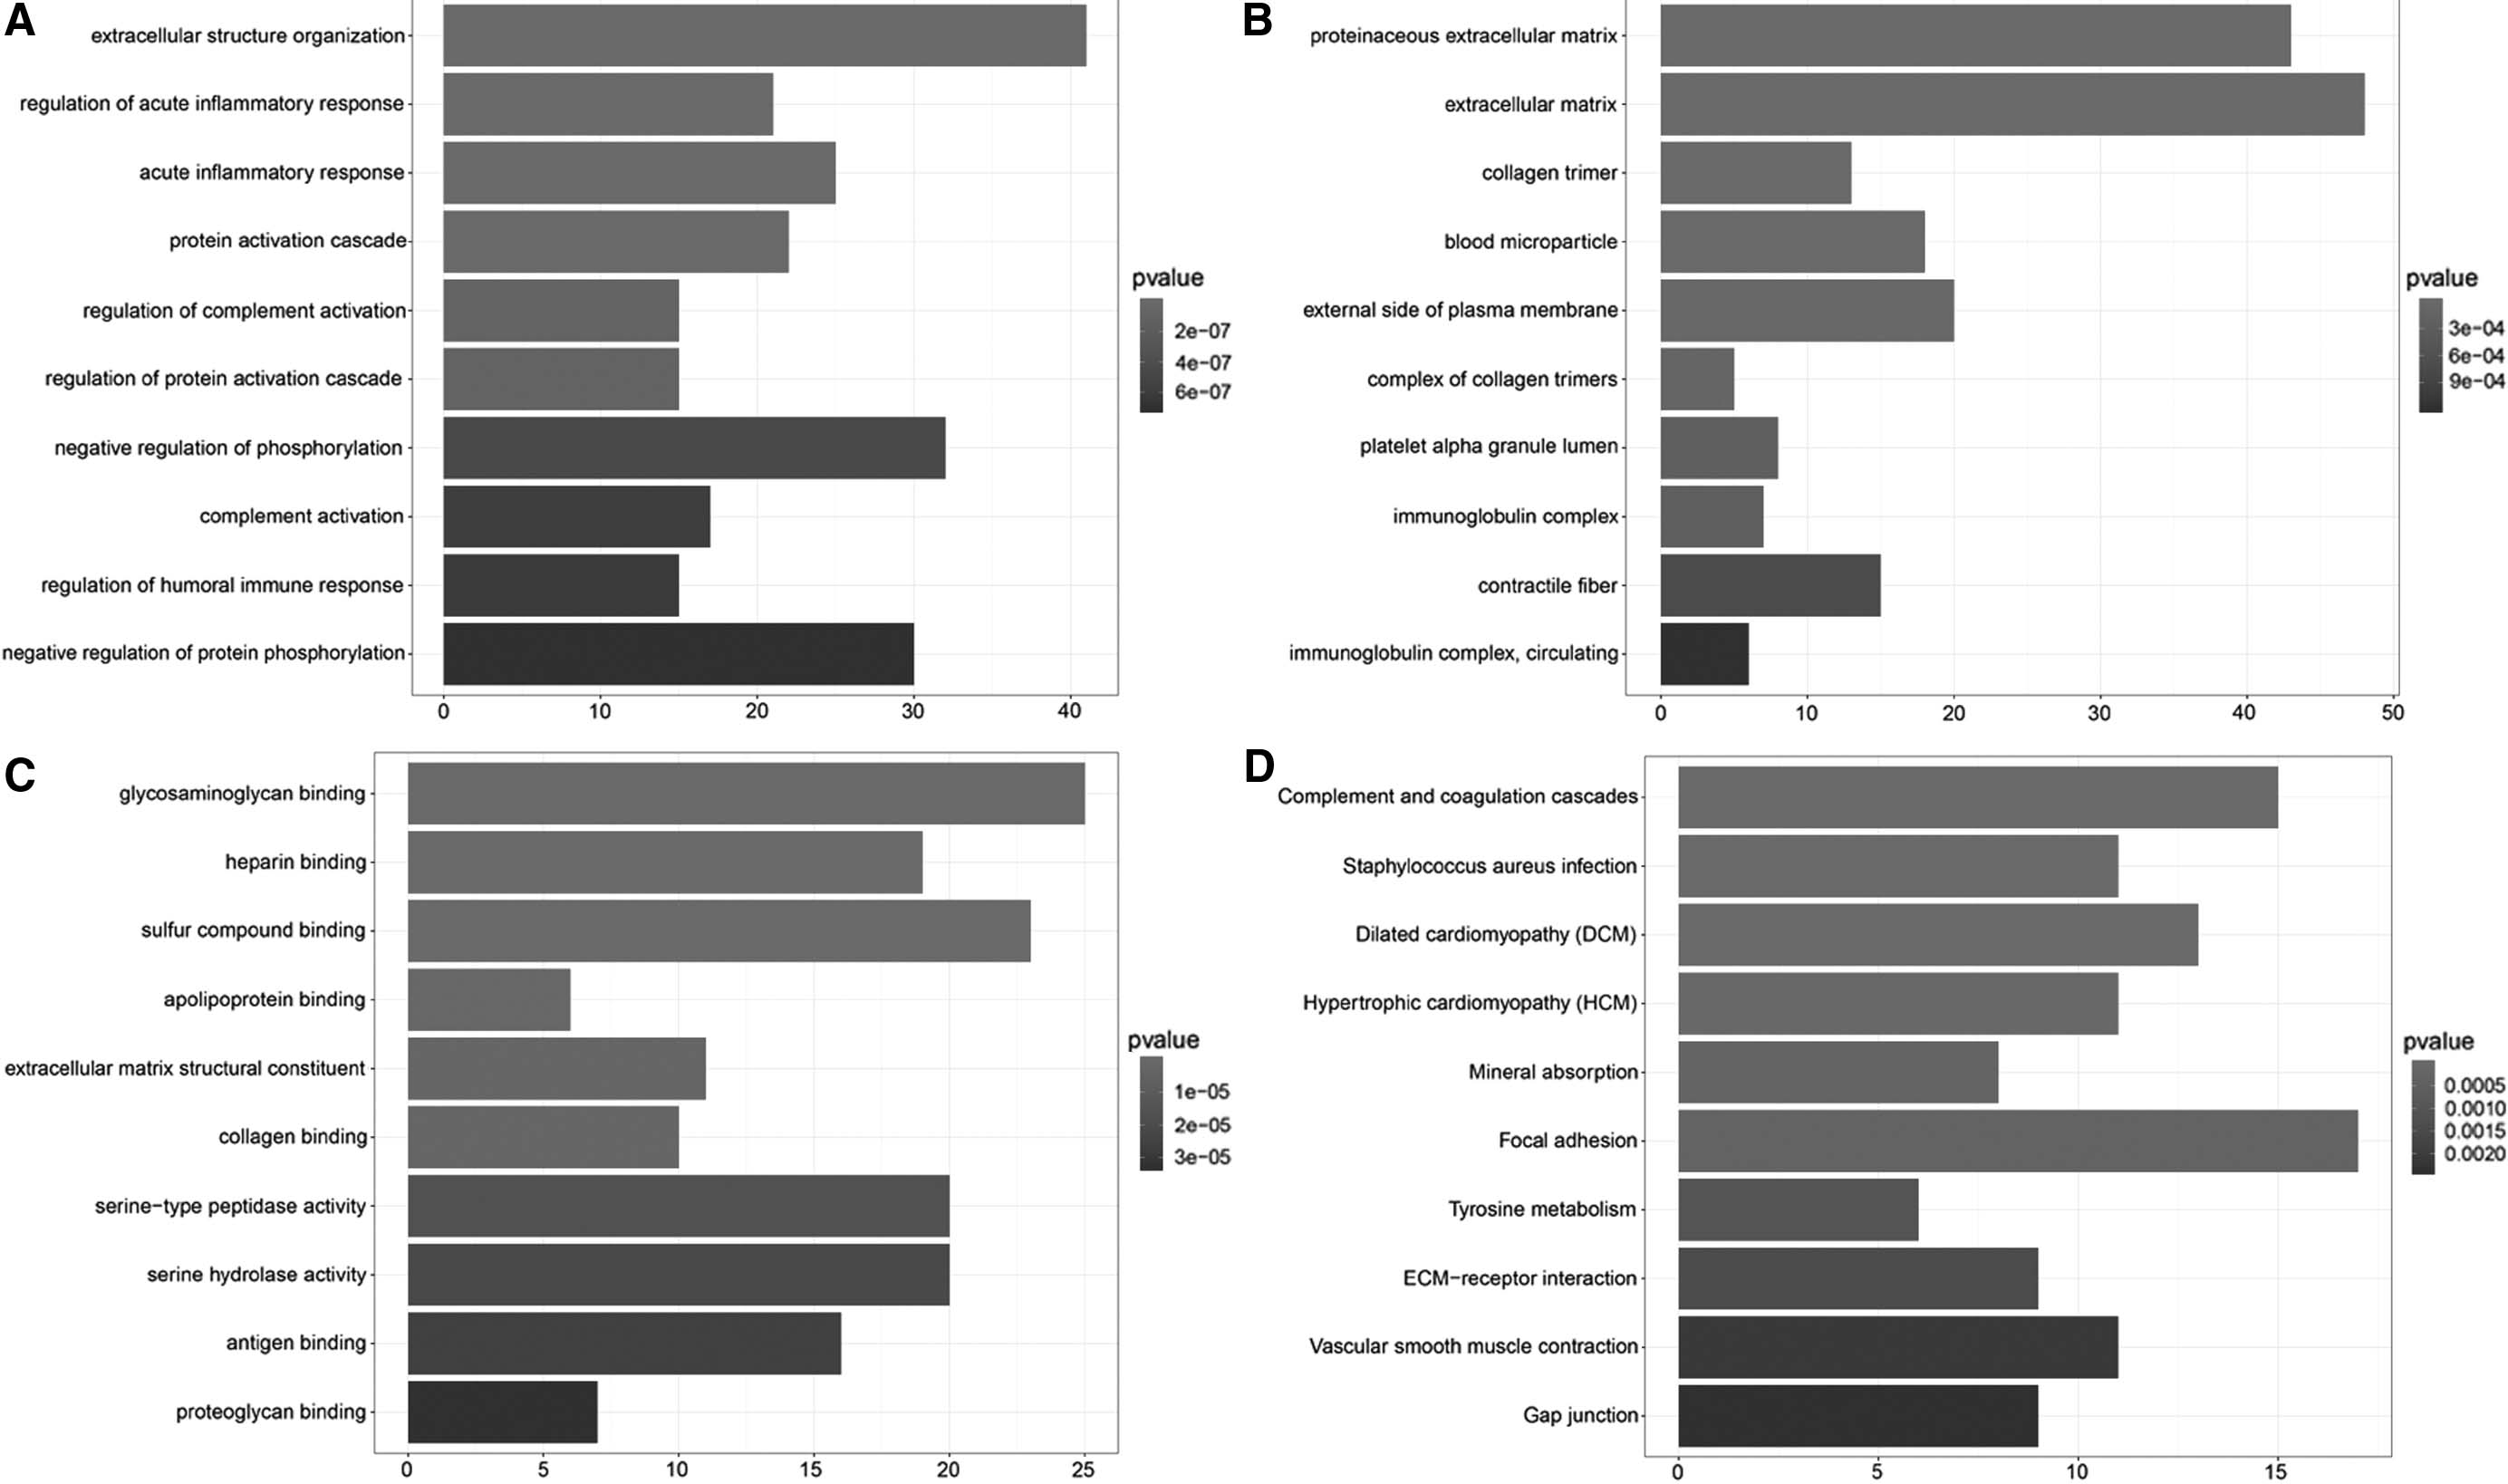
GO and KEGG pathway enrichment results for all DEGs.
As presented in Table 1, 124 genes [e.g., transforming growth factor beta 1 (TGFB1), integrin subunit alpha 1 (ITGA1), and von Willebrand factor (VWF)] were significantly enriched in DN. These genes were core genes and all of them were upregulated. In addition, 32 of these genes were significantly upregulated. The associations between 32 genes and disease in the DisGenet database were obtained. Gene-pathway diagrams for these 32 genes are presented in Figure 3. It showed that TGFB1 was involved in proteoglycans in cancer, malaria, amebiasis, AGE-RAGE signaling pathway in diabetic complications, relaxin signaling pathway, inflammatory bowel disease, renal cell carcinoma, and leishmaniasis. Furthermore, proteoglycans in cancer was enriched by seven genes.
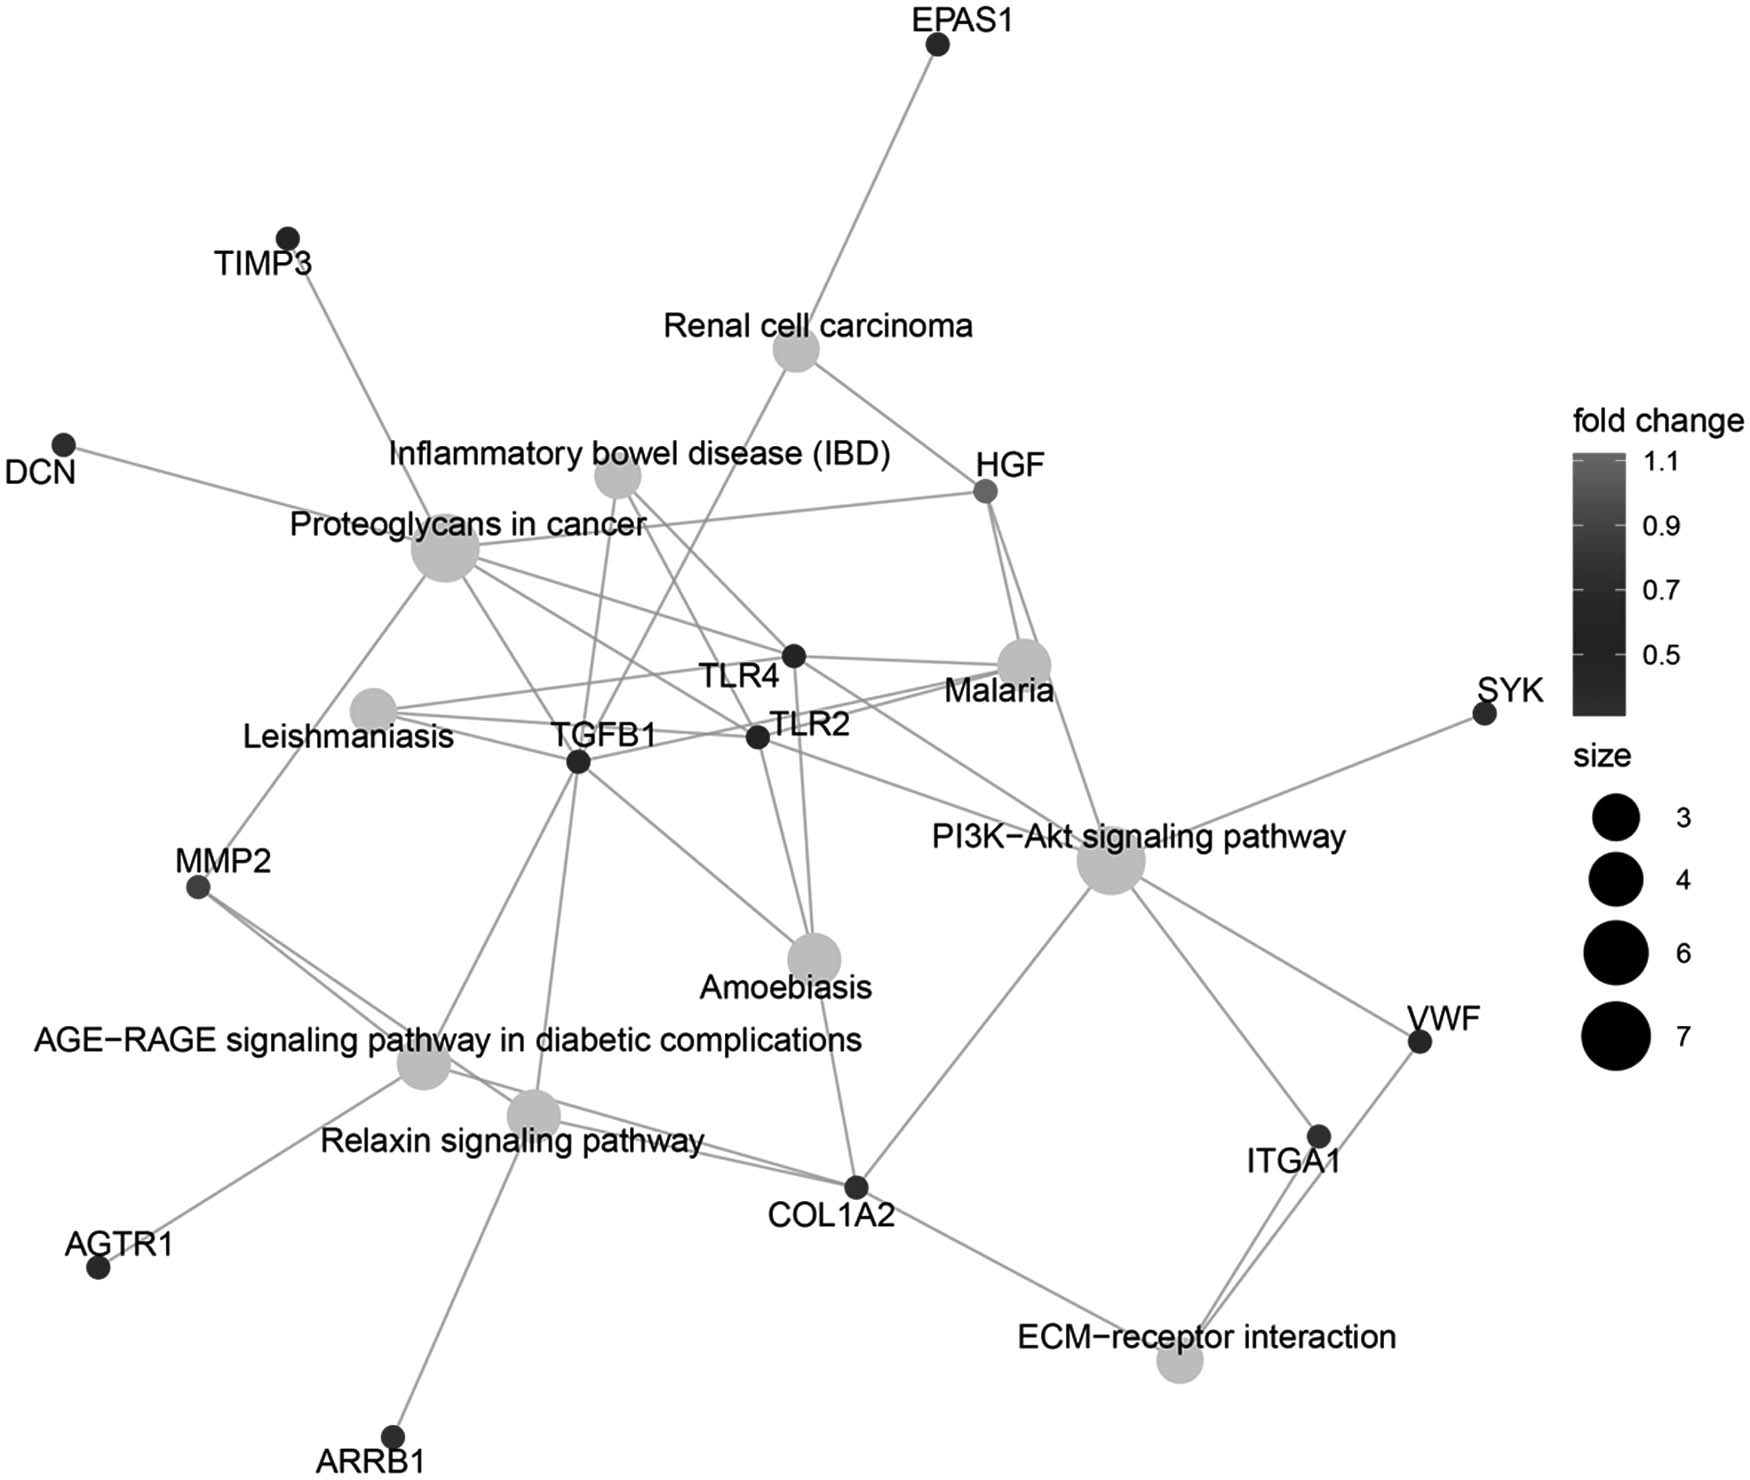
Gene-pathway diagrams for the 32 genes. Light grey dots: enriched pathways, the size of the dots was associated with the number of enriched genes; dots of other colors: core genes, the color of these dots were related with fold change.
Gene Sets Enrichment Analysis Results That Enriched in Diabetic Nephropathy
Enrichment score: defined as the maximum peak. Positive value represents that the gene set is enriched at the top of the list (upregulated genes); negative value represents that the gene set is enriched at the bottom of the list (downregulated genes).
p value: p value after permutation test; adj. p: p value after adjustment; core_enrichment: core genes that contribute most to enrichment scores.
There were 203 nodes and 416 relation pairs in PPI network (Fig. 4). Key nodes in the network were analyzed, and the top 10 nodes with the highest connectivity score were TGFB1 (degree = 19), ITGA1 (degree = 16), VWF (degree = 16), adenylate cyclase 3 (ADCY3, degree = 16), lysophosphatidic acid receptor 1 (LPAR1, degree = 15), annexin a1 (ANXA1, degree = 15), collagen type I alpha 2 chain (COL1A2, degree = 13), decorin (DCN, degree = 13), hepatocyte growth factor (HGF, degree = 12), and TIMP metallopeptidase inhibitor 3 (TIMP3, degree = 12).
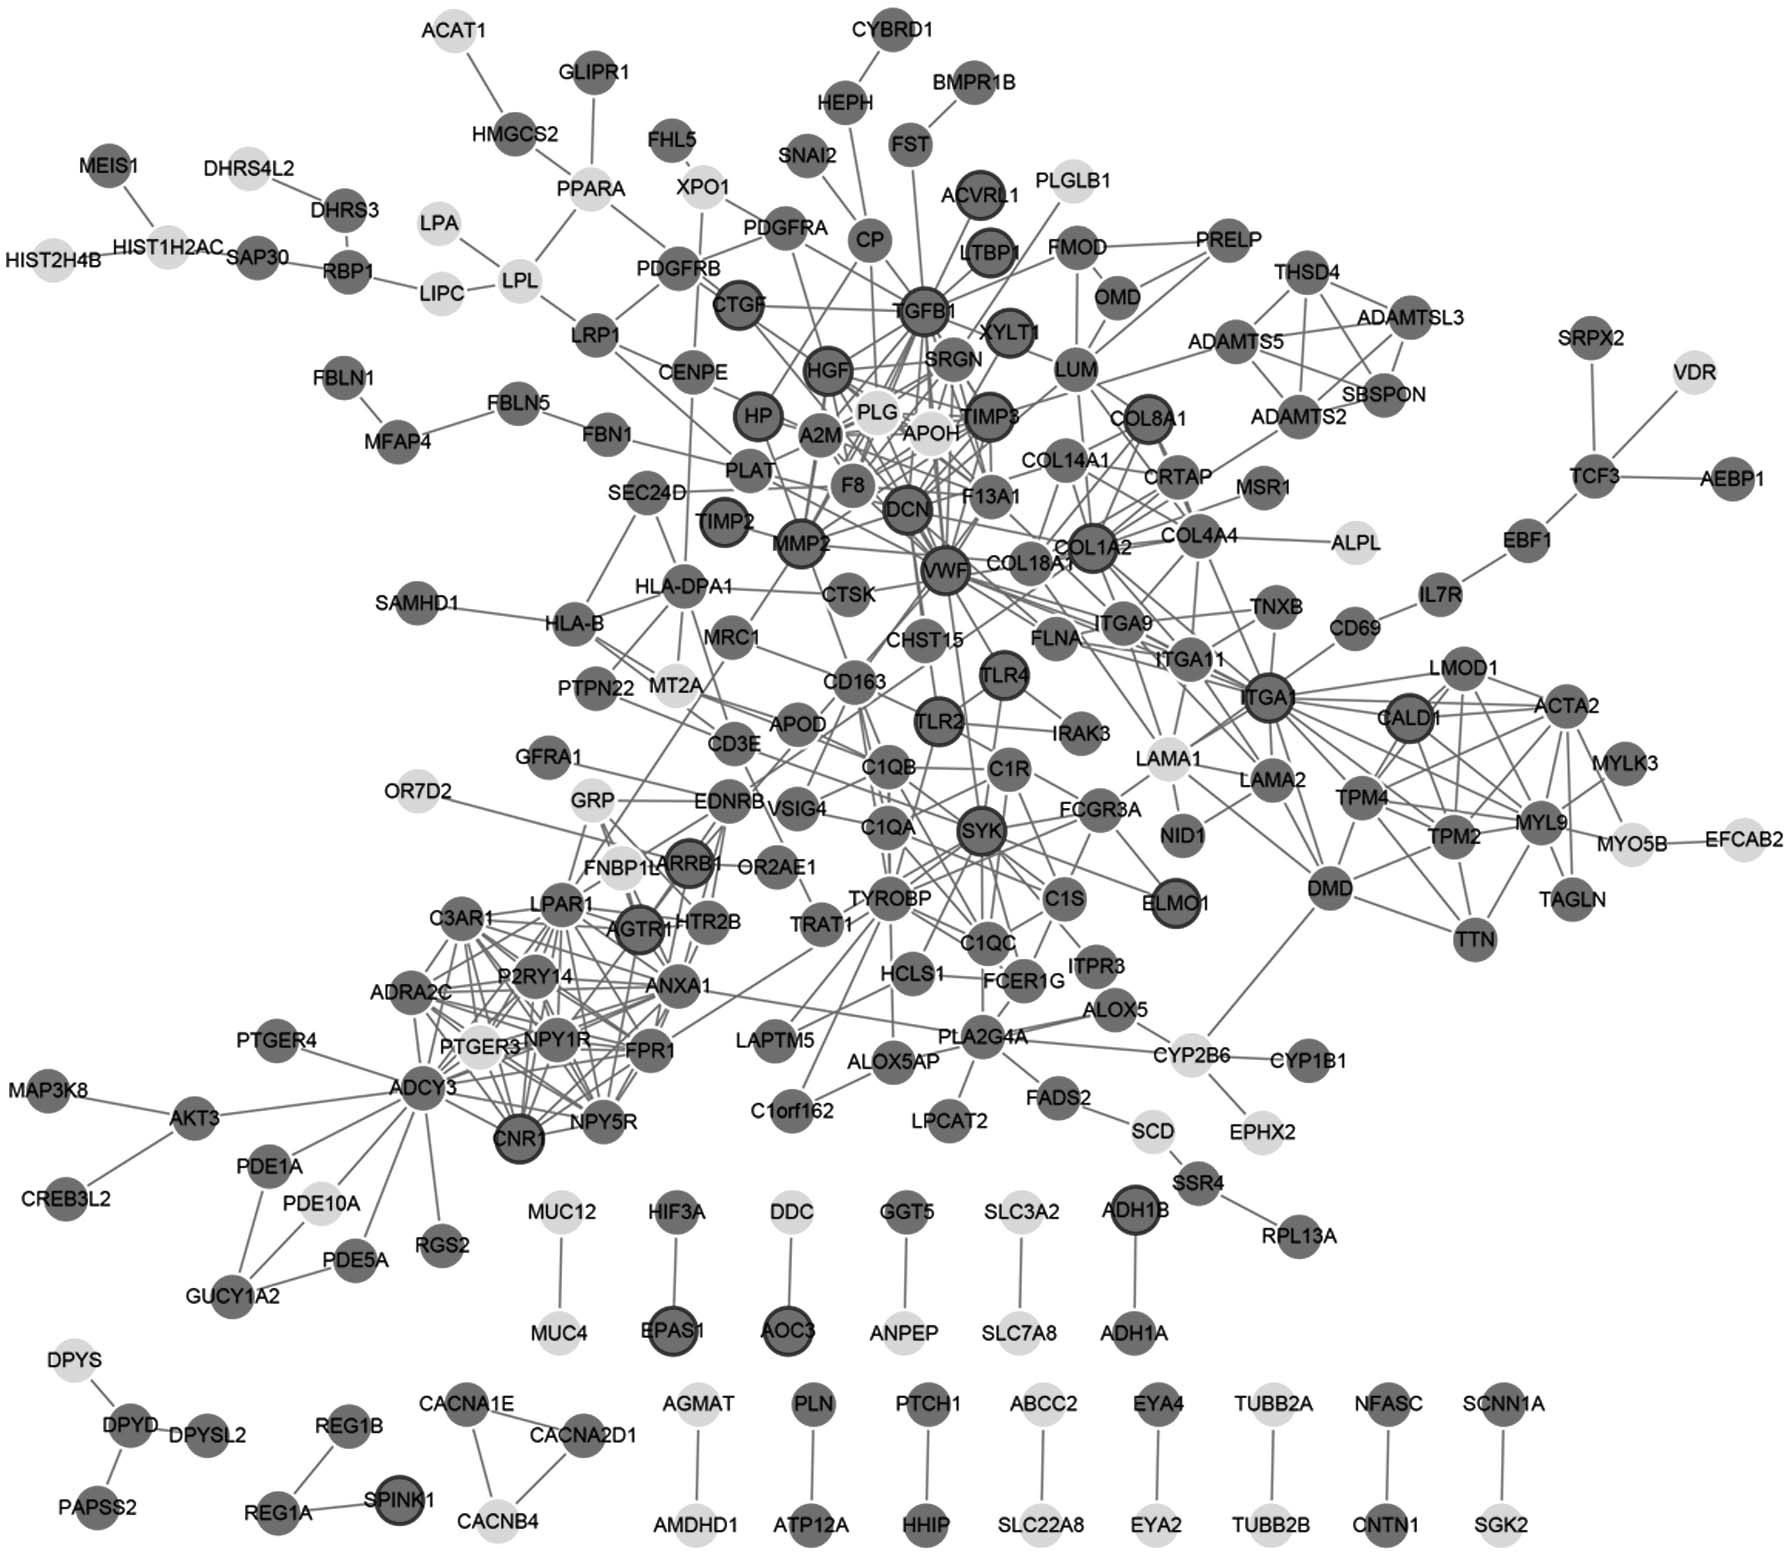
PPI network for DEGs. Dark grey circular node: upregulated genes; light grey circular node: downregulated genes; nodes with ring: significantly differential expression of disease-related core genes in the previous analysis. PPI, protein–protein interaction.
The results of miRNA/TFs regulating DEGs are presented in Table 2. The miRNA/TF-gene network is shown in Figure 5. TGFB1 was correlated with two miRNAs (miR-21-5p and miR-146a-5p) and one TF (RAD21 cohesin complex component [RAD21]).
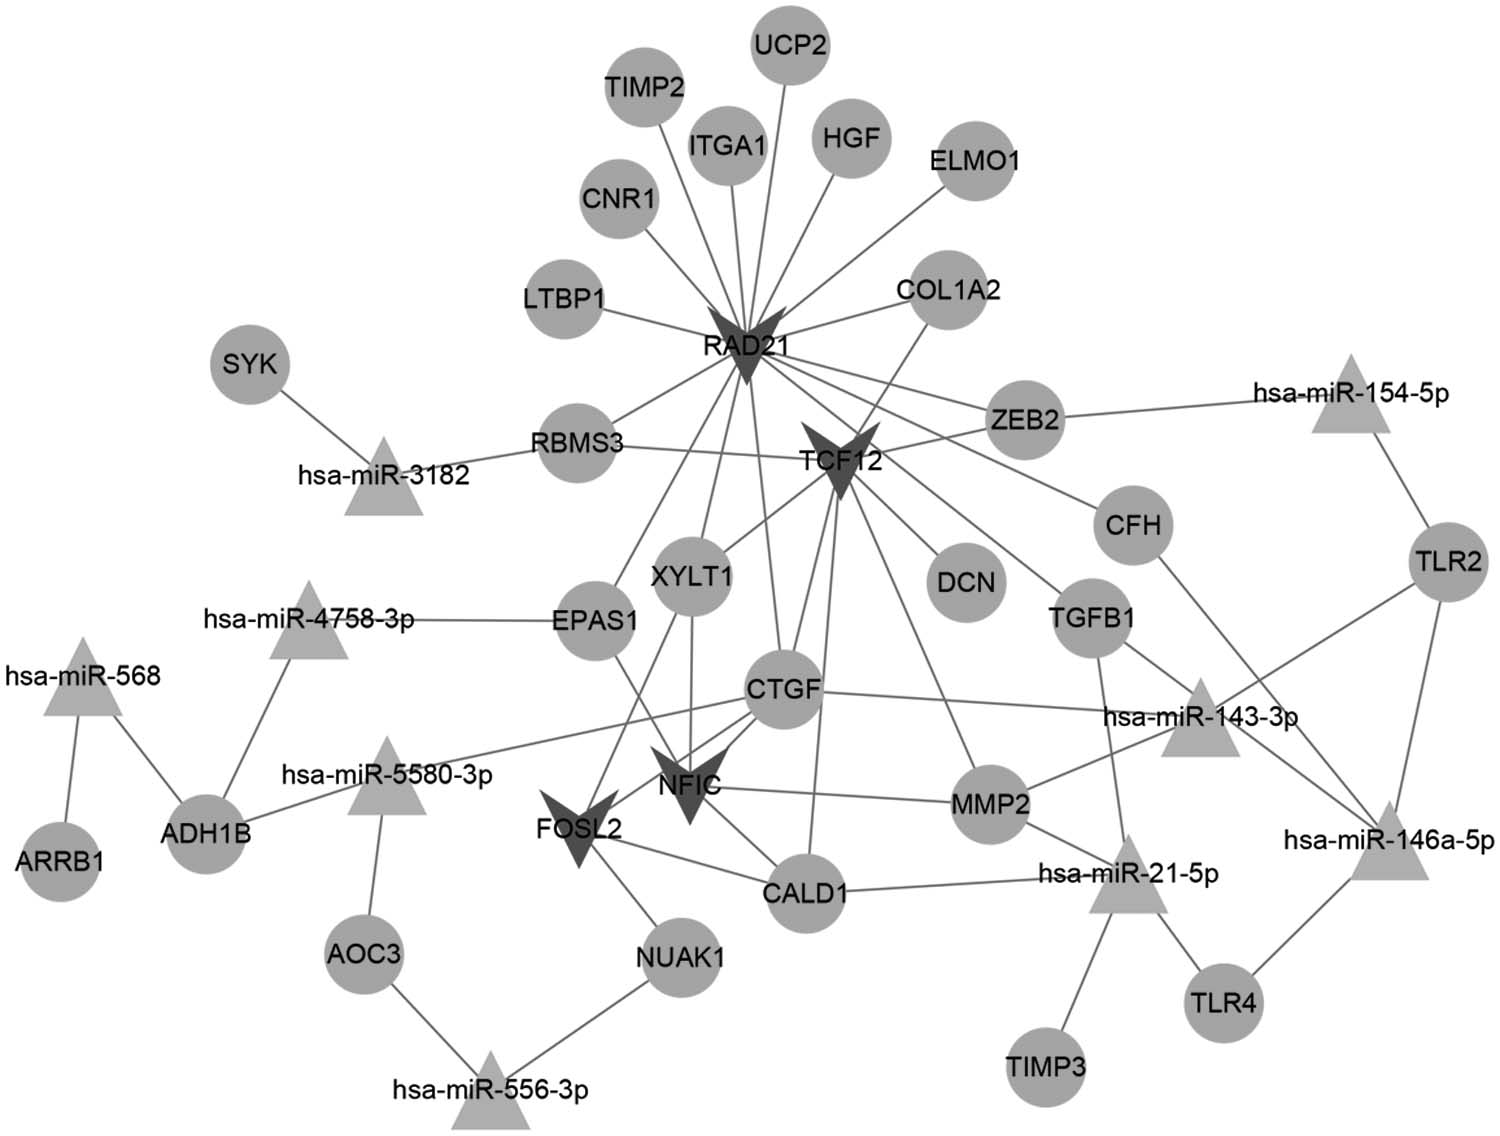
The miRNA/TF-gene network. Circular node: genes; “V” nodes: TF; triangle: miRNA. TF, transcription factor.
The Results of MicroRNA/Transcription Factors Regulating Differentially Expressed Genes
RAD21: chip-seq prediction results from two different cell lines.
As one of the most serious complications of diabetes (Yan and Choi, 2015), the effective treatment of DN are urgently needed. In this study, 554 DEGs between EDN samples and nondiabetic control samples were obtained. Enrichment analysis of disease-related gene sets showed that TGFB1 was significantly associated with DN. TGFB1 was involved in more pathways, such as proteoglycans in cancer, malaria, and amebiasis. Furthermore, TGFB1 had the highest degree in PPI network. In addition, TGFB1 was correlated with miR-146a-5p, miR-21-5p, and RAD21.
TGFB1, a polypeptide member of the TGFB superfamily of cytokines, plays a role in cell differentiation and proliferation (Poshala et al., 2009). Metwally et al. (2005) showed that decreasing TGFB1 expression might have therapeutic effects on diabetics. Hathaway et al. (2015) indicated that low expression of TGFB1 prevented DN and high expression of it exacerbated this disease. TGFB1 and monocyte chemoattractant protein-1 may be regarded as prognostic markers for DN (Shaker and Sadik, 2013). Shaker et al. (2014) suggested that TGFB1 in serum and urinary could be applied as biochemical markers in DN patients. In this study, enrichment analysis of disease-related gene sets showed that TGFB1 was significantly enriched in DN. TGFB1 was involved in more pathways than other genes, and TGFB1 had the highest degree in PPI network. Thus, our study further illustrates the important roles of TGFB1 in DN.
It was reported that miR-146a played anti-inflammatory roles in the pathogenesis of DN (Bhatt et al., 2015). The experiment of Wan and Li (2018) showed that miR-146a might play antioxidative and anti-inflammatory roles in DN. Kaidonis et al. (2016) indicated that a single-nucleotide polymorphism in miR-146a (rs2910164) was related with DN. Inhibition of miR-21 may be helpful for the effective treatment of DN (Zhong et al., 2013). Serum miR-21 may be applied for the diagnosis of DN (Wang et al., 2015). The data of Zou et al. (2013) suggested that miR-21 was involved in renal fibrosis through MMP9/TIMP1. In addition, RAD21 is involved in the process of apoptosis (Debananda et al., 2002). For patients with proteinuric type II diabetes, apoptosis may be critical for glomerular and tubular cell loss (Verzola et al., 2007). Apoptosis is one type of cell death, and it is thought that cell death plays a role in progressive renal cell depletion in DN (Maria-Dolores et al., 2010). Thus, RAD21 may play roles in DN.
Although some previous studies have reported the roles of TGFB1, miR-146a-5p, miR-21-5p, and RAD21 in DN, respectively, the correlations in DN between these genes are not described. In this study, transcriptional regulation analysis showed that TGFB1 was correlated with miR-146a-5p, miR-21-5p, and RAD21. Since these genes are associated with the development of DN, we propose that TGFB1 may be involved in DN progression through the regulation of miRNAs—miR-21-5p and miR-146a-5p, and TF-RAD21.
However, some limitations existed in this study. For example, the results were not verified by the experiments. The size of the samples applied for this analysis was small. Thus, further studies with more samples and verifications are needed in future.
In summary, TGFB1, miR-21-5p, and miR-146a-5p are important for the DN development. Furthermore, TGFB1 may be involved in DN progression through the regulation of miR-21-5p, miR-146a-5p, and RAD21. Owing to the mentioned limitations of this study, further studies are needed.
Footnotes
Acknowledgments
This study was supported by the grants from Science and Technology Project of Henan Province (grant no. 172102310029).
Ethical Approval
This article does not contain any studies with human participants or animals performed by any of the authors.
Author Disclosure Statement
The authors declare that there are no competing financial interests.