
Abstract
Adamantinomatous craniopharyngioma (ACP) is a congenital epithelial tumor in the sellar region with benign histological manifestation but invasive. Currently, surgery is the main treatment for it, but its recurrence rate is high. Therefore, it is of great importance to explore the mechanism of occurrence and development of ACP and to identify new molecules. One gene expression profile, GSE94349, was downloaded from the Gene Expression Omnibus (GEO) database. The differentially expressed genes (DEGs) were identified by the limma package. Gene set enrichment analysis was used to make enrichment analysis using Gene Ontology (GO) and Kyoto Encyclopedia of Genes and Genomes (KEGG). Then, we performed the construction and analysis of the protein–protein interaction (PPI) network and significant module. The analysis of the GSE94349 dataset identified 109 DEGs, consisting of 80 upregulated genes and 29 downregulated genes in ACP samples compared with normal brain tissues. Functional and pathway enrichment analysis of DEGs provided a comprehensive overview of some major pathophysiological mechanisms in ACP: RNA polymerase II promoter, glutamate receptor binding, and so on. A total of 10 hub genes of DEGs were obtained from the PPI network, which provided potential therapeutic targets for the ACP. In summary, there were DEGs between ACP tissues and normal brain tissues, which may be involved in the mechanisms of occurrence and development of ACP, especially via the regulation of RNA polymerase II promoter and glutamate receptor binding. Key genes in DEGs could serve as new research targets for the diagnosis and treatment of ACP.
1. Introduction
Adamantinomatous craniopharyngioma (ACP) is a common subtype of craniopharyngioma. Craniopharyngioma is the most common intracranial tumor in children; it was known as early as 150 years ago (Muller, 2014b). Currently, survey data about it are relatively little. Its annual incidence is about 0.5–2 persons per million (Muller, 2014a). Although there has been no epidemiological survey of craniopharyngioma in China, we estimated that its annual incidence could be about 0.3–0.9 person per million based on an epidemiological survey of intracranial tumor in Shanghai in 1972 (Jin et al., 1993). With sporadic distribution, there are only occasional familial case reports of ACP, while no evidence of genetic predisposition about it exists. ACP is a tumor in the sellar region with benign manifestation but poor prognosis. Although nowadays the treatment for ACP has developed, its cause remains unknown and its prognosis unfavorable (Wang et al., 2017). Therefore, this has great importance in exploring the mechanism of occurrence and development of ACP and identifying new molecules (Bi et al., 2017).
Bioinformatics refers to the discipline that studies the collection, processing, storage, transmission, analysis, and interpretation of biological information; it is also a new discipline formed by the combination of both life sciences and computer science (Rubinstein and Chor, 2014). It could reveal the biological mysteries of large and complex biological data through a comprehensive utilization of biology, computer science, and information technology (Hardisty et al., 2016). Bioinformatics techniques for microarray data have been widely applied in oncology researches to identify genetic variation (Ferte et al., 2013; Emmert-Streib et al., 2015; Milan and Wilhelm, 2017). Microarray analysis can acquire expression information of tens of thousands of genes and explore relevant genomic changes to the occurrence and development of diseases (Gunn et al., 2018; Prasad et al., 2018). Since the beginning of the 21st century, an increasing number of researchers have applied bioinformatics techniques to study differentially expressed genes (DEGs) in the development of different cancers, and to understand the roles played by DEGs in biological processes, molecular functions, and signaling pathways (Hill et al., 2012; Zhao et al., 2016).
This study screened DEGs in ACP tissues compared with normal brain tissue and performed Gene Ontology (GO) analysis and Kyoto Encyclopedia of Genes and Genomes (KEGG) analysis on DEGs, applied gene set enrichment analysis (GSEA) to all the genes included, constructed a protein–protein interaction (PPI) network with DEGs, and screened a significant module of the PPI network and identified the top 10 hub genes. Finally, a preliminary analysis of the role played by DEGs in ACP was conducted.
2. Materials and Methods
2.1. Access to microarray data
One gene expression profile, GSE94349, was download from the Gene Expression Omnibus (GEO) database (www.ncbi.nlm.nih.gov/geo) (Wang et al., 2016). The array data of GSE94349 consist of an mRNA expression profile of 24 ACP samples and 27 healthy samples. These gene expression profiles were generated using Affymetrix HG-U133plus2 chips (Platform GPL570). All the ACP samples were obtained from craniopharyngioma surgical tissues, while control samples were collected from normal brain tissues of healthy individuals.
2.2. Identification of differentially expressed genes
The limma package is a full-featured package that contains both RAW data input and preprocessing (normalization) function for cDNA chips and Linear Models for Microarray Data (limma) for DEG analysis, especially for “multifactor designed experiment.” The limma package was applied to screen DEGs between ACP samples and normal brain tissue samples. The cut-off criteria were an adjusted p-value <0.001 and a logFC ≥7 or ≤ −7.
2.3. Enrichment analysis of Gene Ontology and Kyoto Encyclopedia of Genes and Genomes by gene set enrichment analysis
GO analysis includes three parts: cellular component, molecular function, and biological process; each part could explain certain biological functions of genes from different aspects (Cheng et al., 2014). KEGG analysis could analyze which protein pathways are enriched by certain genes (Tanabe and Kanehisa, 2012). GSEA could analyze all sequenced genes in two sample groups; its input is a gene expression matrix in which genes are divided into two groups; and all genes are first sequenced and then used to indicate the changing trends of expression levels of genes between the two groups. GSEA analyzes whether all the genes of a priori defined set are enriched at the top or bottom of this sequence list (Holden et al., 2008). GO and KEGG pathway enrichment analyses were performed for the identified DEGs using GSEA. GSEA was conducted on all the sequenced genes of ACP tissues and normal brain tissues using GSEA software, after importing gene annotation files, reference function sets, and all the gene data of both ACP tissues and normal brain tissues. The software analyzes the genes according to an algorithm and produces a gene sequence list, and then it analyzes the positions of all the genes in the sequence list and accumulates them to obtain an Enrichment Score (ES). By standardizing the ES, one will have a comprehensive understanding of the biological functions of the gene through an enrichment of function sets. p < 0.05 was set as a cut-off criterion.
2.4. Construction and analysis of protein–protein interaction network and significant module
The Search Tool for the Retrieval of Interacting Gene (STRING) database (https://string-db.org) could provide comprehensive interactions of lists of proteins and genes (Szklarczyk et al., 2015). Cytoscape (version 3.6.1), a free visualization software, has been used for visualizing the PPI network (Su et al., 2014). A PPI network of DEGs was built using the STRING database and subsequently was visualized with Cytoscape. Based on topology principles, MCODE (Molecular Complex Detection; version 1.5.1), a plug-in of Cytoscape, could discover the tightly coupled region (Bader and Hogue, 2003). MCODE was performed to screen the modules of PPI network with degree cut-off = 6, node score cut-off = 0.2. When the degrees were set (degrees ≥10), hub genes were excavated.
3. Results
3.1. Identification of differentially expressed genes in adamantinomatous craniopharyngioma
The analysis of the GSE94349 dataset identified 109 DEGs (adj. p < 0.001, logFC ≥7 or ≤ −7), consisting of 80 upregulated genes and 29 downregulated genes in ACP samples compared with normal brain tissues.
3.2. Gene Ontology and Kyoto Encyclopedia of Genes and Genomes pathway enrichment analysis of differentially expressed genes in adamantinomatous craniopharyngioma using gene set enrichment analysis
GSEA was used to perform GO and KEGG analyses to explore the functions and pathways of DEGs. GO enrichment analysis showed that 3161/4374 gene sets were upregulated in ACP, 1003 were significantly enriched at a nominal p-value <0.05, and 375 were significantly enriched at a nominal p-value <0.01. In addition, 1213/4374 gene sets were downregulated in ACP, 473 were significantly enriched at a nominal p-value <5%, and 80 were significantly enriched at a nominal p-value <0.01. The most significant enrichments for both up- and downregulated gene sets in the significant order (size of Normalized Enrichment Score [NES]) are listed in Table 1.
Functional Enrichment Analysis of Differentially Expressed Genes in Adamantinomatous Craniopharyngioma Using Gene Set Enrichment Analysis
ACP, adamantinomatous craniopharyngioma; ES, Enrichment Score; NES, Normalized Enrichment Score.
Six significant enrichment plots are shown in Figures 1 and 2, such as “GO_REGULATION_OF_TRANSCRIPTION_ELONGATION_FROM_RNA_POLYMERASE_II_PROMOTER,” “GO_REGULATION_OF_ACTIVIN_RECEPTOR_SIGNALING_PATHWAY,” “GO_LATERAL_PLASMA_MEMBRANE,” “GO_COPI_COATED_VESICLE,” “GO_SNARE_COMPLEX,” “GO_GLUTAMATE_RECEPTOR_BINDING,” and so on. GO enrichment analysis revealed that the upregulated gene sets in ACP were mainly associated with RNA polymerase II promoter and activin receptor, while the downregulated gene sets frequently correlated with glutamate receptor binding. Furthermore, KEGG enrichment analysis indicated that 129/176 gene sets were upregulated in ACP compared with normal brain samples, 32 were significantly enriched at a nominal p-value <5%, and 8 were significantly enriched at a nominal p-value <1%. Similarly, 47/176 gene sets were downregulated in ACP, 11 were significantly enriched at a nominal p-value <5%, and 1 gene set was significantly enriched at a nominal p-value <1%. The top 10 gene sets correlating with ACP according to NES are shown in Table 2.
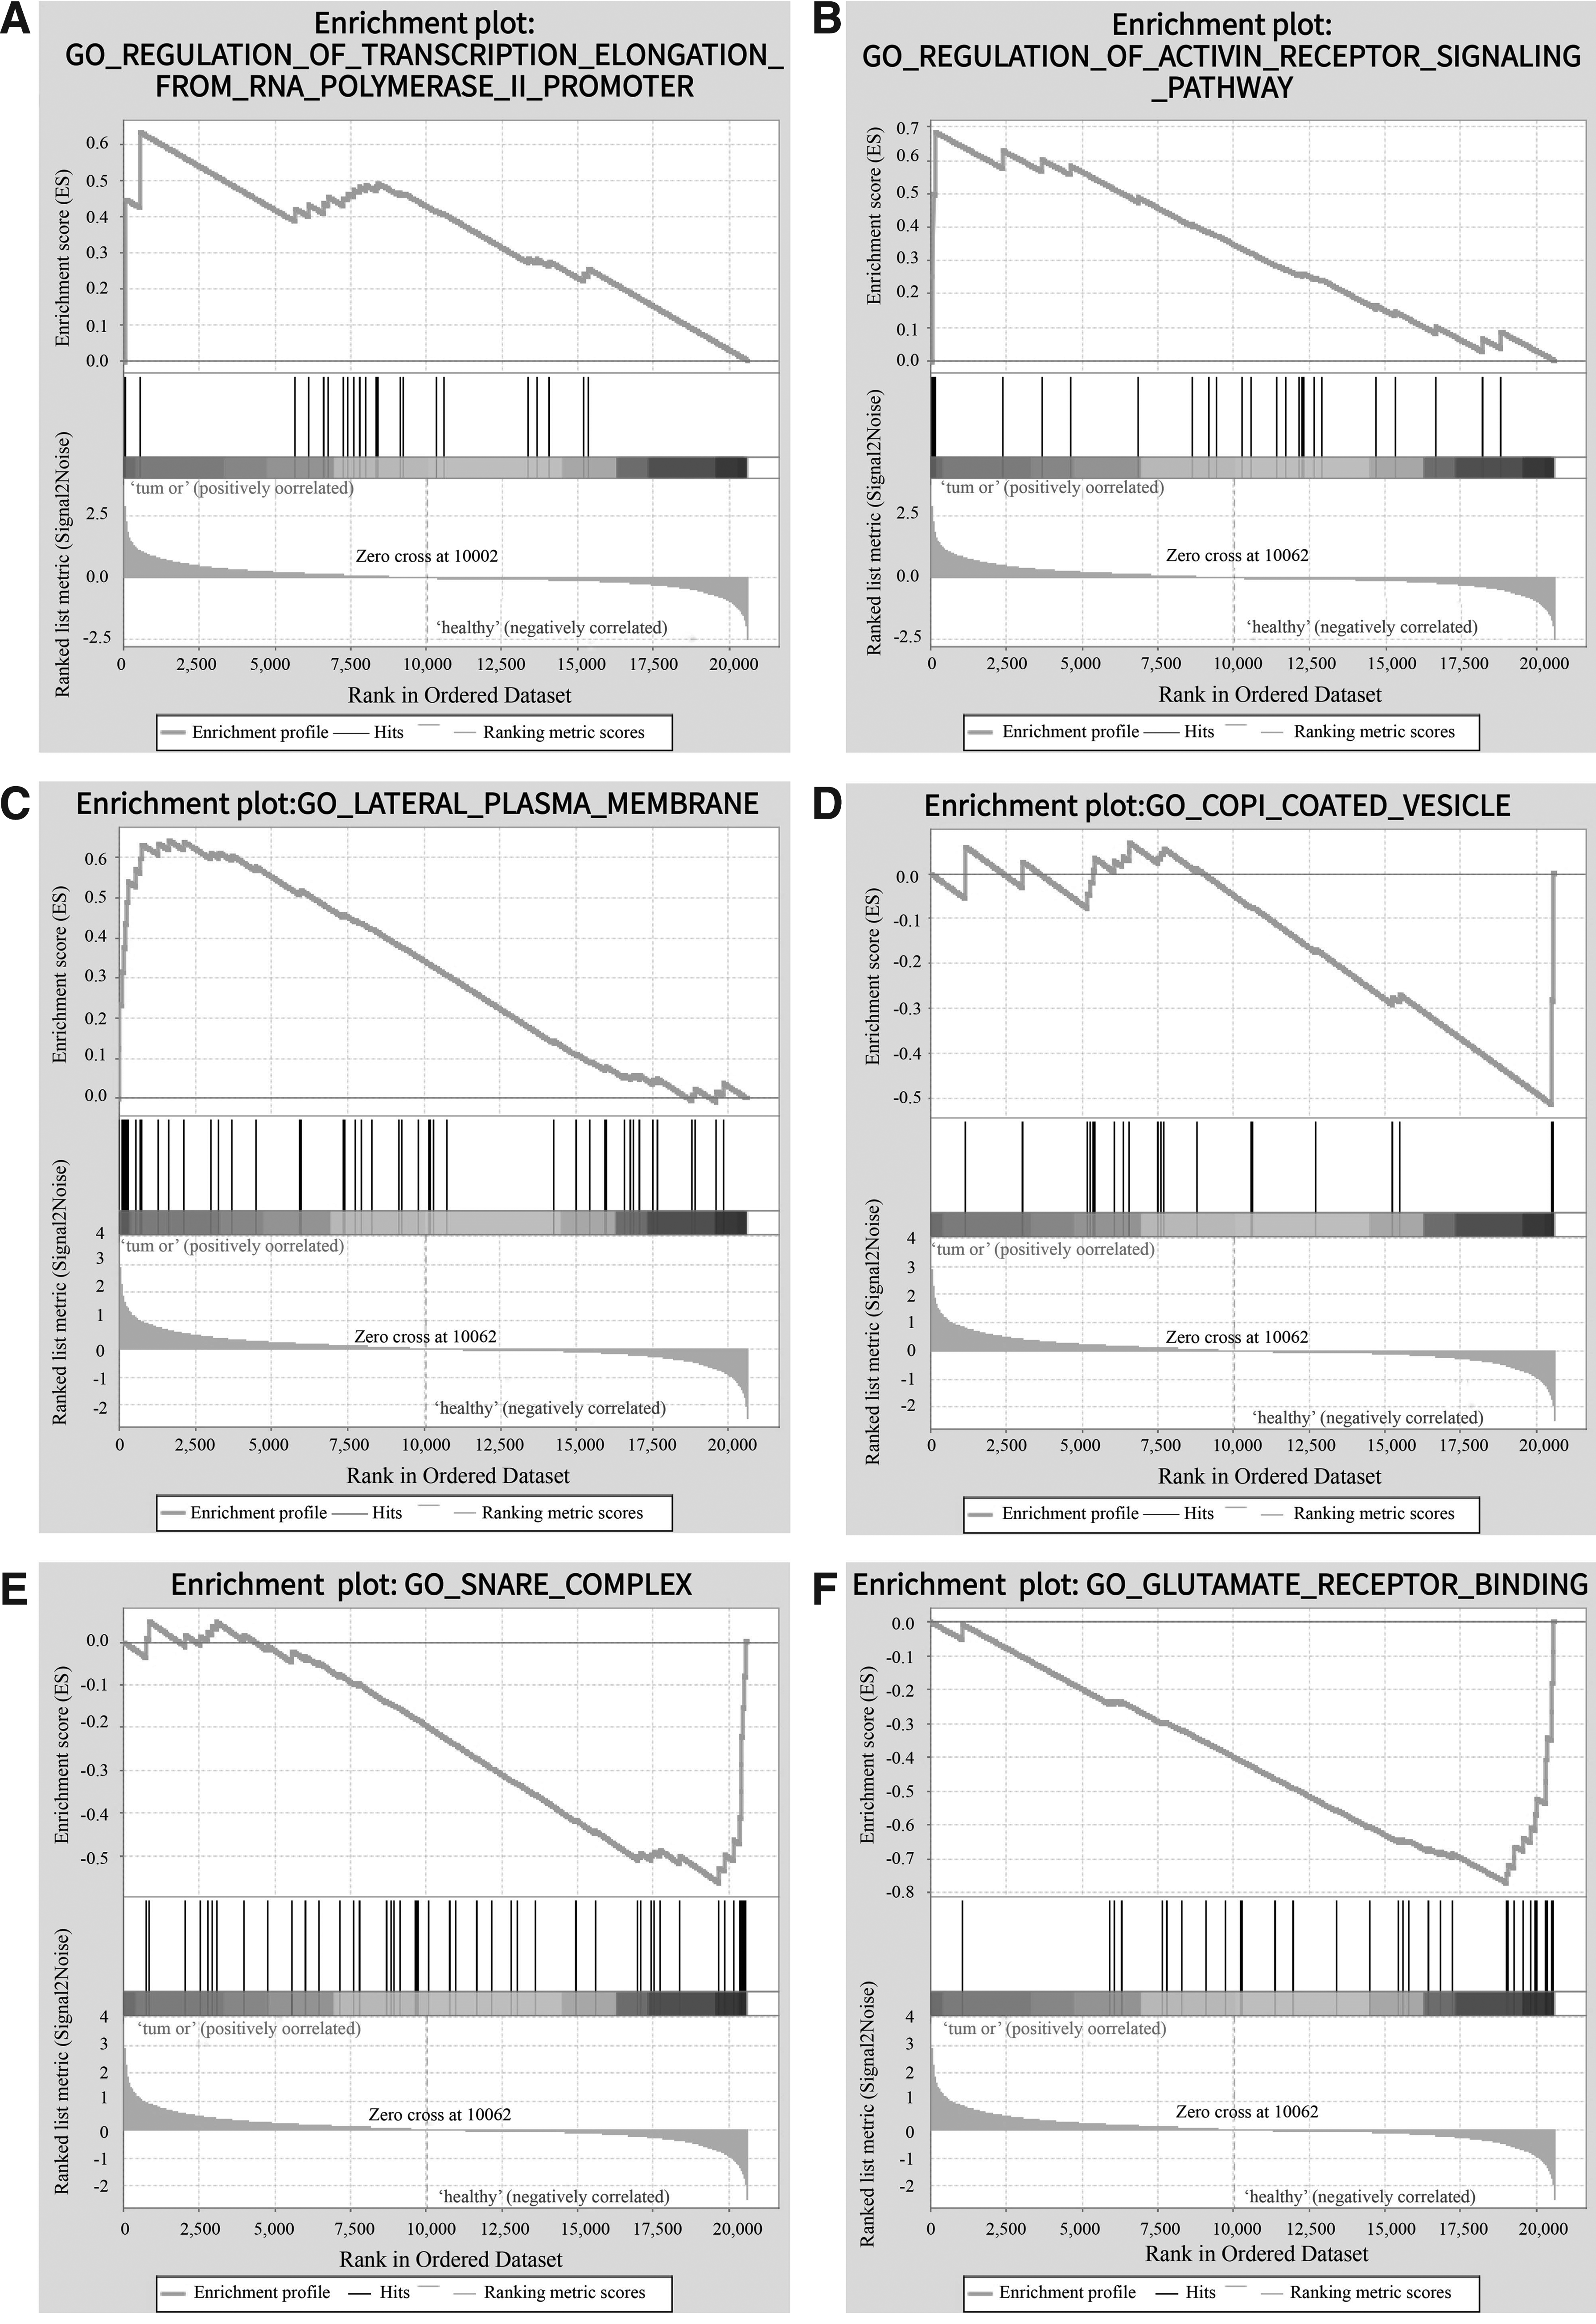
Six significant enrichment plots of functional enrichment analysis of DEGs in ACP using GSEA.
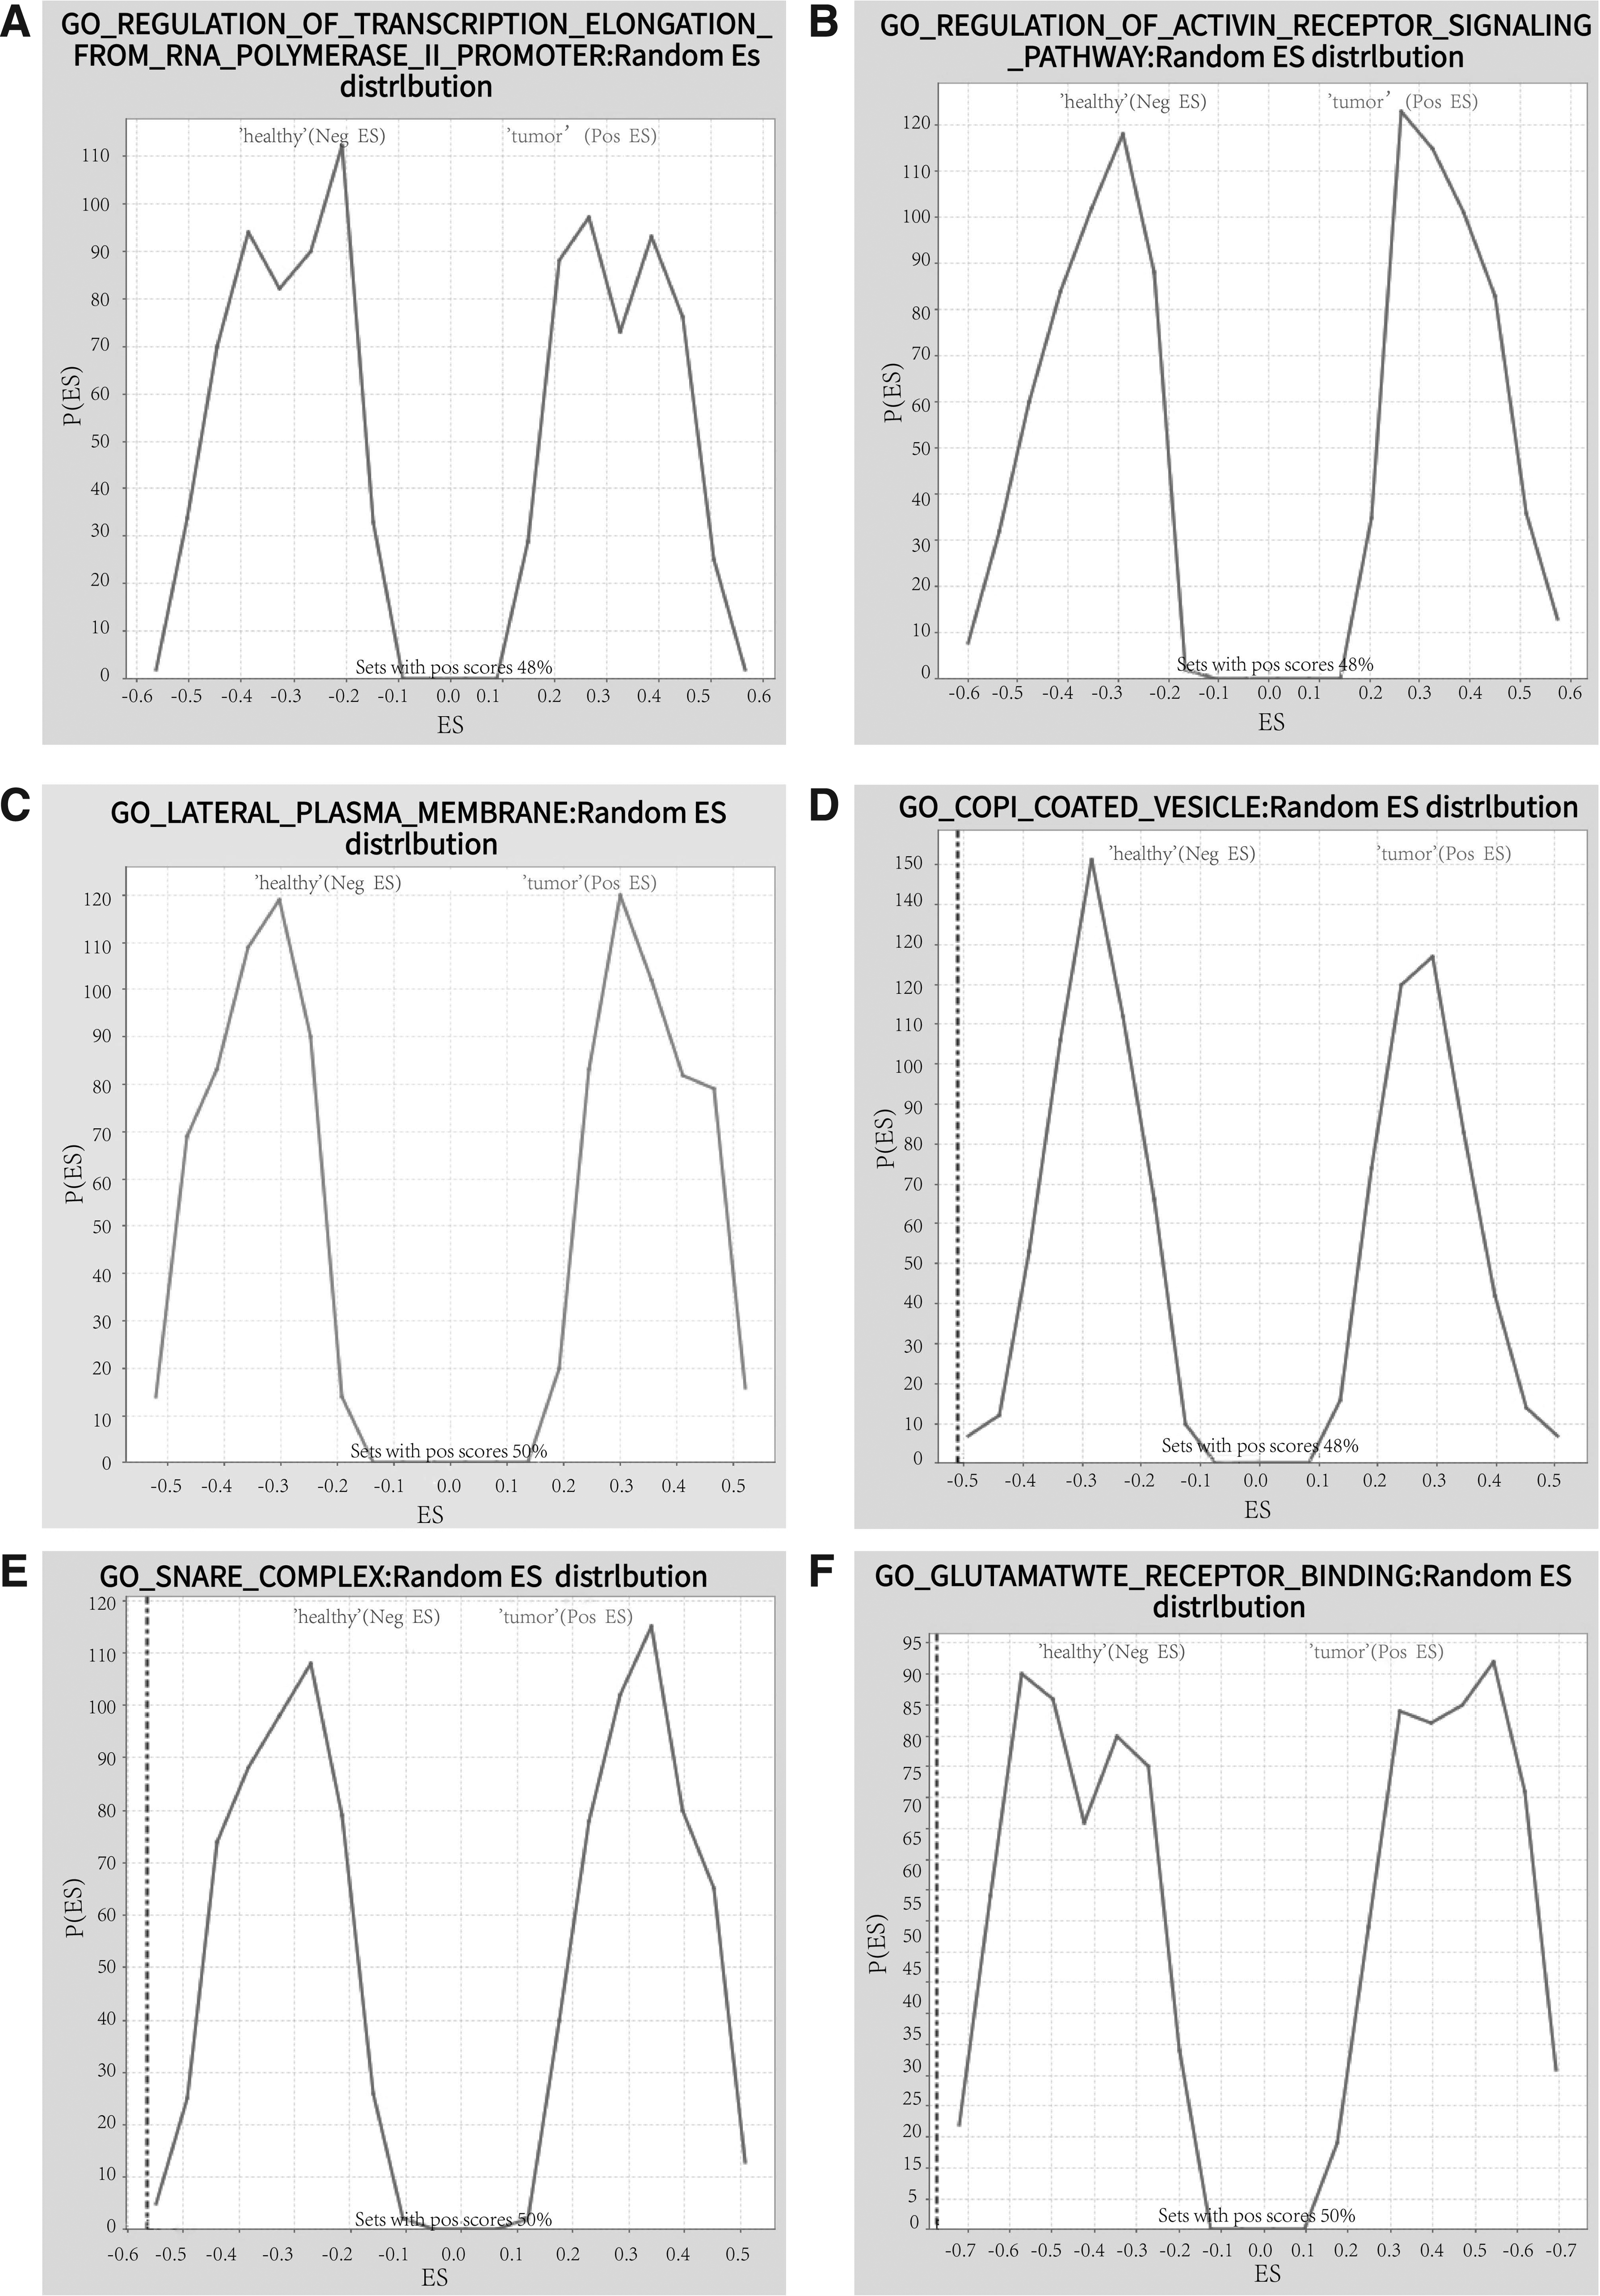
Random ES distribution of six significant enrichment plots.
Pathway Enrichment Analysis of Differentially Expressed Genes in Adamantinomatous Craniopharyngioma Using Gene Set Enrichment Analysis
Six significant enrichment plots are shown in Figure 3, such as “KEGG_SPLICEOSOME,” “KEGG_SMALL_CELL_LUNG_CANCER,” “KEGG_PATHWAYS_IN_CANCER,” “KEGG_CYTOSOLIC_DNA_SENSING_PATHWAY,” “KEGG_PROXIMAL_TUBULE_BICARBONATE_RECLAMATION,” “KEGG_CARDIAC_MUSCLE_CONTRACTION.” According to KEGG pathway enrichment analysis, the upregulated gene sets in ACP were generally involved in the pathways of spliceosome, cancer, and cytosolic DNA sensing, and the downregulated gene sets participated in neuroactive ligand receptor interaction and calcium signaling pathways.
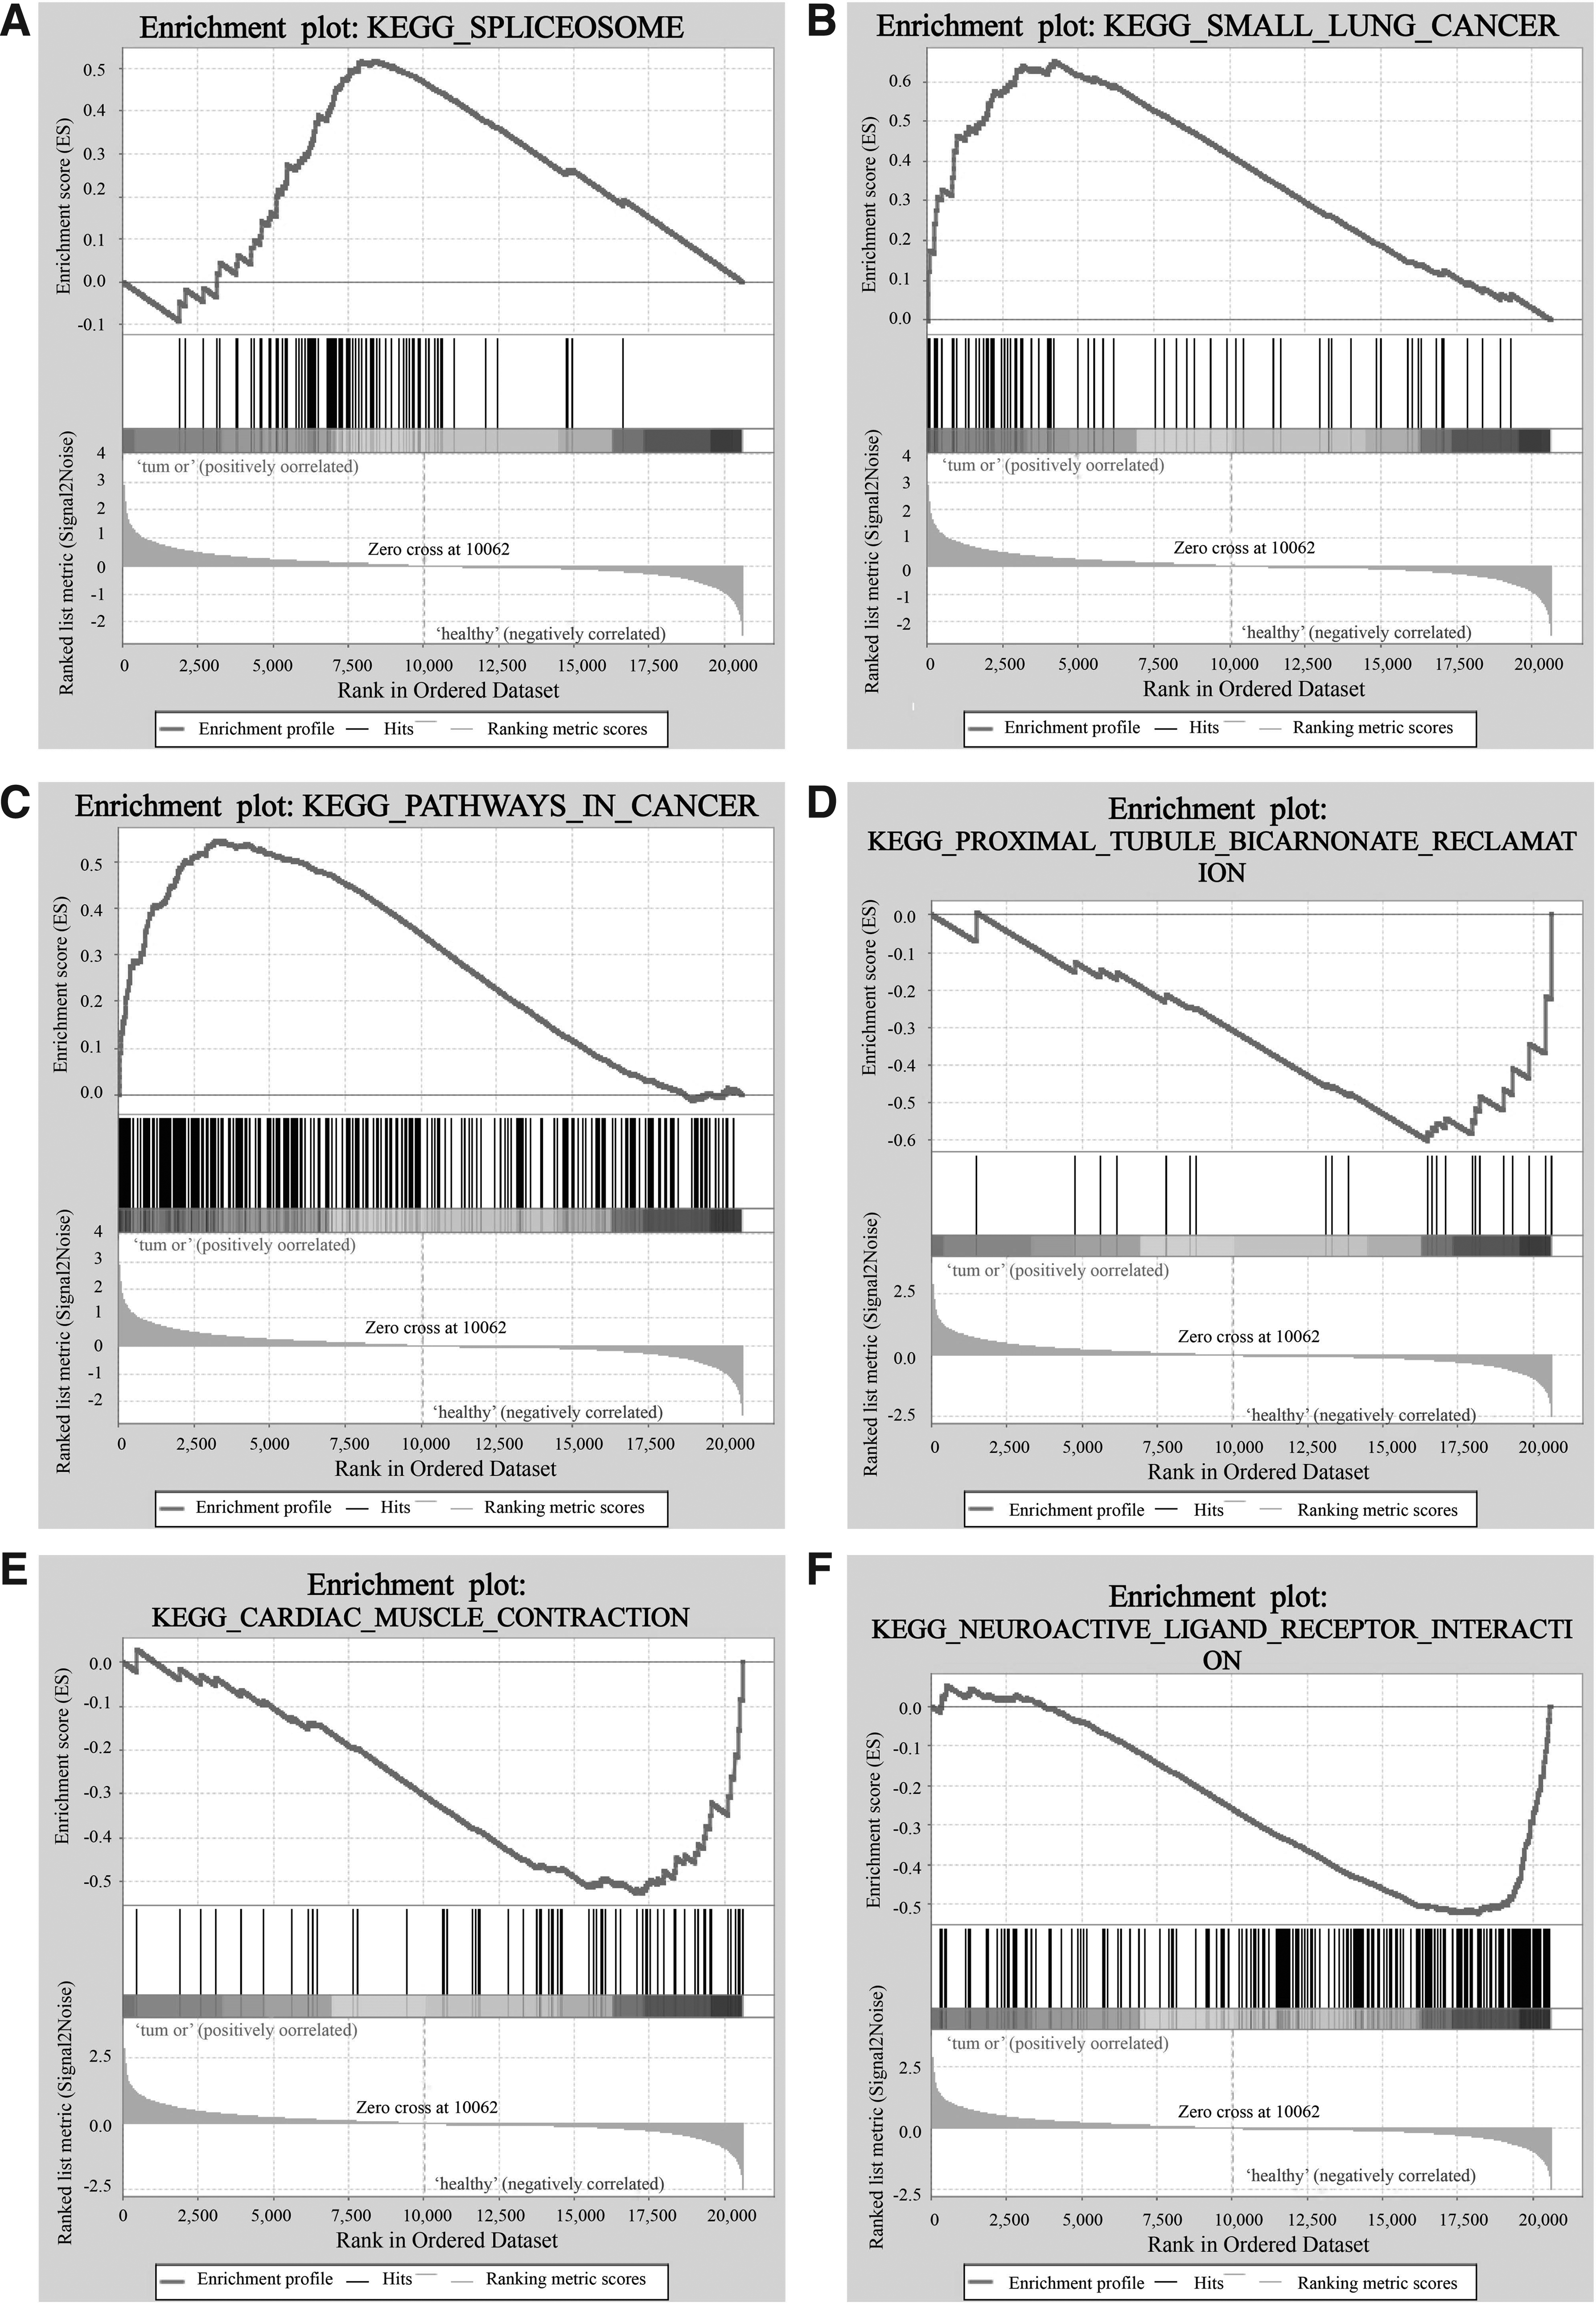
Six significant enrichment plots of pathway enrichment analysis of DEGs in ACP using GSEA.
3.3. Protein–protein interaction network construction and module analysis
The PPI network of DEGs consists of 76 nodes and 251 edges, with a PPI enrichment p-value <1.0e-16 (Fig. 4). The cytoHubba plug-in of Cytoscape was used to screen hub genes from the PPI network. A significant module, including 11 nodes and 55 edges, was generated from the PPI network of DEGs with MCODE (Fig. 5). A total of 10 genes was selected as hub genes: KRT6B, KRT16, DSG3, KRT19, KRT6A, KRT5, PKP1, KRT14, CDH1, and SNAP25 (Fig. 6). A total of 10 hub genes were screened in the heatmap (Fig. 7). The common genes between hub genes and the significant module are KRT6B, KRT16, KRT19, KRT5, KRT14, and KRT6A.
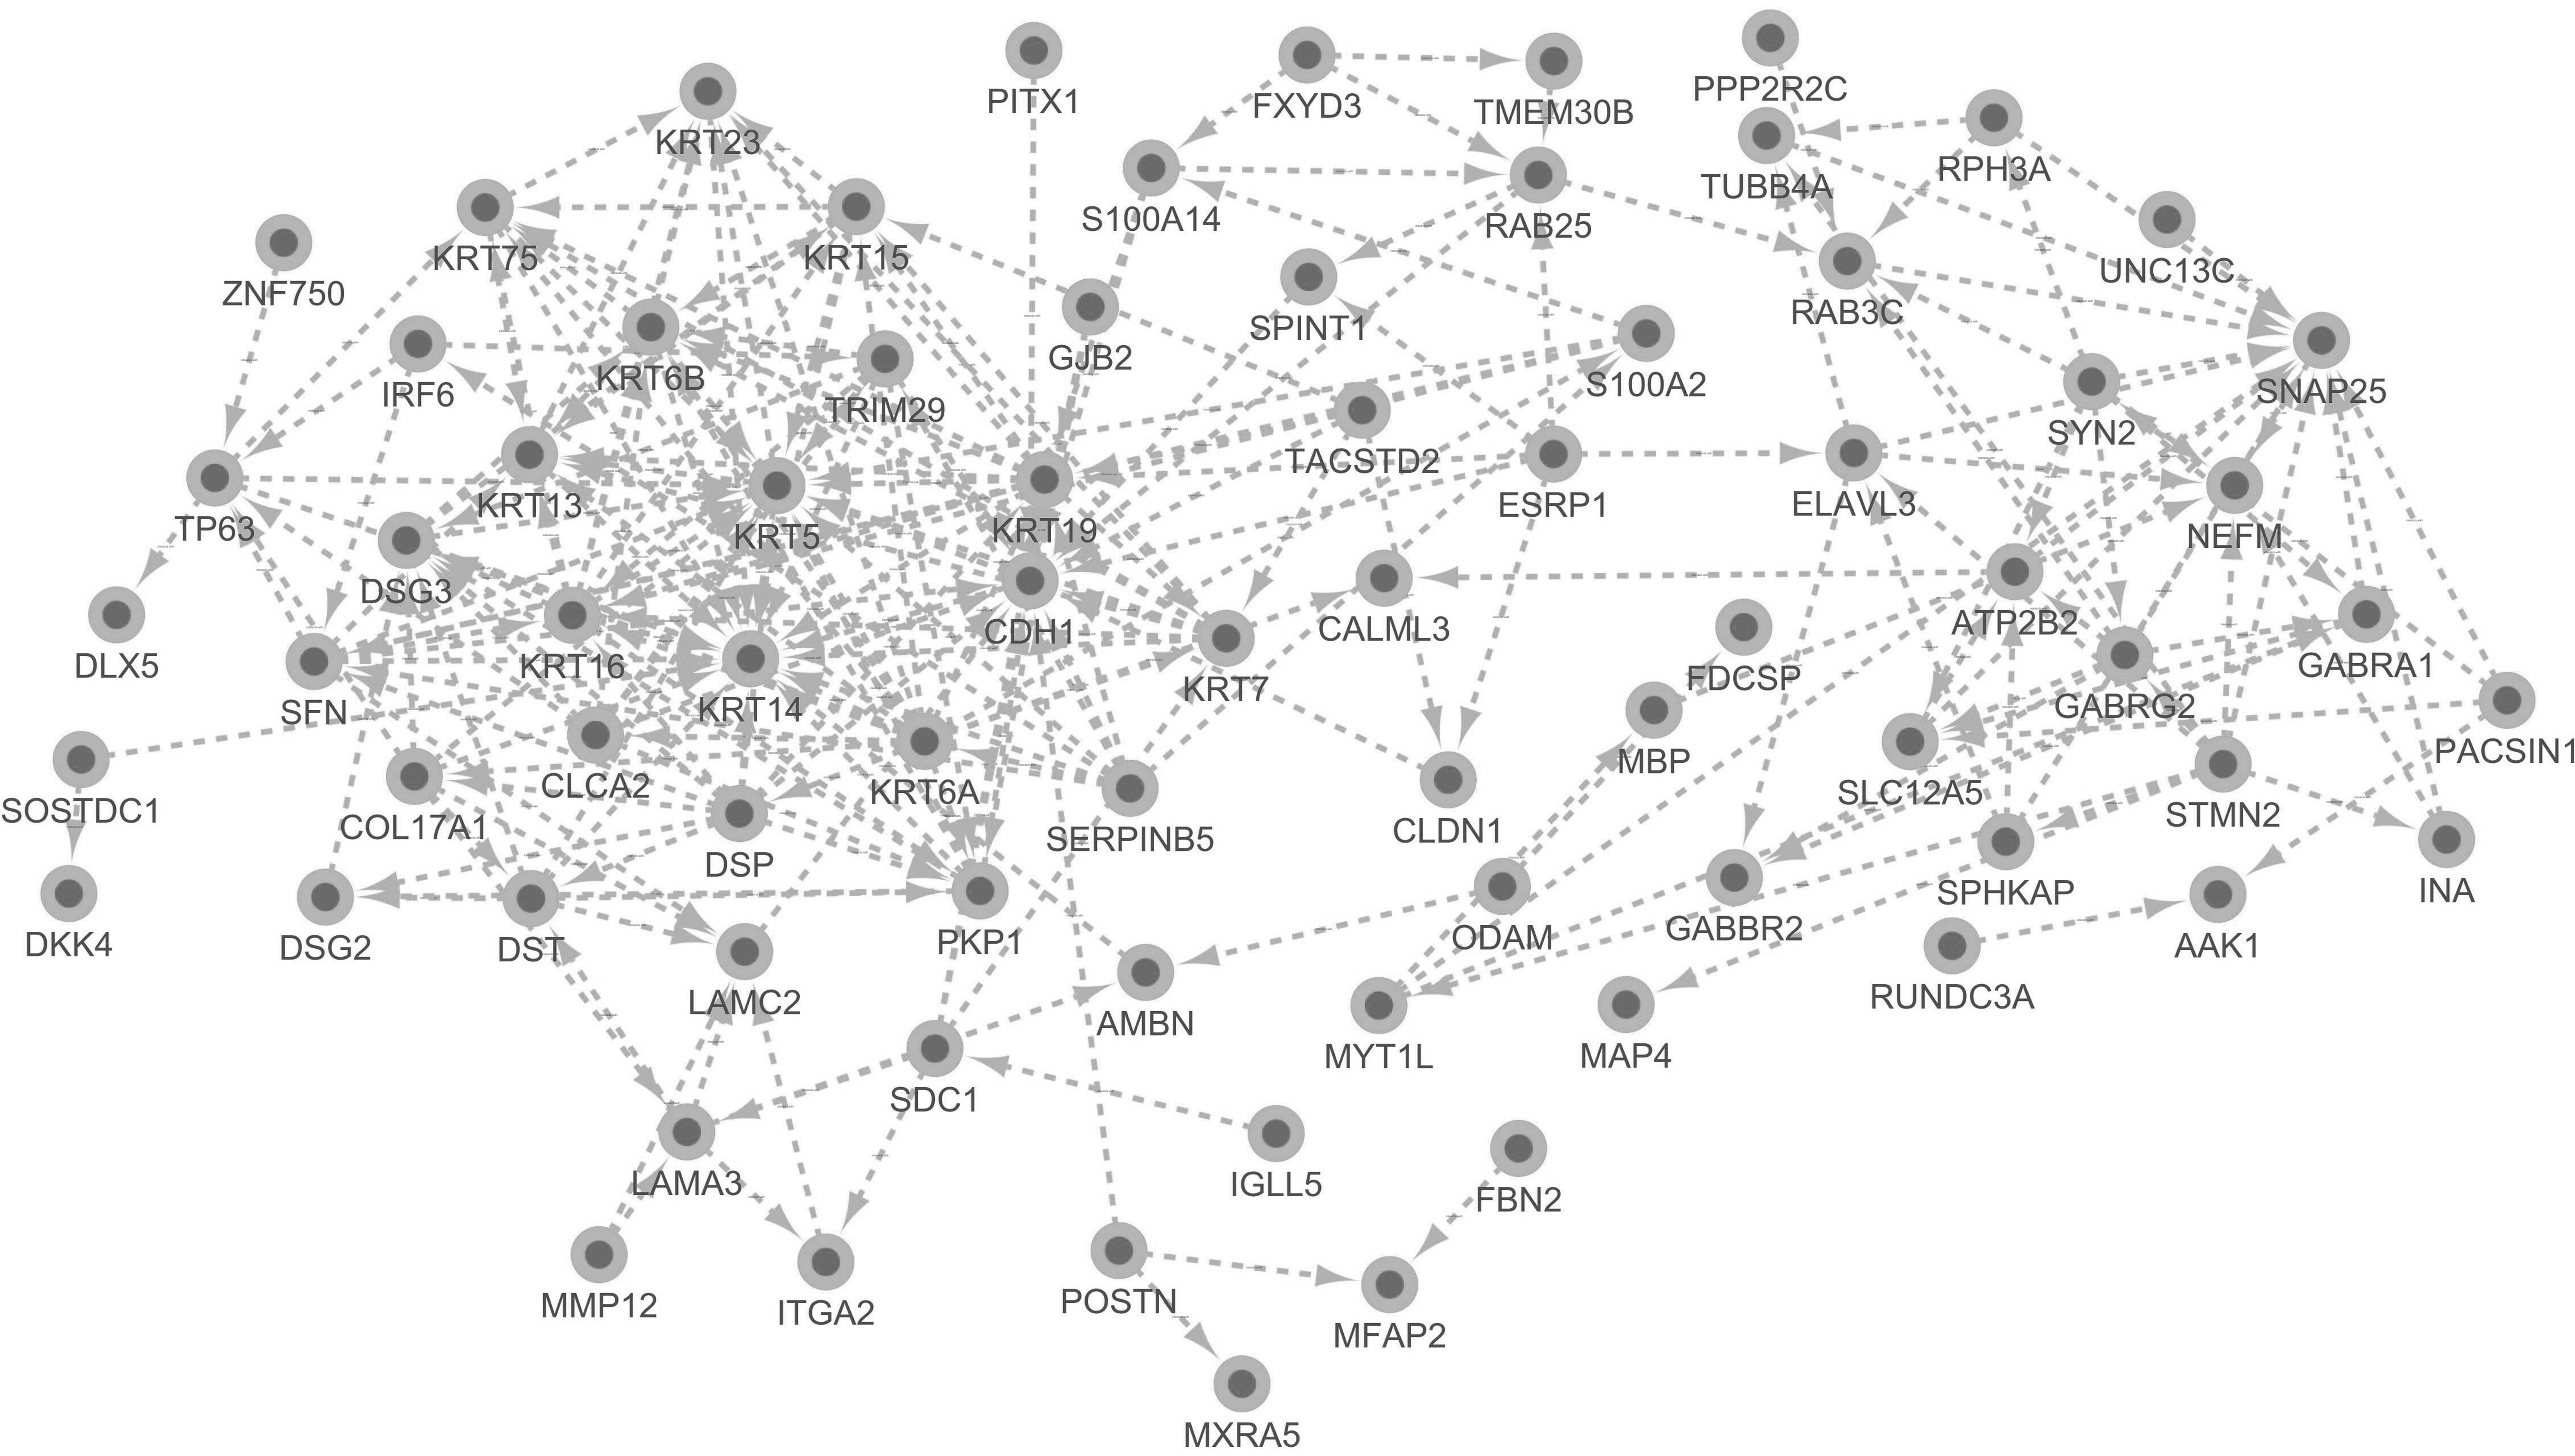
The PPI network of differentially expressed genes consisting of 76 nodes and 251 edges, and PPI enrichment p-value <1.0e-16. PPI, protein–protein interaction.
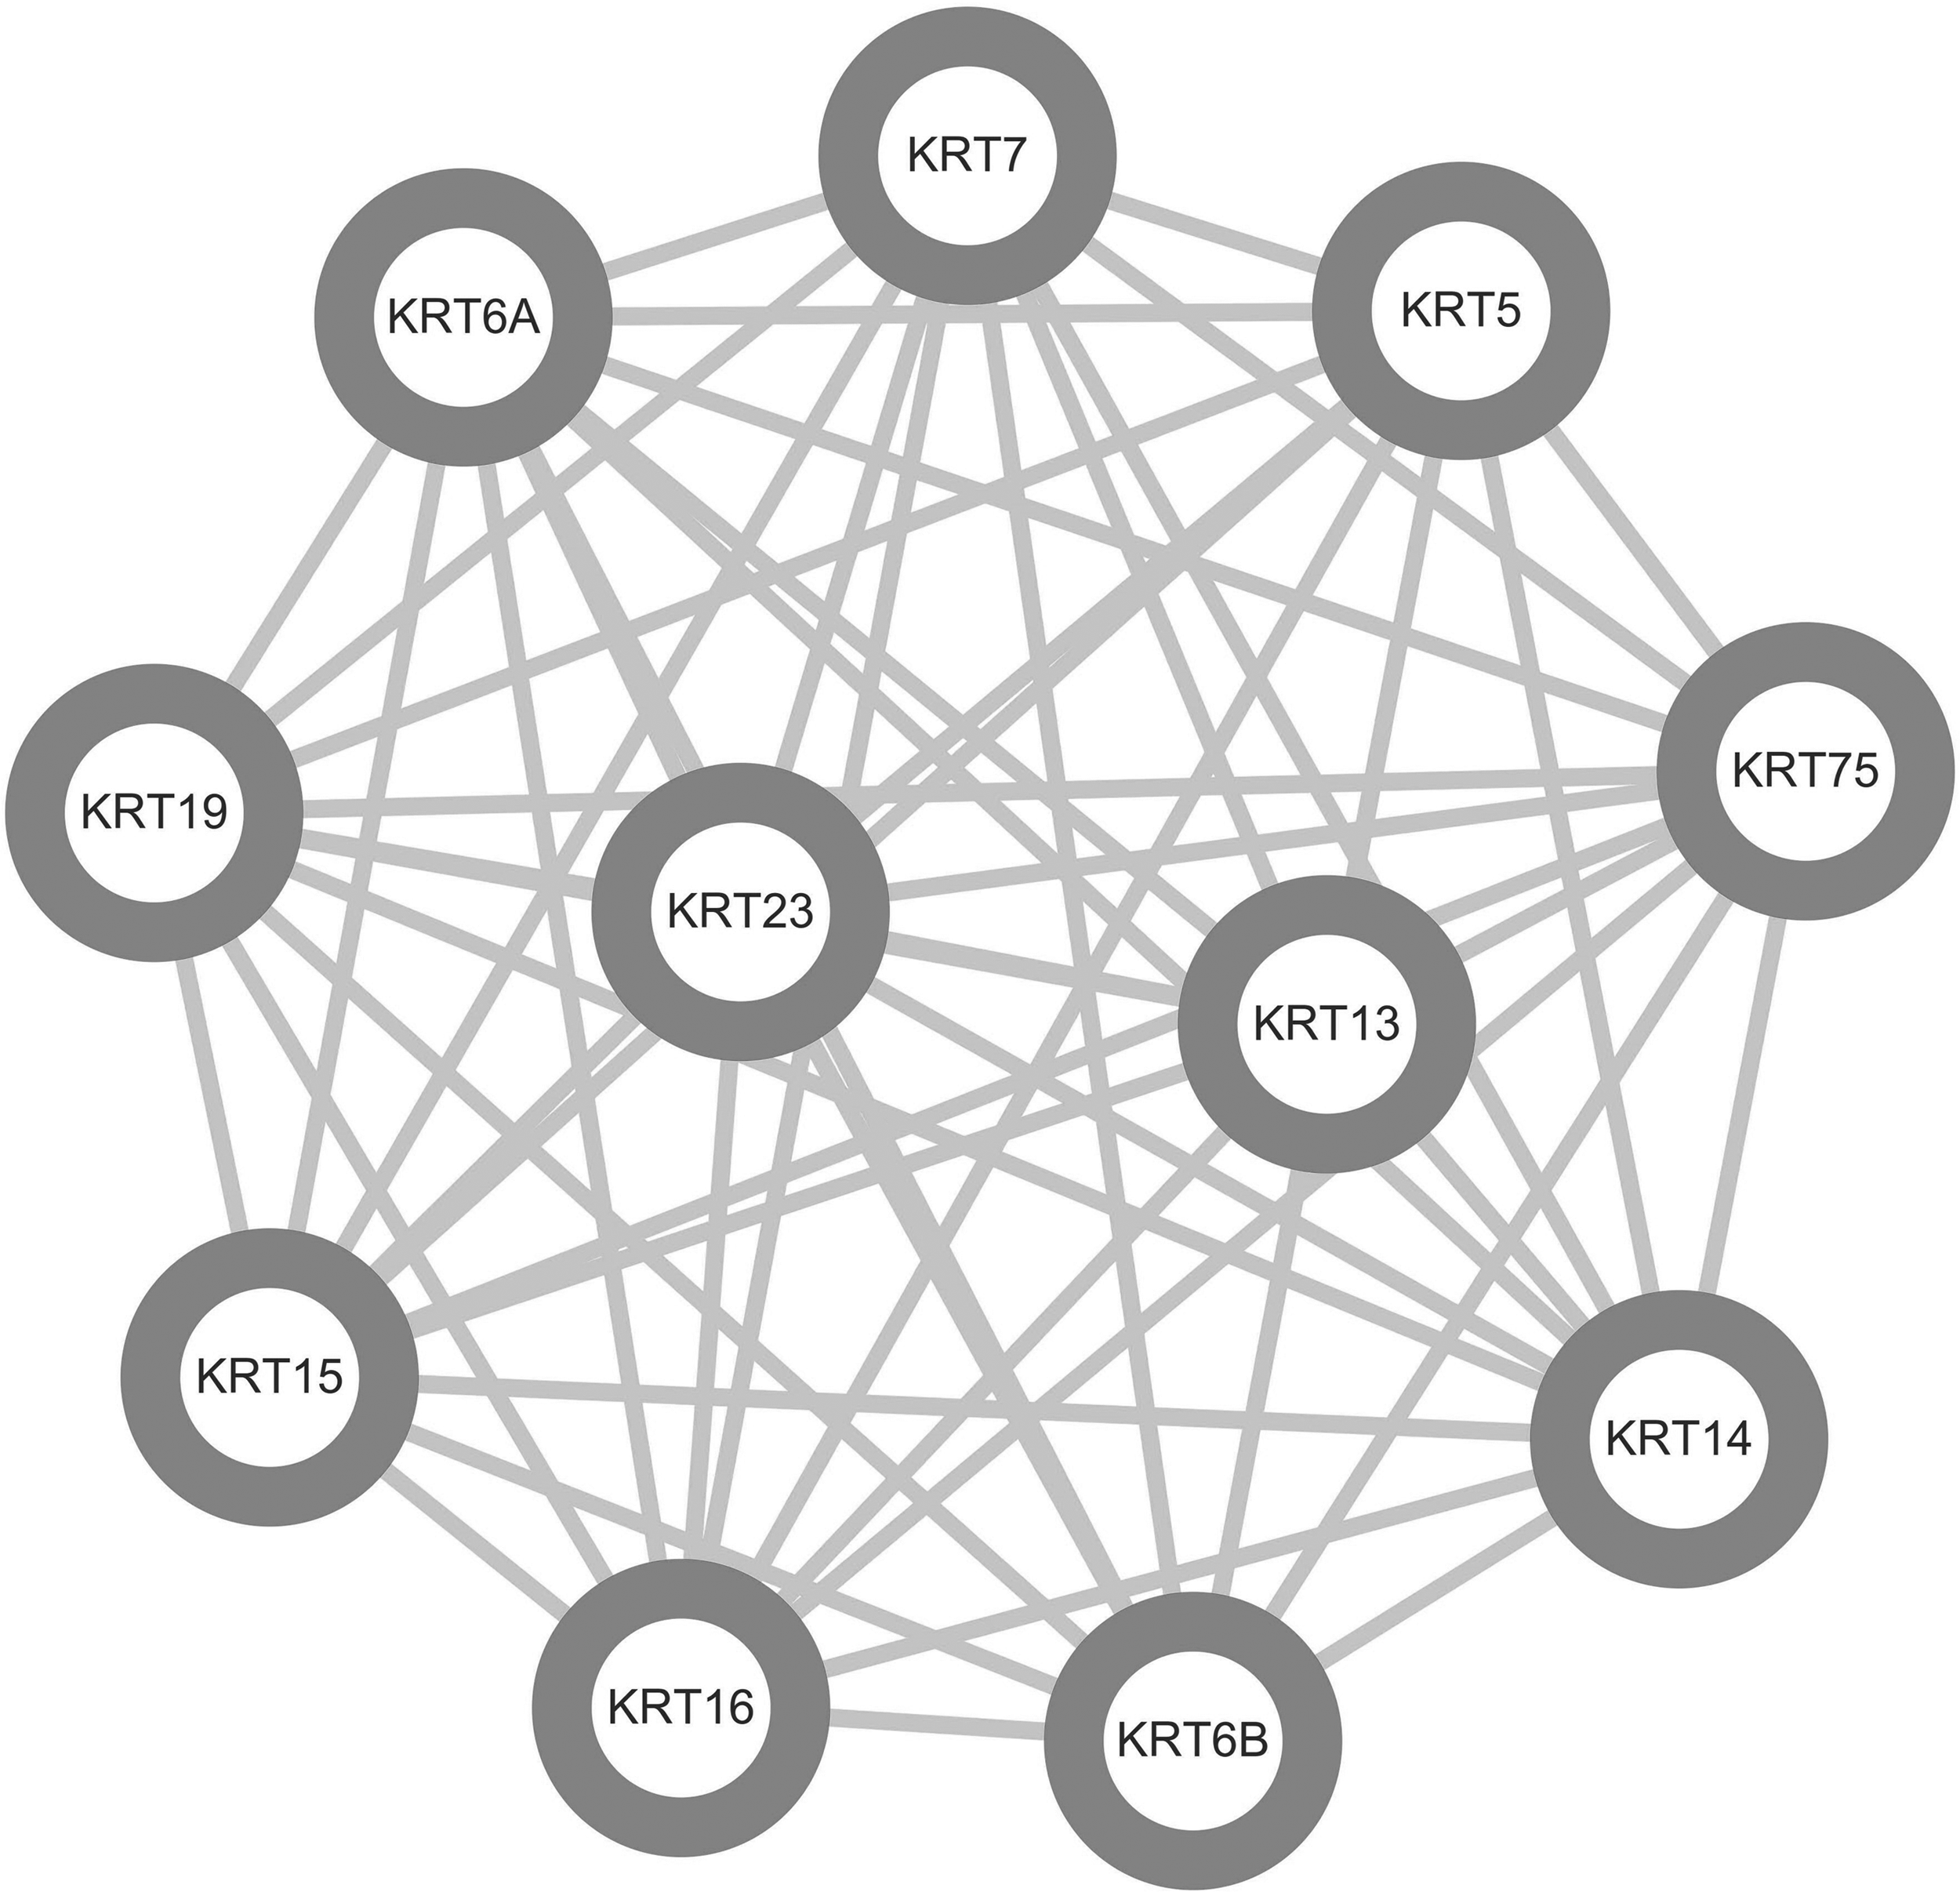
A significant module including 11 nodes and 55 edges was generated from the PPI network of DEGs with MCODE. MCODE, molecular complex detection.
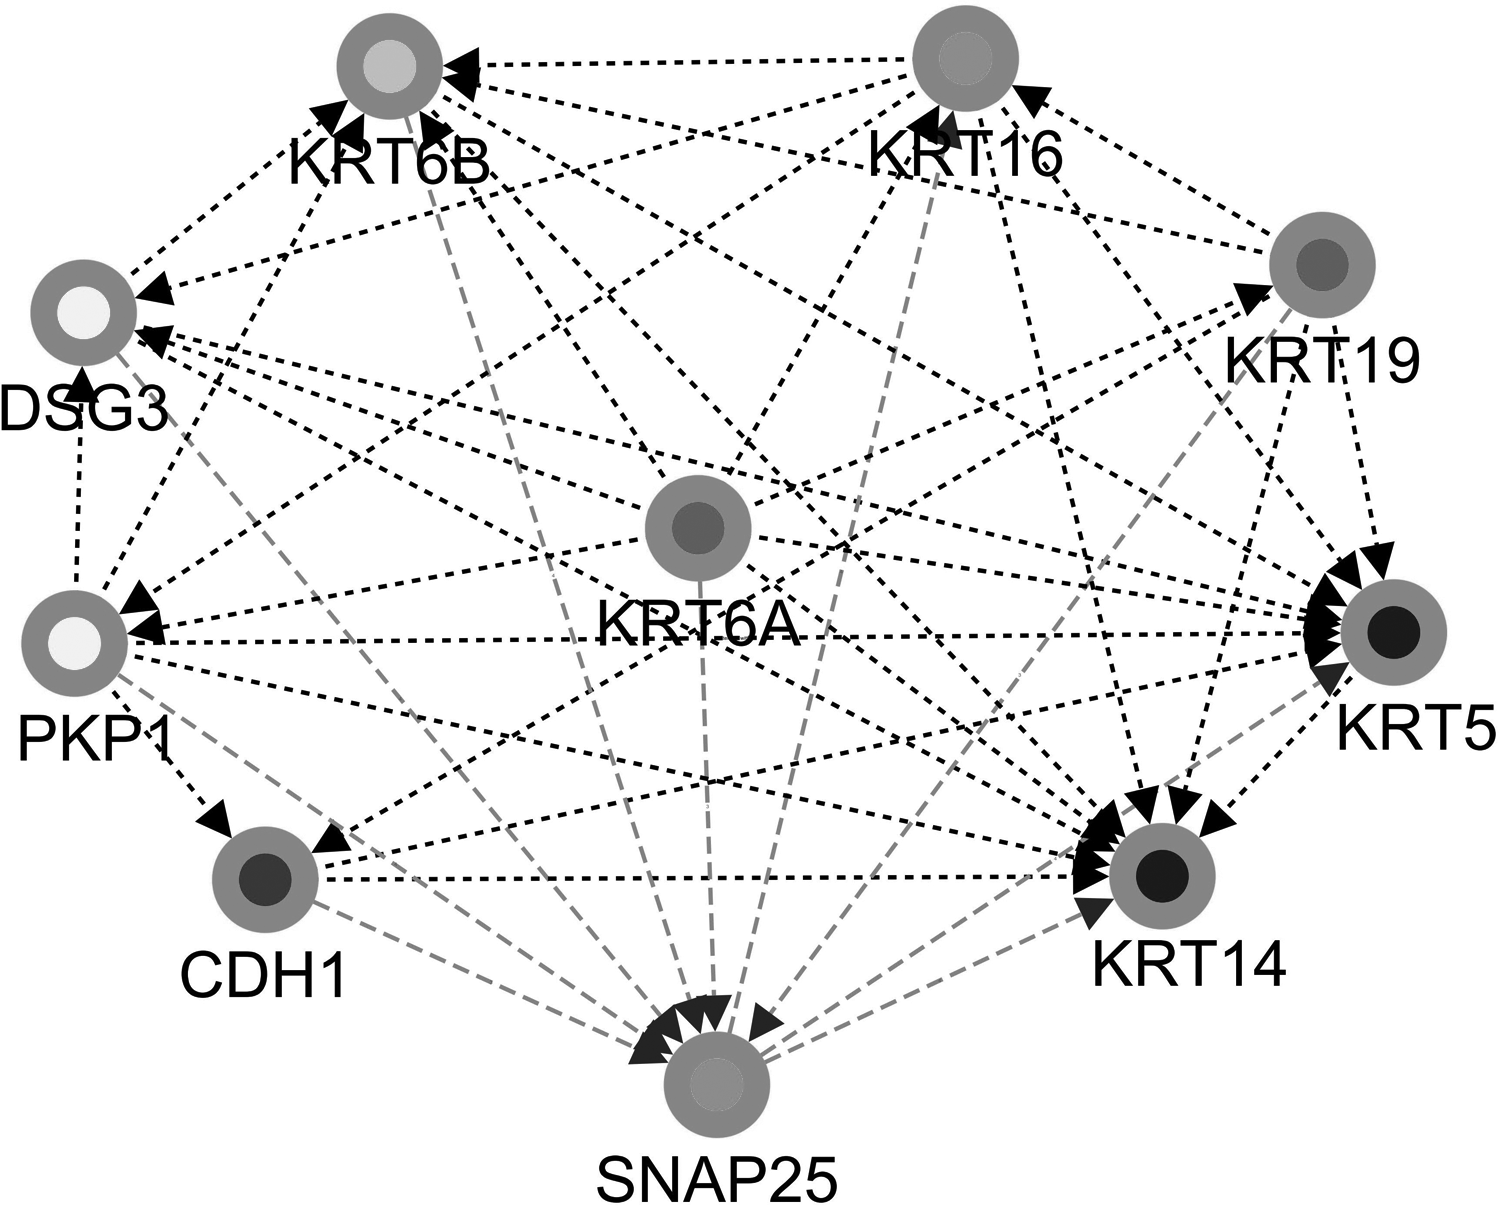
A total of 10 genes was selected as hub genes: KRT6B, KRT16, DSG3, KRT19, KRT6A, KRT5, PKP1, KRT14, CDH1, and SNAP25.
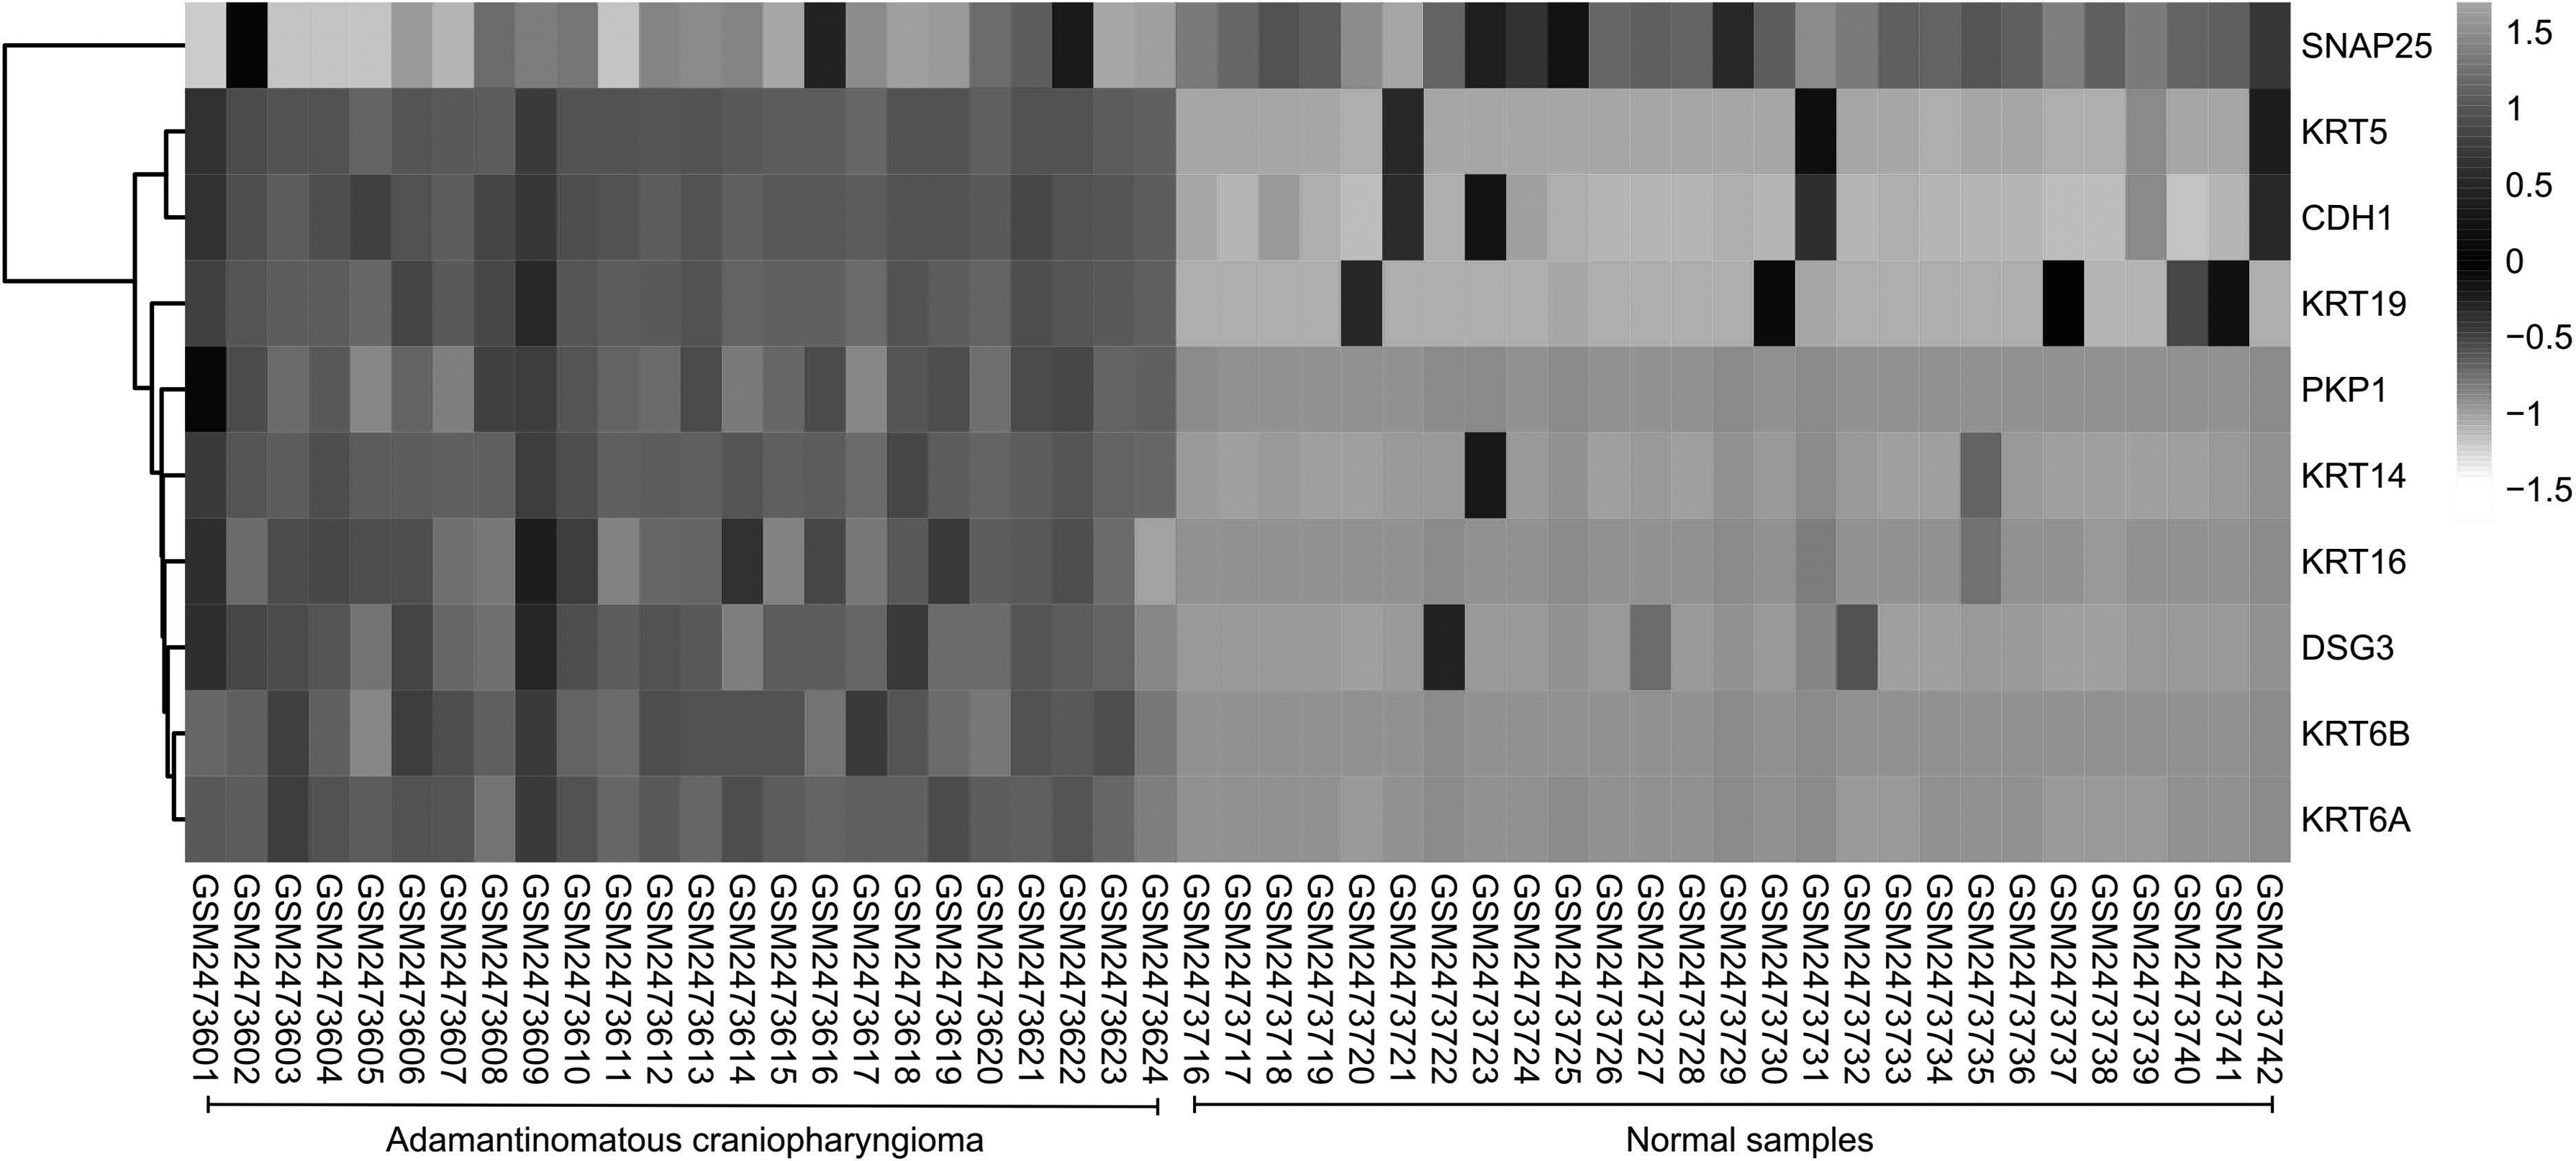
A total of 10 hub genes was screened in the heatmap. Hierarchical clustering showed that hub genes could basically differentiate ACP samples from normal samples. Upregulation of genes is marked in dark grey; downregulation is marked in light grey.
4. Discussion
ACP is a congenital epithelial tumor in the sellar region with benign histological manifestation but invasive (Abele et al., 2014). Currently, surgery is the main treatment, but its recurrence rate is high (Fernandez-Miranda et al., 2012). It is very difficult to treat recurrent ACP due to a significantly low surgical resection rate (only 0%–25%) and a high mortality and disability rate after operation (Ragel et al., 2007). Even for patients with a higher survival rate after various treatments, their quality of life may be seriously affected. The overall treatment effect of surgery is widely recognized as unsatisfactory by researchers in China and abroad (Brastianos et al., 2016; Hankinson and Kleinschmidt-DeMasters, 2017). Therefore, an early detection of ACP would help to improve the surgical resection rate and prolong patients' survival (Mortini et al., 2011), and exploring the molecular mechanism of ACP development could play an important role in screening, diagnosis, and treatment of ACP.
Bioinformatics has been widely applied to understand general genetic changes in the development of diseases, which may provide a reliable basis and method for the identification of therapeutic targets (Emmert-Streib et al., 2015; Gunn et al., 2018; Prasad et al., 2018). Using the gene expression profile of GSE94349, this research used bioinformatics analysis to screen DEGs and found that 109 DEGs were distinguished between ACP and normal brain samples, which included 80 upregulated genes and 29 downregulated genes. GSEA of DEGs provided a comprehensive overview of some major pathophysiological mechanisms in ACP: RNA polymerase II promoter, glutamate receptor binding, and so on.
The RNA polymerase II promoter is responsible for RNA polymerase recognition, combination, and transcription in the process of protein expression. It comprises a promoter, an initiator, an upstream element, and a responsive element. After combining with the transcription initiator, the RNA polymerase II promoter transcribes into mRNA and then regulates protein expression. Therefore, changes in the structure of RNA polymerase II promoter would affect gene expression (Philips et al., 2015; Boyaci et al., 2019). Zhao et al. (2012) applied tumor marker–RNA polymerase II combination in early detection of tumor cells, which implied RNA polymerase II as a promising target for tumor detection. Our study has found that the expression of “GO_REGULATION_OF_TRANSCRIPTION_ELONGATION_FROM_RNA_POLYMERASE_II_PROMOTER” in the brain tissue was obviously upregulated among ACP patients compared with the control group. This finding indicates that the RNA polymerase II promoter is possibly associated with ACP. Therefore, we inferred that the overexpression of RNA polymerase II promoter might enhance transcription, lead to an abnormal expression of tumor cell, and then induce ACP. However, whether the RNA polymerase II promoter can be used as a target of ACP needed to be further examined.
The glutamate receptor consists of ionotropic glutamate receptor (iGluR) and metabotropic glutamate receptor (mGluR). Their distribution widely in the human body helps maintain the normal physiological function of body. The glutamate receptor enters into several signaling pathways through cyclic adenosine monophosphate (cAMP), protein kinase A (PKA), and other second massagers. Besides, it has a key role in central sensitization (Hussey et al., 2007). Tang and Alger (2015) have found that the glutamate receptor affects excitability in mice by regulating the cannabinoid receptor. Current studies propose that signaling pathways mediated by the glutamate receptor promote tumor cell proliferation and invasion (Madabhushi et al., 2015). Li and Hanahan (2013) have found that the glutamate receptor is related with the prognosis of tumor patients, and an antagonist could suppress the proliferation and invasion of tumor cells. Lutz et al. (2019) have found that the glutamate receptor could change subpopulations of glioma cells and suppress the expression of proto-oncogene cFos, supporting the glutamate receptor as an essential role in GBM treatment. Our study observed that the expression of “GO_GLUTAMATE_RECEPTOR_BINDING” in the brain tissue is obviously downregulated among ACP patients, compared with the control group. It was inferred that a reduction in glutamate receptor expression weakened the downstream signaling pathway, leading to ACP. However, this mechanism isn't fully elucidated. Cryoelectron microscopy might be helpful in understanding the mechanism of the glutamate receptor in regulating the downstream signaling pathway.
The study also built a PPI network, and six key genes were identified: KRT6B, KRT16, KRT19, KRT5, KRT14, and KRT6A. Findings showed that the expression of these six key genes in the brain tissue was obviously upregulated among ACP patients, compared with the control group. KRT16 is one intermediate filament protein that protects the structure of epithelial cells. Previous research proved the role of KRT16 in an early detection of non–small cell lung cancer (Karlsson et al., 2019), also as a diagnostic biomarker for metastatic melanoma (Wang et al., 2018), which indicates a possible relation between KRT16 overexpression and APC metastasis and poor prognosis. A higher KRT19 expression was reported in colon and breast cancers (Saha et al., 2019), making it a potential molecular marker for breast cancer metastasis (Wang et al., 2019). These findings imply that the overexpression of KRT16 contributes to APC proliferation and metastasis.
Another study showed KRT5 to be associated with lymphonodal metastasis in urinary bladder cancer (Eckstein et al., 2018). A possible reason is that keratinose encoded by KRT5 participates in cytoskeleton signal transduction and cytoskeleton protein formation. An upregulation of KRT5 expression can trigger APC through a similar mechanism. KRT14 was reported to be related with urothelium carcinoma in basal cells (Papafotiou et al., 2016), and its overexpression would trigger abnormality of the basal cell, then APC. KRT6A-encoding protein plays a role in cytoskeleton signal transduction and neurofilament formation. Research revealed that mammary epithelial cells with KRT6A expression more likely turned cancerous (Holloway et al., 2015). Its overexpression could trigger APC through a certain signaling pathway. These five encoding keratin genes might be associated with the formation of pathway protein and then trigger APC.
Although the study carried out rigorous bioinformatics analysis, there are still some shortcomings. First, the sample size in the dataset is relatively small and needs to be further expanded to obtain more accurate results. Second, this study only conducted bioinformatics analysis and no experiments were carried out to verify the results; thus, a large number of clinical samples and animal experiments are needed to further understand the molecular mechanism of ACP.
In summary, bioinformatics could be a useful tool to explore the mechanism of occurrence and development of ACP and predict its progression. In addition, there are DEGs between ACP tissues and normal brain tissues, and these may be involved in relevant mechanisms of ACP occurrence and development, especially the regulation of RNA polymerase II promoter and glutamate receptor binding. Key genes in DEGs could serve as new research targets for the diagnosis and treatment of ACP.
Footnotes
Acknowledgment
We are thankful to Yuan-meng Zhang for his statistical assistance and suggestions during the submission process. This study was funded by the Capital Characteristic Clinical Application Research (grant number Z161100000516236).
Author Disclosure Statement
The authors declare they have no competing financial interests.