
Abstract
This study was aimed to identify novel miRNA biomarkers and explore the cooperative function of multi-RNAs in the progress of primary melanoma. The miRNA expression profile GSE62370 generated from 9 congenital nevi and 92 primary melanoma samples was downloaded from the Gene Expression Omnibus database. Differentially expressed miRNAs between primary melanoma and congenital nevi were compared and the target genes of them were selected. Pathway enrichment analysis and protein/protein interaction (PPI) network of miRNA target genes were performed. In addition, the differential expression of miRNAs to identify the tumor stage-dependent differences in miRNA expression was analyzed. Differentially expressed miRNAs, including 6 upregulated and 23 downregulated, were found in primary melanoma. Besides, the miRNA-associated gene regulatory network revealed 274 nodes, including miR-142-5p and miR-125b, and 307 miRNA-target pairs. miRNA-related Kyoto Encyclopedia of Genes and Genomes (KEGG) pathway, such as melanoma, was found. Target genes in the PPI module were mainly enriched in cancer-related pathways. Finally, the melanoma stage-related overexpressed miR-142-5p and the downregulated miR-550, miR-1826, miR-1201, miR-205, and miR-125b were identified. Some validated miRNAs, including miR-125a/b, let-7a/b, and miR-205, were found and illustrated the reliability of our study. Four novel miRNAs, including miR-142-5p, miR-550a, miR-1826, and miR-1201, were considered to have potential prognostic values for primary melanoma.
1. Introduction
Melanoma, although not a common form of skin cancer, is the most dangerous type of skin cancer. Moreover, during the last decades of the 20th century, the incidence of melanoma has become more common, especially in populations of European origin, risen by 3%–7% annually (Azoury and Lange, 2014; O'Leary et al., 2015). It may be primarily caused by ozone depletion and the increasing ultraviolet radiation (Björn and McKenzie, 2008). At present, the melanoma incidence is increasing worldwide (Boland and Gershenwald, 2015). Normally, primary melanoma is categorized into five stages: stage 0 (melanoma in situ), stage I (invasive melanoma), stage II (high-risk melanoma), stage III (regional metastasis), and stage IV (distant metastasis) (Balch et al., 2001).
MicroRNAs, a class of small noncoding RNAs of 18–25 nucleotides, have been implicated in melanomas, with scores of articles, as oncogenes or tumor suppressors. Schultz et al. (2008) indicated the regulatory effects of let-7b on cell cycle molecules in early melanoma development. Decreased expression of let-7a resulted in the upregulation of integrin β3 expression accompanied with enhanced invasive potential of melanoma cells (Müller and Bosserhoff, 2008). miR-125b involving in strong suppression of cellular proliferation and migration was significantly lowly expressed in malignant melanoma cells than in melanocytes (Kappelmann et al., 2013). The expression level of miR-205, which may be a tumor suppressor miRNA, is significantly associated with melanoma-specific survival (Hanna et al., 2012). miR-9 could inhibit the NF-κB1-Snail1 pathway in melanoma to upregulate E-cadherin during melanoma progression (Liu et al., 2012). miR-145 exerts the invasion suppressor function in the primary, noninvasive melanoma and metastatic melanoma (Dynoodt et al., 2013). Pencheva et al. (2012) uncover the synergistic cooperativity of multi-miRNAs, including miR-1908, miR-199a-5p, and miR-199a-3p, in melanoma. However, although multiple miRNA expression has been proven to be correlated with melanoma metastasis and development at present, no miRNA is used in the clinical, prognostic, or predictive model.
The most powerful predictor for survival in patients with primary malignant melanoma is the presence or absence of metastases. In our study, we downloaded the miRNA expression profiling of primary melanoma at different phases (stage I–III) and congenital nevi. Differentially expressed miRNAs between them were screened to explore the possible mechanism for regulating gene expression during the development of melanoma. In addition, miRNA target genes were identified, and pathway enrichment analysis and protein/protein interaction (PPI) network of targets were performed. Eventually, melanoma stage-related differentially expressed miRNAs were selected. This study may help to explore the cooperative function of multi-RNAs in the progress of primary melanoma and to clarify the pathomechanism of it.
2. Methods
2.1. Data sources and processing
The miRNA expression profiling GSE62370 generated from 9 congenital nevi and 92 primary melanoma samples by Hanniford et al. (2015a,b) was downloaded from the NCBI Gene Expression Omnibus database. There were 19 stage I (IB), 52 stage II (22 IIA, 20 IIB, and 10 IIC), and 21 stage III (6 IIIA, 8 IIIB, and 7 IIIC) in the primary melanoma samples. The platform of the microarray data set is Exiqon miRCURY LNA array version 11.0, miRBASE version 14.0. The data set had been inherently well normalized by Hanniford et al., and the platform annotation files were downloaded to map Probe IDs to miRNA IDs.
2.2. Differentially expressed miRNAs
Differential expression of miRNAs between primary melanoma and congenital nevi was compared. Significant p-values of miRNA differential expression of melanoma versus congenital nevi were analyzed by Limma package (Smyth, 2005) in R using a nonpaired-T test. The Benjamini/Hochberg (BH) procedure was used to adjust the resulting p-values. The difference in miRNA expression with adjusted p-value <0.05 and |log2fold change (FC)| ≥0.5 was considered significant. The R “gplots” package was applied to construct a heatmap of differentially expressed miRNAs.
2.3. Target genes of differentially expressed miRNAs
To ensure the accuracy of the following results, we selected only experimentally validated miRNA-target gene interactions. The relationship information of differentially expressed miRNAs and their target genes was identified based on the experimental interactions obtained from the miRecords (http://c1.accurascience.com/miRecords) (Xiao et al., 2009) and the MiRWalk (www.umm.uni-heidelberg.de/apps/zmf/mir walk/) (Dweep et al., 2011) databases. The miRNA-gene pairs that appeared in at least one database were selected. The miRNA-gene network was constructed by Cytoscape (Shannon et al., 2003) software.
2.4. Pathway enrichment analysis of miRNAs
The Kyoto Encyclopedia of Genes and Genomes (KEGG) pathway involved in miRNA target genes was predicted by R package clusterProfiler (http://bioconductor.org/packages/2.8/bioc/html/clusterProfiler.html) (Yu et al., 2012). Similarly, p-value was adjusted by the BH method and the adjusted p-value less than 0.05 was chosen as the threshold.
2.5. Protein/protein interaction network of miRNA target genes
Protein interactions between target genes of differentially expressed miRNAs were predicted by the STRING (Search Tool for the Retrieval of Interacting Genes, http://string-db.org) (Szklarczyk et al., 2014) database according to the following prediction methods: neighborhood, gene fusion, co-occurrence, coexpression experiments, databases, and text mining. For each PPI with confidence scores no less than 0.4, the protein nodes of them were both target genes of differentially expressed miRNAs. The PPI network was constructed by Cytoscape software.
Subsequently, the network clustering tool MCODE (Molecular Complex Detection) was used to find network modules, and that with the maximum score was selected. The KEGG pathway enriched by the network module was analyzed by R clusterProfiler.
2.6. Melanoma stage analysis
The differential expression of miRNAs in melanoma stage I, stage II, and stage III with congenital nevi samples was, respectively, compared to identify the tumor stage-dependent difference in miRNA expression.
The similarities and differences of miRNA expression in three tumor stages were analyzed by VennPlex (www.irp.nia.nih.gov/bioinformatics/vennplex.html) (Cai et al., 2013) based on the differentially expressed miRNAs and the log2FC values.
3. Results
3.1. Differentially expressed miRNAs
A total of 6 upregulated and 23 downregulated miRNAs were obtained between primary melanoma and congenital nevi samples. The heatmap of differential expression of miRNA is shown in Figure 1. The top three upregulated miRNAs were miR-21 (log2FC = 1.378), miR-202 (log2FC = 1.123), and miR-142-5p (log2FC = 0.797), while the top three downregulated miRNAs were miR-125b (log2FC = −2.736), miR-26a (log2FC = −1.934), and miR-211 (log2FC = −1.787).

Heat map diagram of differentially expressed miRNA loci. Black represents overexpression of miRNAs and white represents underexpression.
3.2. Target genes and the regulatory network
The experimentally verified target genes of differentially expressed miRNAs were screened from databases, and the miRNA-associated gene regulatory network is shown in Figure 2. There were 274 nodes and 307 miRNA-target pairs in the network. Four upregulated miRNAs, including miR-142-5p, miR-155, miR-299-3p, and miR-21, and 18 downregulated miRNAs, including miR-125b, miR-125a-5p, and let-7a, were involved in the network.
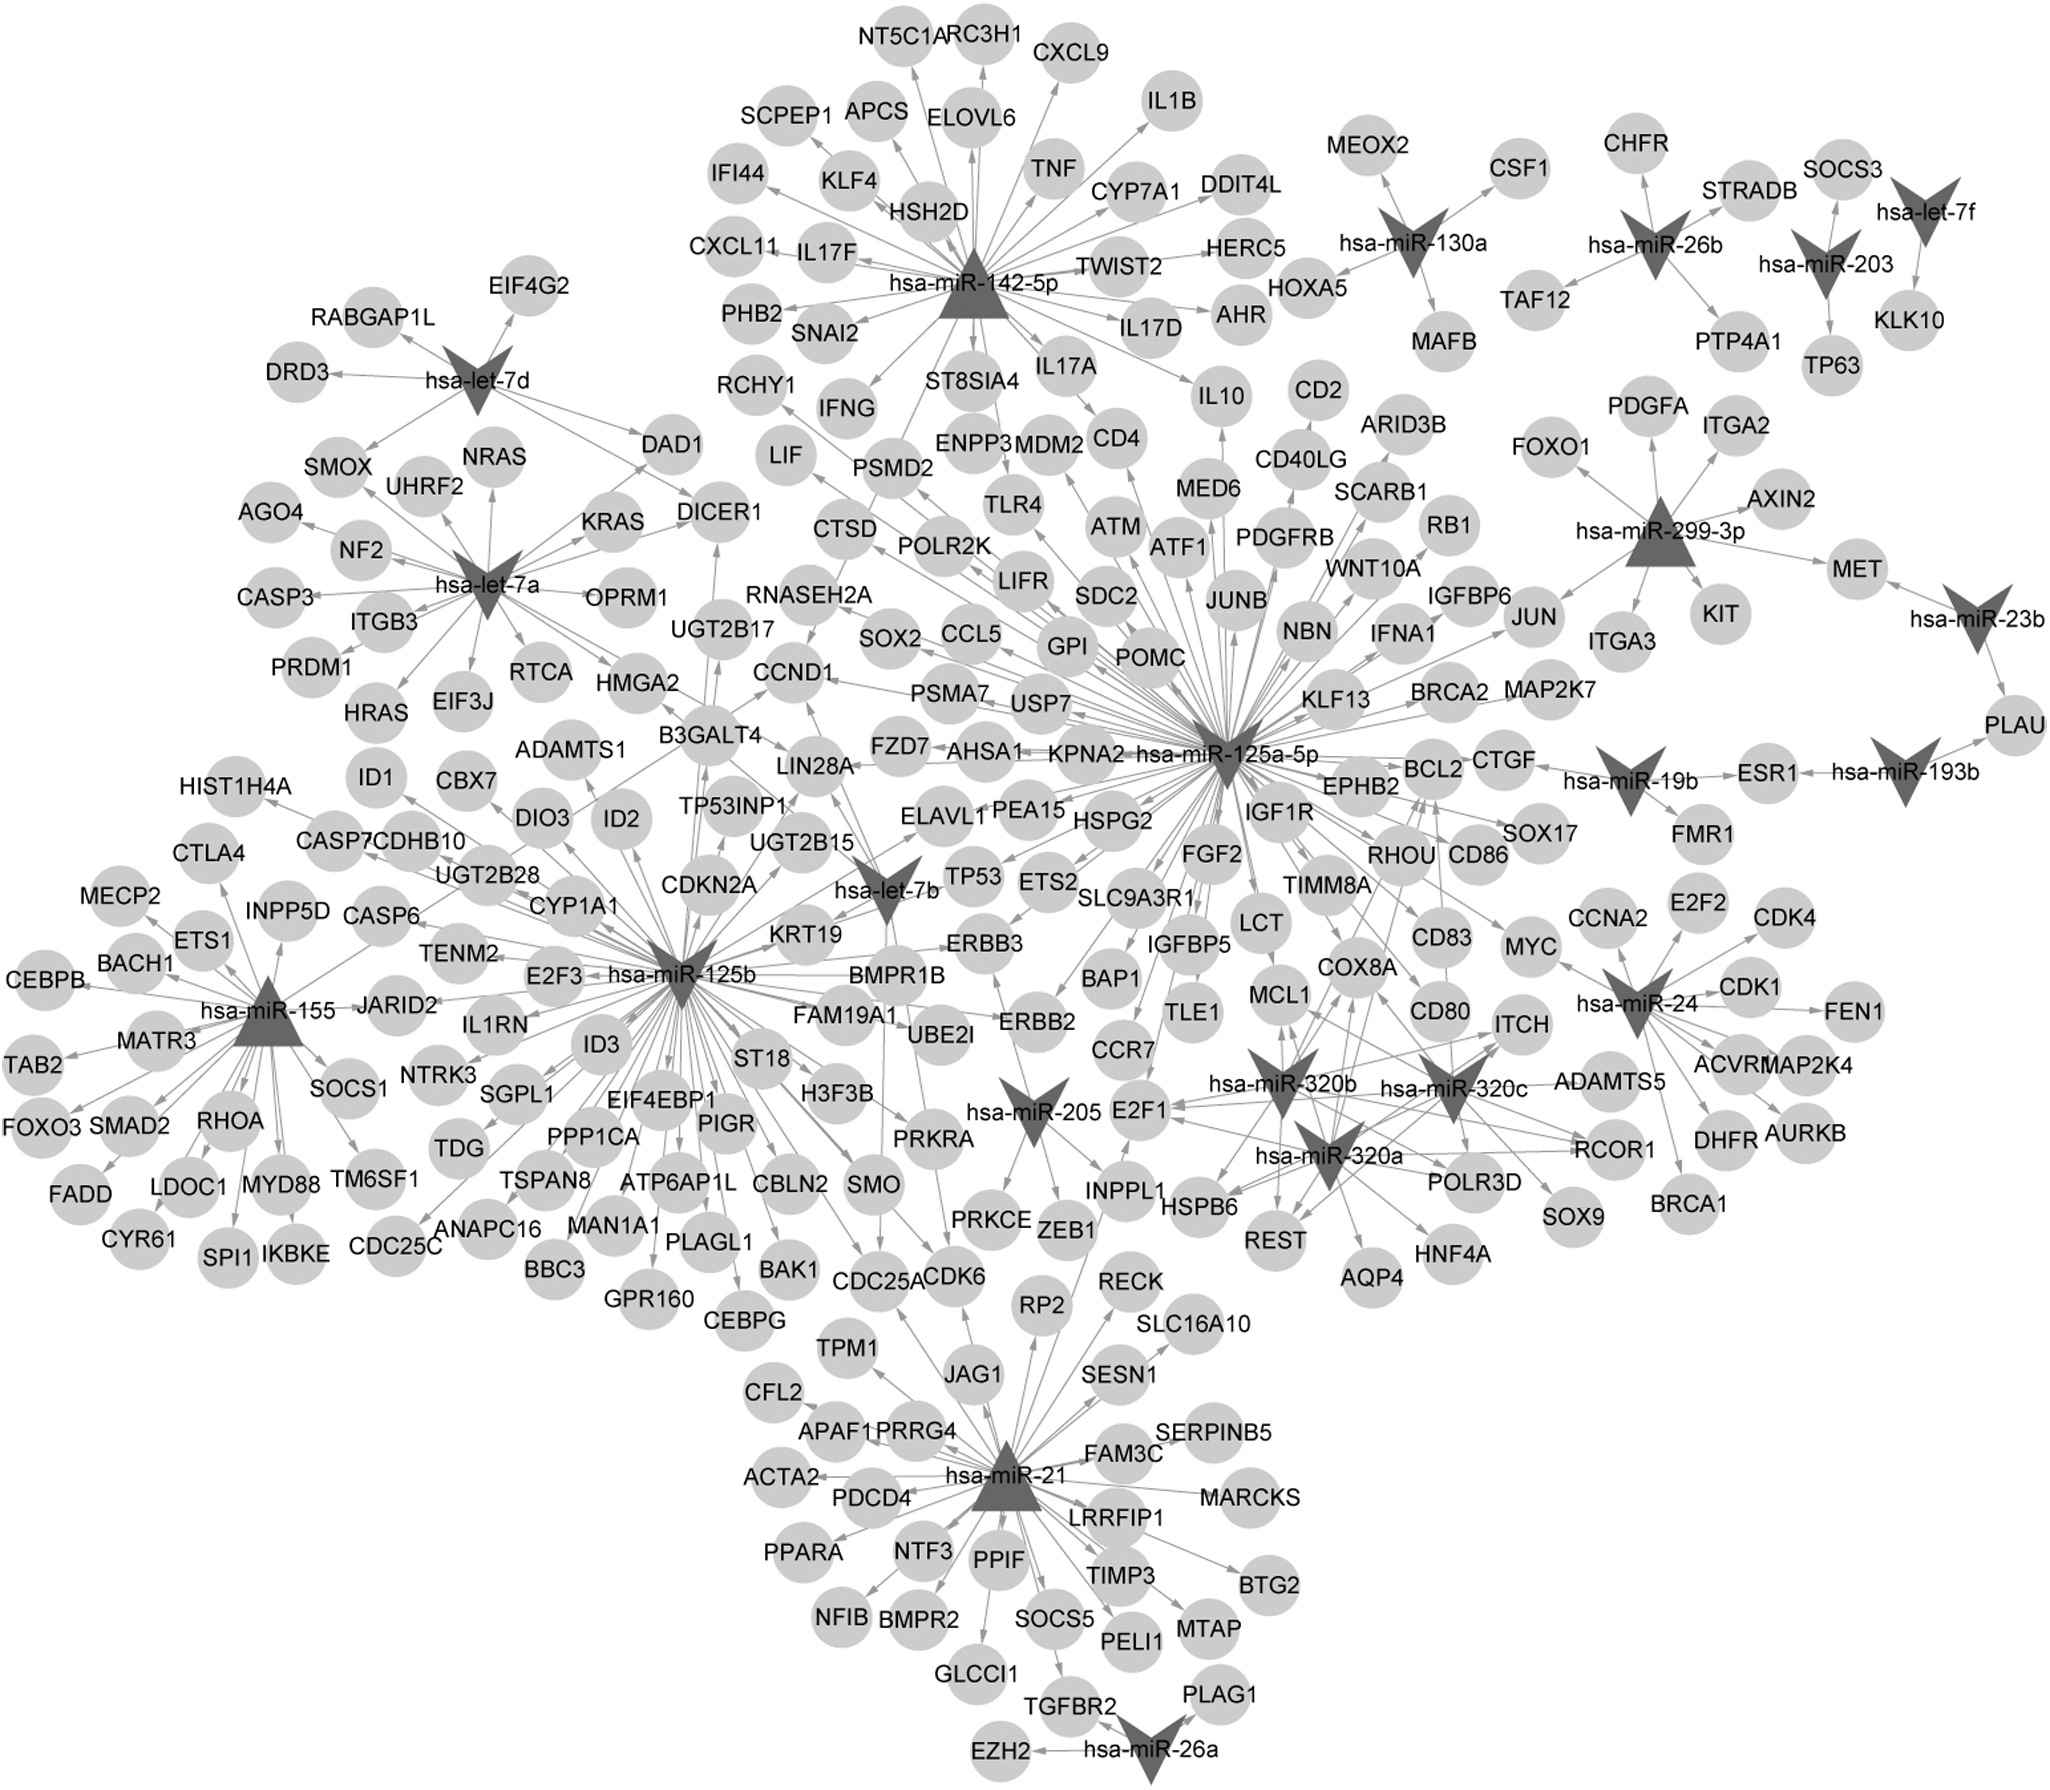
Differentially expressed miRNA-dependent gene regulatory network. Triangles represent upregulated miRNAs, and V-shaped nodes indicate downregulated miRNAs, while circles denote target genes and the edges represent interactions between nodes.
3.3. Differentially expressed miRNA-related Kyoto Encyclopedia of Genes and Genomes pathway
Predicted pathways targeted by miRNAs are displayed in Figure 3. Especially, miR-125b, miR-125a-5p, let-7b, let-7a, miR-23b, miR-24, and miR-299-3p were significantly associated with the pathway in melanoma (hsa05218).

Pathways enriched by differentially expressed miRNAs. The left vertical axis is a list of pathways. The horizontal axis represents miRNAs. Gene ratio is the percentage of genes regulated by each miRNA.
3.4. Protein/protein interaction network and module
The complex PPI network was composed of 222 nodes and 1929 pair interactions. Therefore, functional modules considered functionally homogeneous and likely to capture the biologically meaningful interactions in large-scale PPI data were identified (Fig. 4). The modularity score of a significant network module was 24.778, which is obviously higher than the others (the score of a second module was 8.25). A total of 37 nodes and 446 interactions were found in the module. Moreover, pathways enriched by target genes in module, including pathways in cancer, melanoma, and bladder cancer, are listed in Table 1.
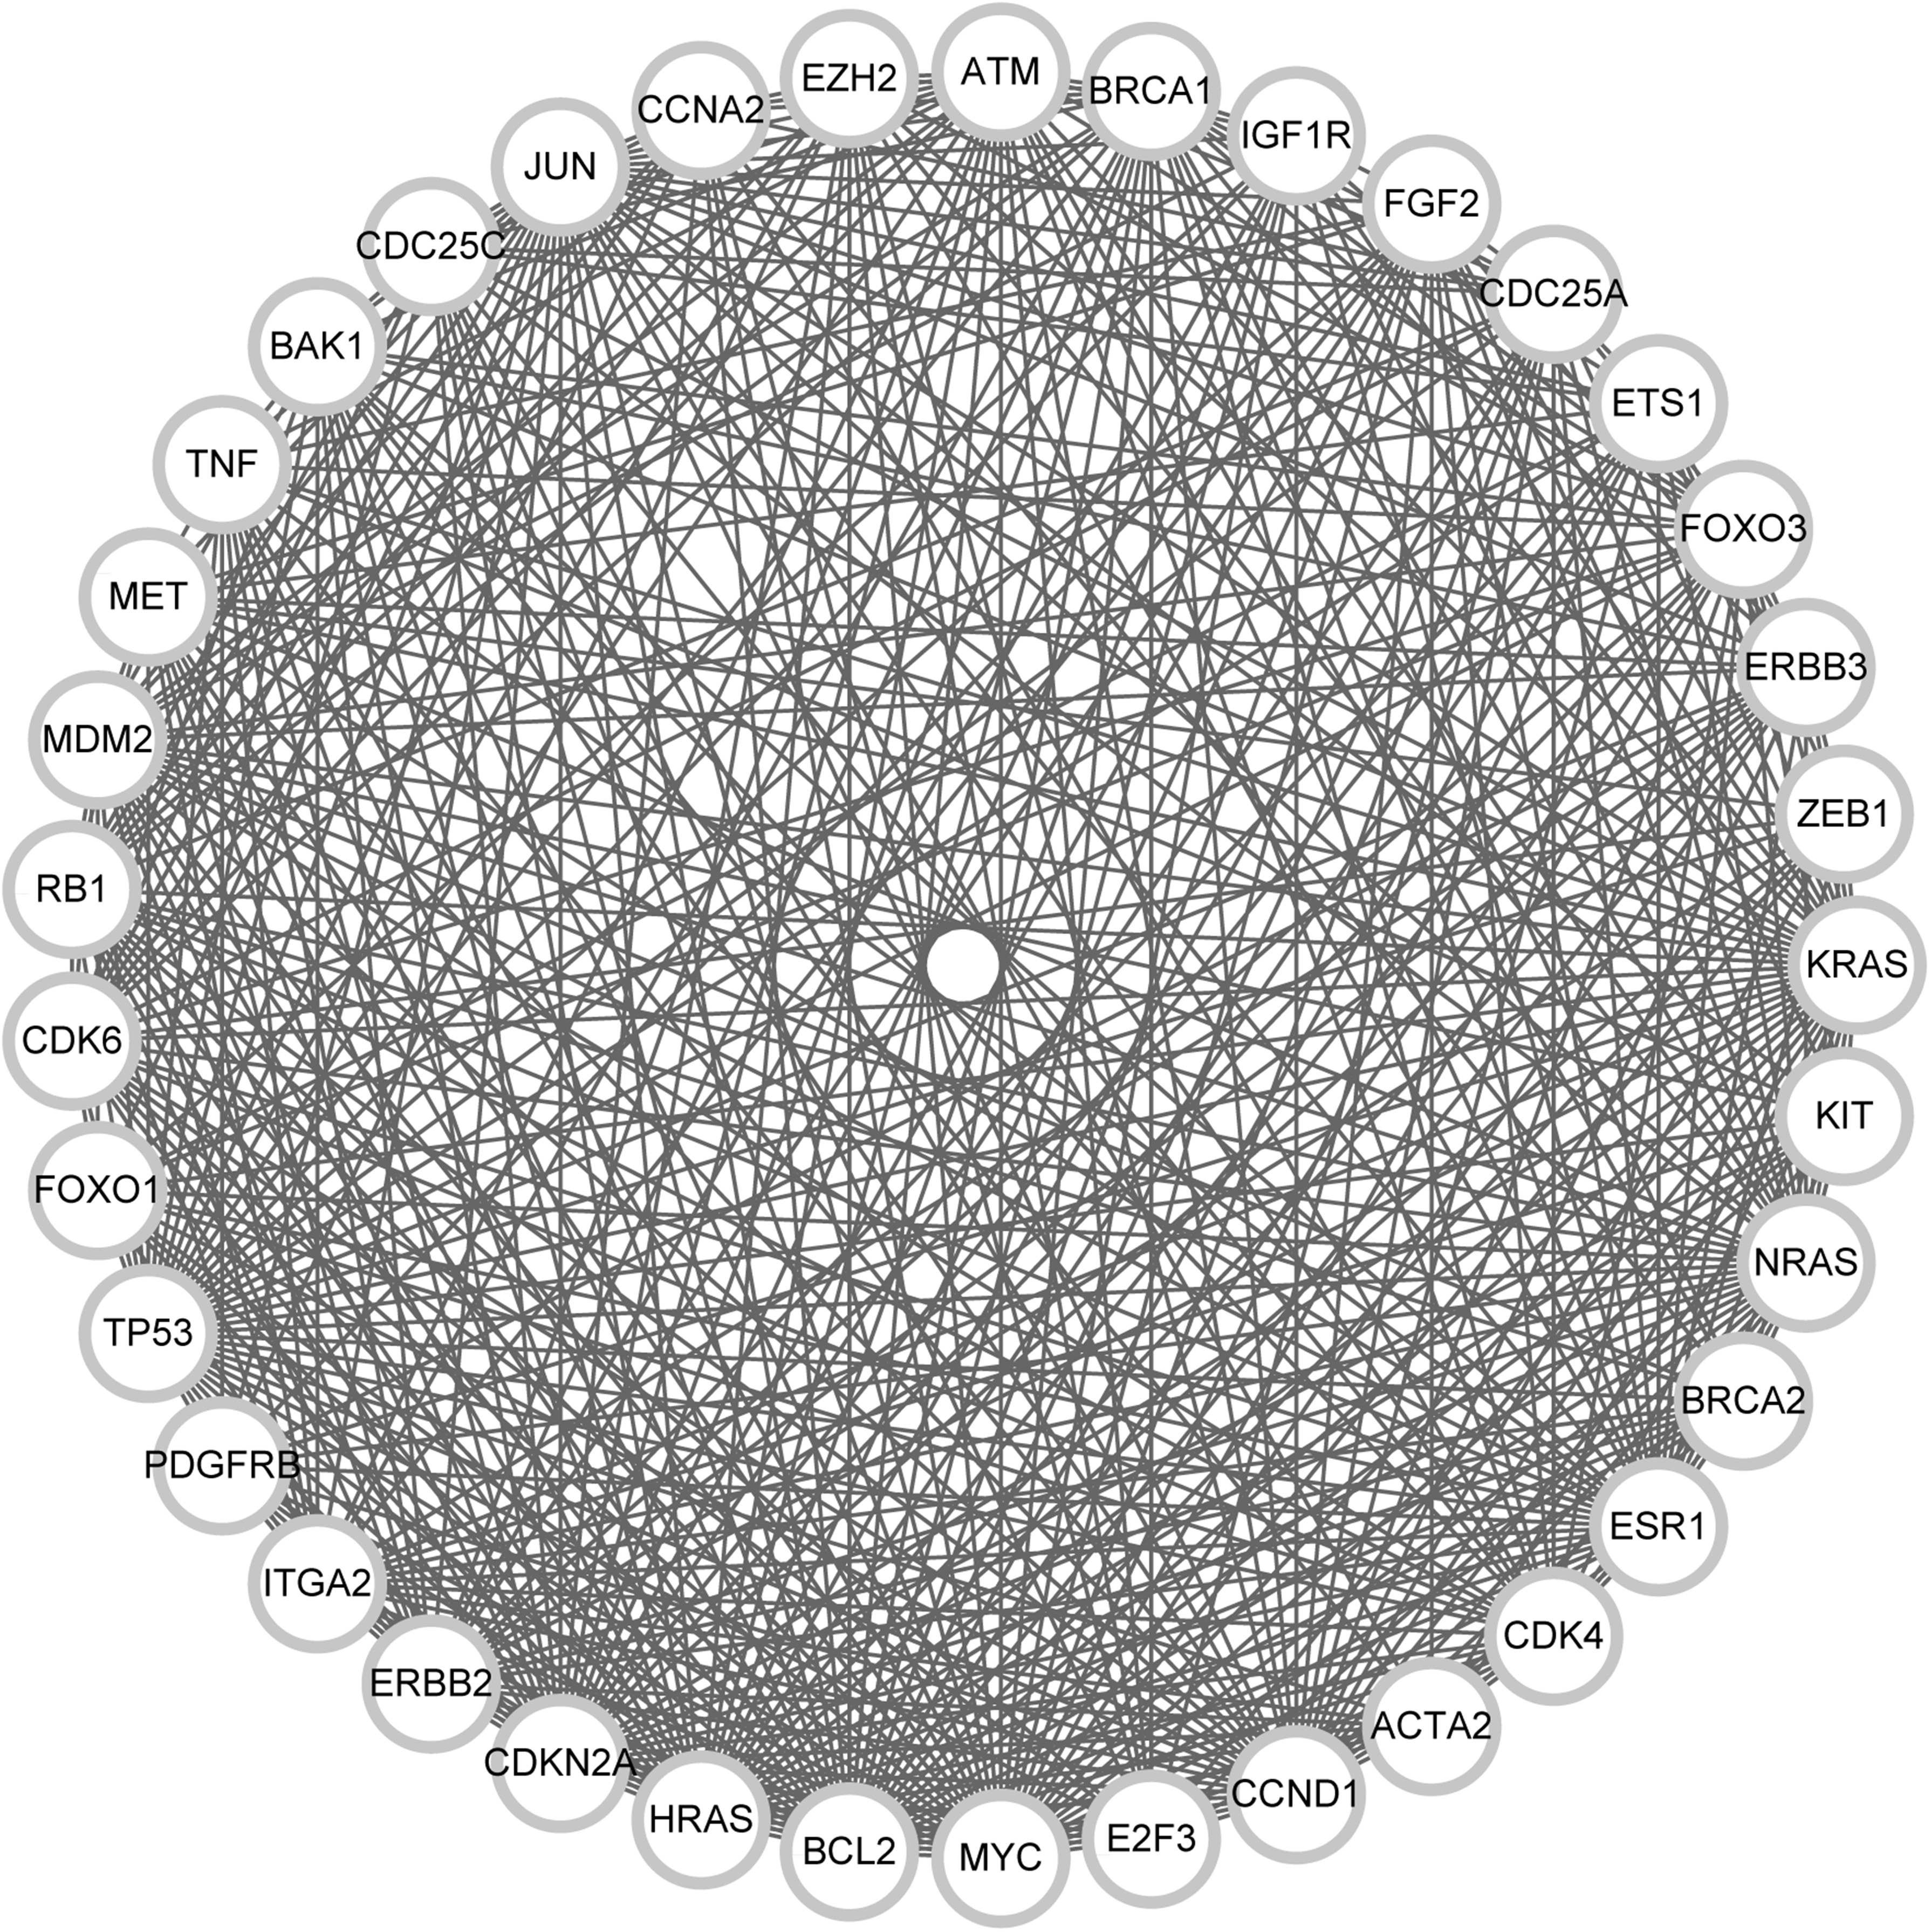
A significant protein/protein interaction network module. The white nodes denote target genes, and the edges represent interactions between nodes.
Pathways Enriched by Target Genes in Module
3.5. Melanoma stage-related differentially expressed miRNAs
A total of 7, 6, and 3 upregulated miRNAs and 44, 24, and 6 downregulated miRNAs were identified in stage I, II, and III primary melanoma, respectively. The Venn diagram of differentially expressed miRNAs is shown in Figure 5. MiR-142-5p was upregulated in three stages, while miR-550, miR-1826, miR-1201, miR-205, and miR-125b were all downregulated.
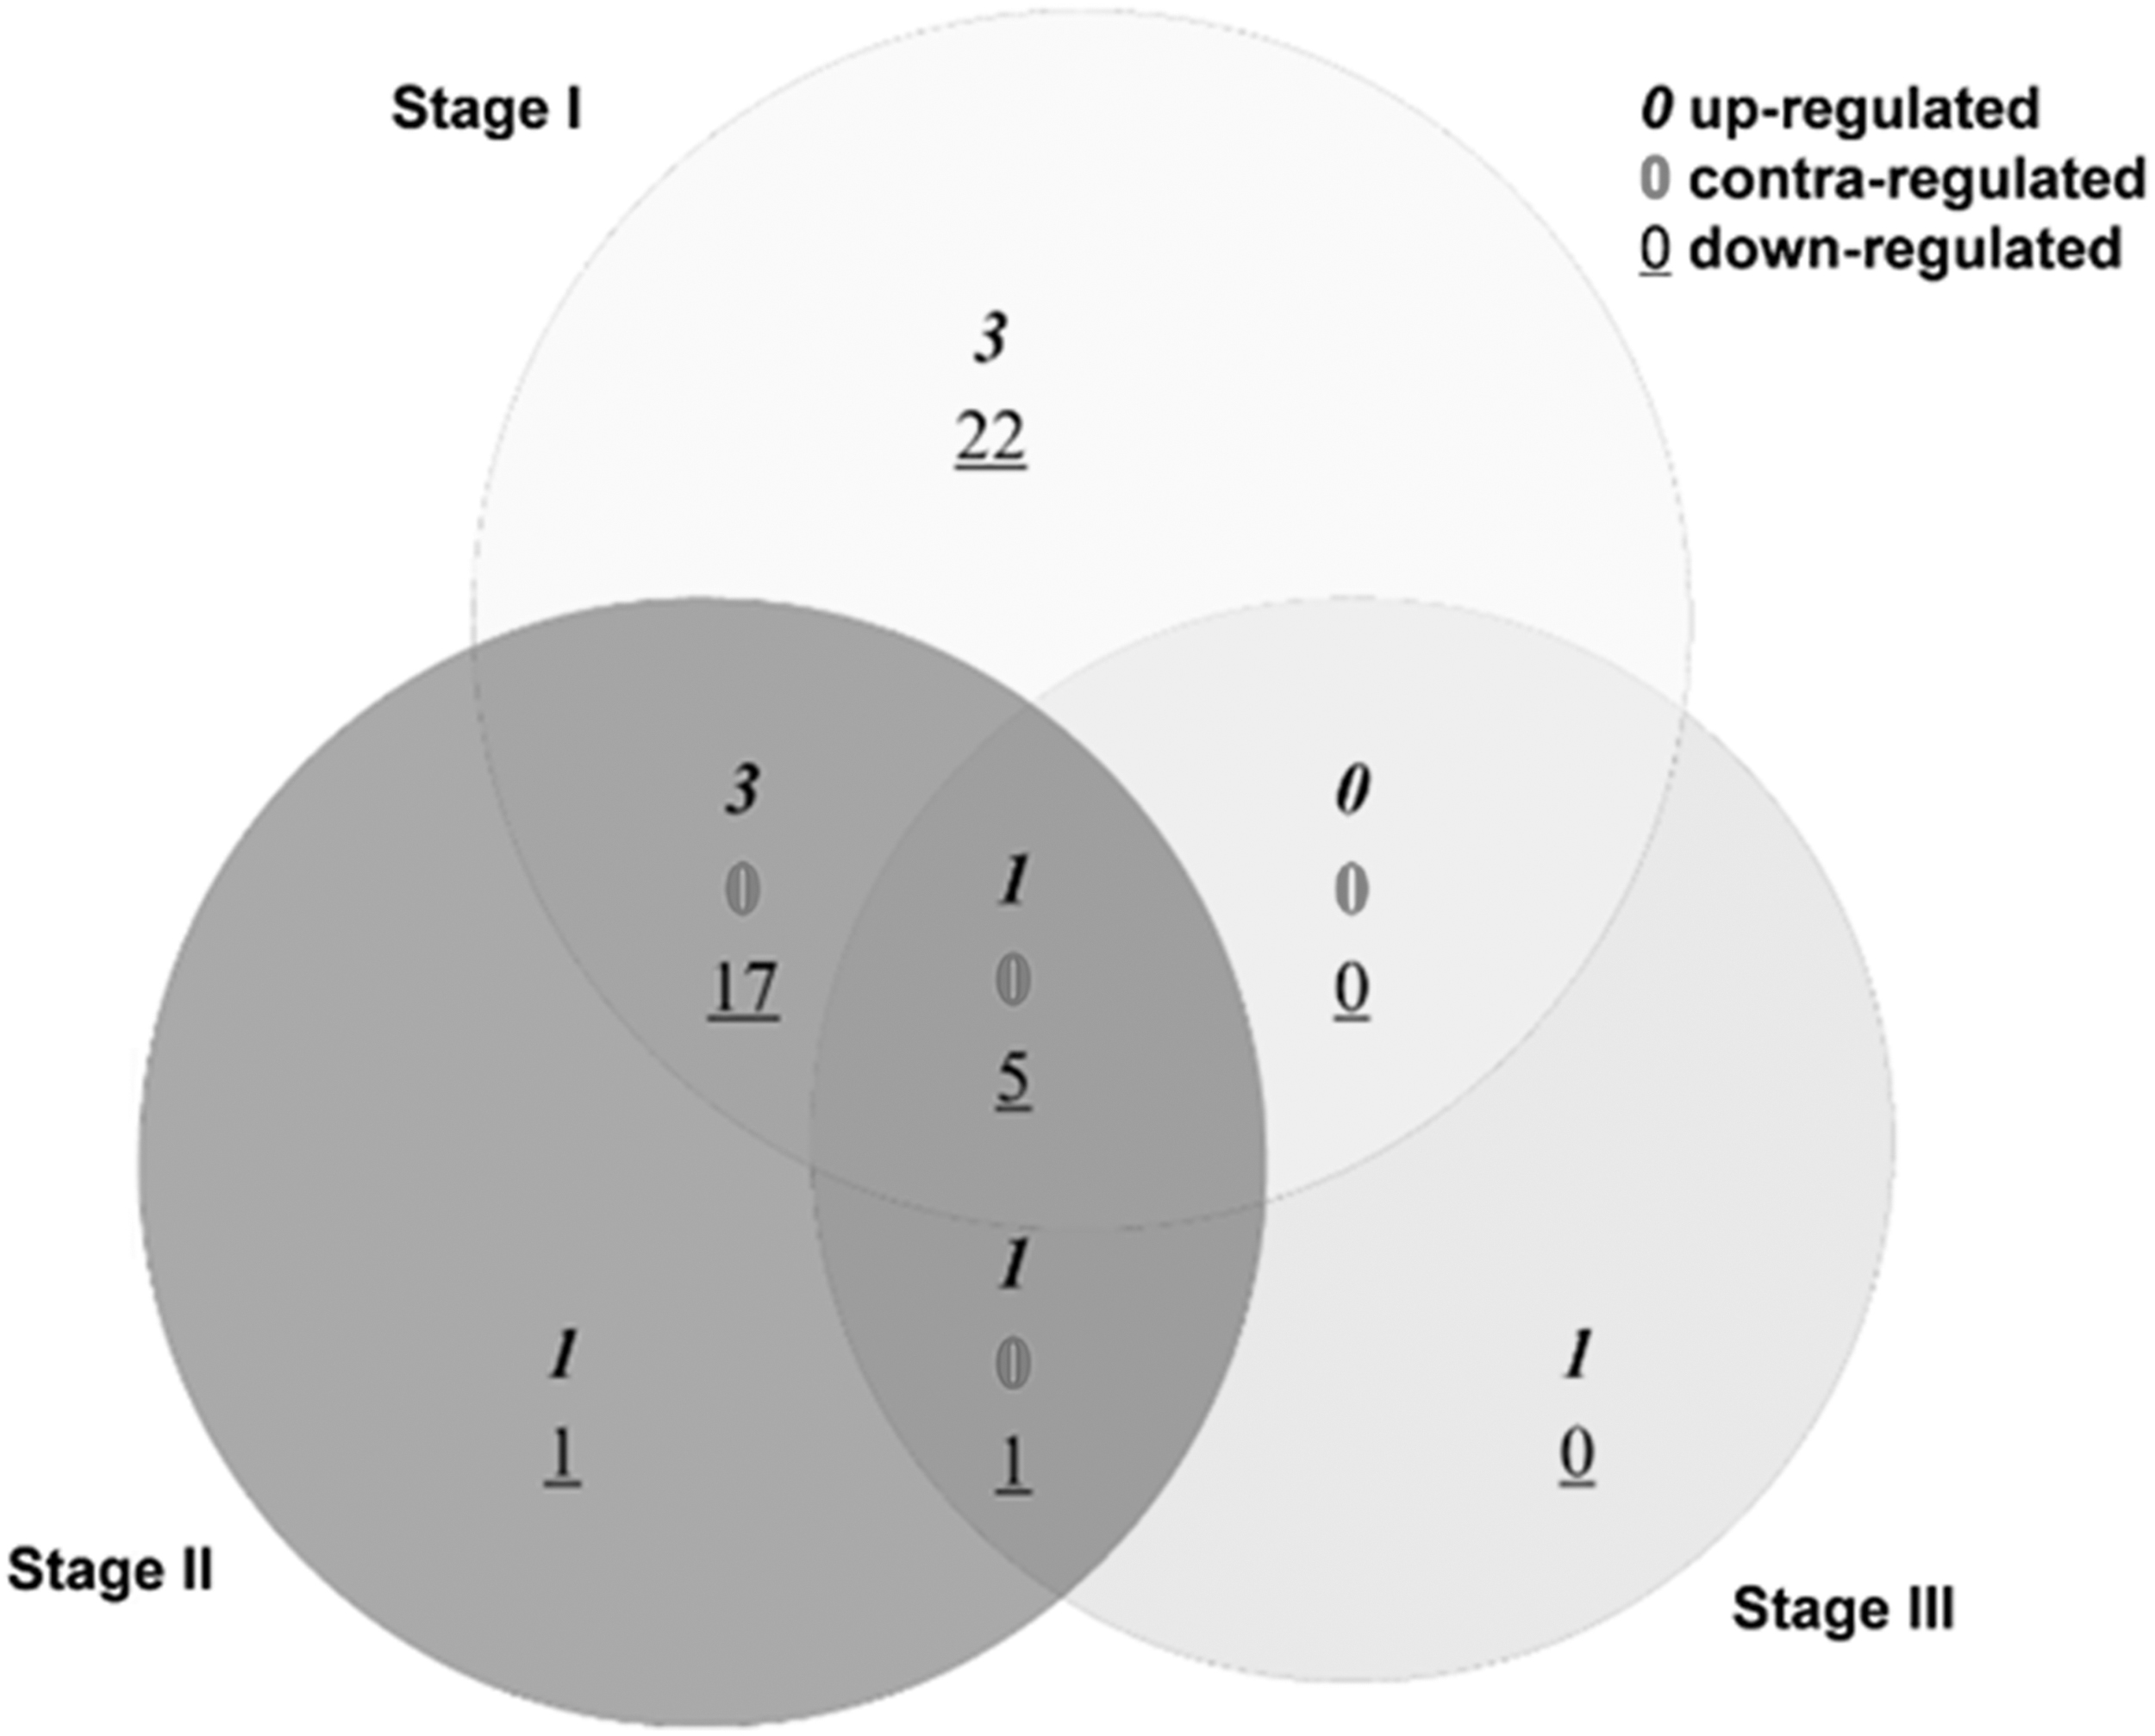
Venn diagram of differentially expressed miRNAs in three stages of primary melanoma.
4. Discussion
Primary melanoma has been receiving increasing attention in the world. In the present study, differentially expressed miRNAs, including 6 upregulated in primary melanoma and 23 upregulated in congenital nevi samples, were found. Besides, the miRNA-associated gene regulatory network, miRNA-related KEGG pathway enrichment analysis, such as melanoma and PPI network analysis, was performed. Finally, the melanoma stage-related overexpressed miR-142-5p, and the downregulated miR-550, miR-1826, miR-1201, miR-205, and miR-125b were identified. These miRNAs may be important in the development of primary melanoma.
Pathway enrichment analysis of differentially expressed miRNAs indicated that miR-125b (Kappelmann et al., 2013), miR-125a-5p (Chen et al., 2010), let-7b (Schultz et al., 2008), and let-7a (Müller and Bosserhoff, 2008) that have been experimentally proven to be related with melanoma, and predicted miRNAs, including miR-23b (Philippidou et al., 2010), miR-24 (Sand et al., 2013), and miR-299-3p (Mueller et al., 2009), were associated with pathway in melanoma. In addition, the same analysis of genes in PPI network module revealed that targets were enriched in cancer-related pathways, such as pathways in cancer, melanoma, and bladder cancer. Besides, the regulatory network analysis showed that miR-125b, miR-299-3p, miR-125a/b, and let-7a play vertical regulatory roles on targets. The above results illustrated the reliability of our study. Moreover, in addition to miR-125b (Kappelmann et al., 2013) and miR-205 (Hanna et al., 2012), the upregulated miR-142-5p and the downregulated miR-550, miR-1826, and miR-1201 were also melanoma stage-related differentially expressed miRNAs.
The regulatory effects of miR-142-5p on genes were experimentally validated as shown in the regulatory network. There was little study about the relationship between miR-142-5p and primary melanoma, however, it was found involved in acute leukemias (Dahlhaus et al., 2013), systemic lupus erythematosus (Ding et al., 2012), nonsmall-cell lung cancer (Lei et al., 2014), osteosarcoma (Zheng et al., 2015), and so on. Moreover, its target genes, including IL17A/D/F (Martiniuk et al., 2010), TNF (Kulkarni and Baltimore, 2013), and IL1B/10 (Wiguna, 2014), participated in melanoma tumor progression. This indicated the potential contribution of miR-142-5p to primary melanoma. Tian et al. (2012) verified the upregulation of miR-550a in hepatocellular carcinoma and hinted a role of miR-550a in cancer cell migration and invasion. Disregulated miR-550 and let-7e were found in gastrointestinal stromal tumors (Lopez-Guerrero et al., 2014). Previous studies have indicated the aberrant miR-1826 expression in the initiation and progression of malignancies (Hirata et al., 2012; Hu et al., 2016). miR-1201 expression was correlated to the grade of neuroendocrine lung cancers (Mairinger et al., 2014). However, there are few rare experimental data about miR-1201 and other cancers. Therefore, overexpressed miR-142-5p would also be important in the development of primary melanoma; moreover, downexpressed miR-550a, miR-1826, and miR-1201 may be novel miRNAs involving the pathogenesis of primary melanoma.
5. Conclusion
In conclusion, we identified differential expression patterns of miRNAs and reported some miRNAs between primary melanoma and congenital nevi, some of which have been validated to be associated with primary melanoma, such as miR-125a/b, let-7a/b, and miR-205. In addition, some other miRNAs, including miR-142-5p, miR-550a, miR-1826, and miR-1201, were also found in different stages of primary melanoma. These four miRNAs were considered to be novel biomarkers for the development of primary melanoma. This study may provide a novel diagnostic biomarker for primary melanoma and may offer new clues to explore the molecular mechanism of melanoma metastasis. However, further study of these miRNAs in more microarray data sets and experimental studies are still needed.
Footnotes
Author Disclosure Statement
The authors declare they have no competing financial interests.
Funding Information
The authors received no funding for this article.