
Abstract
DNA methylation abnormalities are frequent events in early tumors. DNA methylation is relatively stable over time and can be detected in blood. Therefore, DNA methylation has a great potential to become an early diagnostic biomarker of cancers. To find potential diagnostic markers for lung squamous cell carcinoma (LUSC), a method for identifying LUSC-specific candidate diagnostic markers was proposed. We screened 6 LUSC-specific CpGs by comparing the methylation profiles of 172 samples from LUSC patients, 42 normal lung samples, 1306 samples from patients with other cancers, which was collected from The Cancer Genome Atlas (TCGA) database, and 184 normal blood samples, which was collected from Gene Expression Omnibus (GEO) database. A support vector machine model was built based on the methylation levels of the candidate diagnostic biomarkers, and we optimized the model by sixfold cross-validation. The combination of six sites achieved 93%–99% sensitivity in predicting LUSC, 100% specificity in excluding normal samples, and 99.55% specificity in excluding non-LUSC samples. In addition, a diagnostic model was established by using six LUSC-specific biomarkers, and the sensitivity and specificity of LUSC stage I samples were 95.2% and 99.4%. At the same time, genes for six LUSC-specific CpGs localization are closely related to cancer occurrence, which indicates that six LUSC-specific CpGs can be used as candidate biomarkers for LUSC diagnosis. Overall, our study provides promising biomarkers for the diagnosis of LUSC.
1. Introduction
Detection of serum tumor markers is a widely used method for screening and diagnosing lung cancer. Serum tumor markers with better specificity for lung squamous cell carcinoma (LUSC) are squamous cell carcinoma (SCC) antigen and cytokeratin 19 fragment (CYFRA21-1). SCC antigen is a specific marker for LUSC, and the SCC positive rate in patients with LUSC is 40%–55% (Wang et al., 2013). The cytokeratin 19 fragment is the most sensitive tumor marker of non-small cell lung cancer (NSCLC), especially for LUSC. CYFRA21-1 is more than 70% sensitive to LUSC and is dependent on tumor stage. Advanced tumors (T3 and T4) showed higher serum CYFRA 21-1 levels (p < 0.05) (Moro et al., 1995). Therefore, more effective biomarkers are needed to improve the accuracy of early diagnosis of LUSC.
DNA methylation abnormalities have been observed in various cancers, and the process is reversible. Hypermethylation of the promoter region and hypomethylation of the whole-genome sequencing are ubiquitous in a variety of tumor cells (Baylin and Jones et al., 2011). The hypomethylation of the whole-genome sequencing is common in highly and moderately repetitive DNA sequences and plays a key role in chromosomal instability (Karpf and Sei-Ichi et al., 2005; Baba et al., 2010), and the hypermethylation of the promoter region of the gene was generally associated with gene silencing (Taby and Issa, 2010). DNA methylation abnormalities are frequent events in early tumors (Jin-Ge et al., 2014). In addition, DNA methylation is relatively stable over time and can be detected in the blood (Laird, 2003). Therefore, DNA methylation has great potential to become an early diagnostic biomarker for cancers.
More methylation-based biomarkers have been developed to aid in the early diagnosis of cancer (Leygo et al., 2017). Sharma et al. (2007) used p16INK4A, p14ARF, Cyclin D2, and Slit2 for combined detection of breast cancer (BRCA) with 100% specificity, 83% sensitivity, and tumor and serum compliance. Anglim et al. (2008) used GDNF, MTHFR, OPCML, TNFRSF25, TCF21, PAX8, PTPRN2, and PITX2 to distinguish tumors from normal tissues in LUSC patients with a sensitivity and specificity of 95.6%. Cheng et al. (2018) used six CpGs to achieve specific diagnosis of hepatic carcinoma (HCC), and the combination of six sites achieved about 92% sensitivity in predicting HCC and about 98% specificity in excluding normal liver, and it has about 98% specificity in terms of excluding other cancers. The above study allows us to observe the feasibility of methylation for early diagnosis of cancer and cancer-specific diagnosis.
To find potential specific diagnostic markers for LUSC, we proposed a method for identifying LUSC-specific candidate diagnostic markers. In this study, we identified six LUSC-specific methylation candidate biomarkers by comparing LUSC with normal samples and other cancer types. The combination of six sites achieved 93%–99% sensitivity in predicting LUSC, 100% specificity in excluding normal samples, and about 99% specificity in excluding non-LUSC samples, which indicates that the six LUSC-specific CpGs can be used as candidate biomarkers for LUSC diagnosis and provides potential markers for early diagnosis of LUSC.
2. Materials and Methods
2.1. Data preparation
Methylation data and clinical data of BRCA (95 normal, 126 cancer), kidney renal clear cell carcinoma (KIRC, 154 normal, 152 cancer), kidney renal papillary cell carcinoma (KIRP, 45 normal, 168 cancer), liver hepatocellular carcinoma (LIHC, 49 normal, 174 cancer), LUSC (42 normal, 172 cancer), and thyroid cancer (THCA, 56 normal, 287 cancer) were collected from The Cancer Genome Atlas (TCGA) project (https://portal.gdc.cancer.gov/), where the cancer samples were in the early stage I. In addition, blood samples from 184 young Finns (GSE69270) were collected from the Gene Expression Omnibus (GEO) database (Kananen et al., 2016). The methylation array platform was HumanMethylation450 BeadChip (GPL13534), and the CpG annotations were downloaded from the ENCODE project (http://genome.ucsc.edu/ENCODE/downloads.html) (Yang et al., 2016).
2.2. Differential methylation screening
The number of the site with “NA” greater than 10% in all samples were deleted, and the remaining “NA” was interpolated using the K-nearest neighbor interpolation method (Wang et al., 2006). Then, one-way analysis of variance was used to identify the differential CpGs between the two types of samples. The p-value was adjusted using the false discovery rate (FDR) method, and CpGs with an FDR less than 0.05 and an absolute value of β differences greater than 0.2 were considered to be differentially methylated.
2.3. Identification of LUSC-specific candidate diagnostic markers
This article proposes a recognition process for LUSC-specific diagnostic markers by comparing LUSC with normal samples and other cancer type samples; the process is shown in Figure 1.

Protocol for finding candidate diagnostic biomarkers for LUSC. LUSC, lung squamous cell carcinoma; TCGA, The Cancer Genome Atlas.
The specific operation process is as follows:
The first step, identified the differential methylation CpGs of LUSC occurrence. First, identified the differential methylation CpGs between normal and LUSC samples. Second, paired the normal and LUSC samples and deleted the CpGs without significant differences in the paired samples. Third, compared all LUSC samples with the blood samples of the normal population and deleted the CpGs without significant differences in the two types of samples (Cheng et al., 2018).
The second step, identified specific differential methylation CpGs in LUSC. First, the CpGs with a difference in the mean value of methylation between the normal sample and the cancer sample greater than 0.1 in other cancer types were deleted. Second, compared the methylation mean of normal samples of different cancer types and deleted CpGs with a difference in the methylation mean of greater than 0.1 in normal samples of different cancer types.
The third step, identified LUSC-specific CpGs. First, identified the differential methylation CpGs between LUSC and non-LUSC samples. Second, the CpGs with significant differences between LUSC and non-LUSC samples were screened by using confidence intervals (Wen et al., 2017). Third, an elastic network was used to screen CpGs that significantly contribute to the classification of LUSC samples and non-LUSC samples (Wang et al., 2018). Fourth, CpGs ranked first in the elastic network coefficient were extracted as the final candidate biomarker for diagnosis.
2.4. Evaluation of candidate diagnostic markers
A support vector machine model was constructed based on the methylation level of candidate diagnostic biomarkers. This model was used to predict LUSC and non-LUSC samples, and the sensitivity and specificity were calculated to evaluate the accuracy of the predictive model; the model was optimized using sixfold cross-validation. The sensitivity (SEN) and specificity (SPE) formulas are as follows:
Positive samples are LUSC stage I samples, negative samples are non-LUSC samples, TP indicates the number of LUSC samples correctly classified, TN indicates the number of non-LUSC samples correctly classified, FP indicates the number of samples in which non-LUSC samples are misclassified as LUSC, and FN indicates the number of samples in which LUSC is misclassified as non-LUSC.
3. Results
3.1. Differential methylation analysis
This section analyzes the distribution of differential methylation of six solid tumor whole-genome sequences, promoter regions (Promoter), and CpG islands in promoter region (Pro and CGI), as shown in Figure 2.
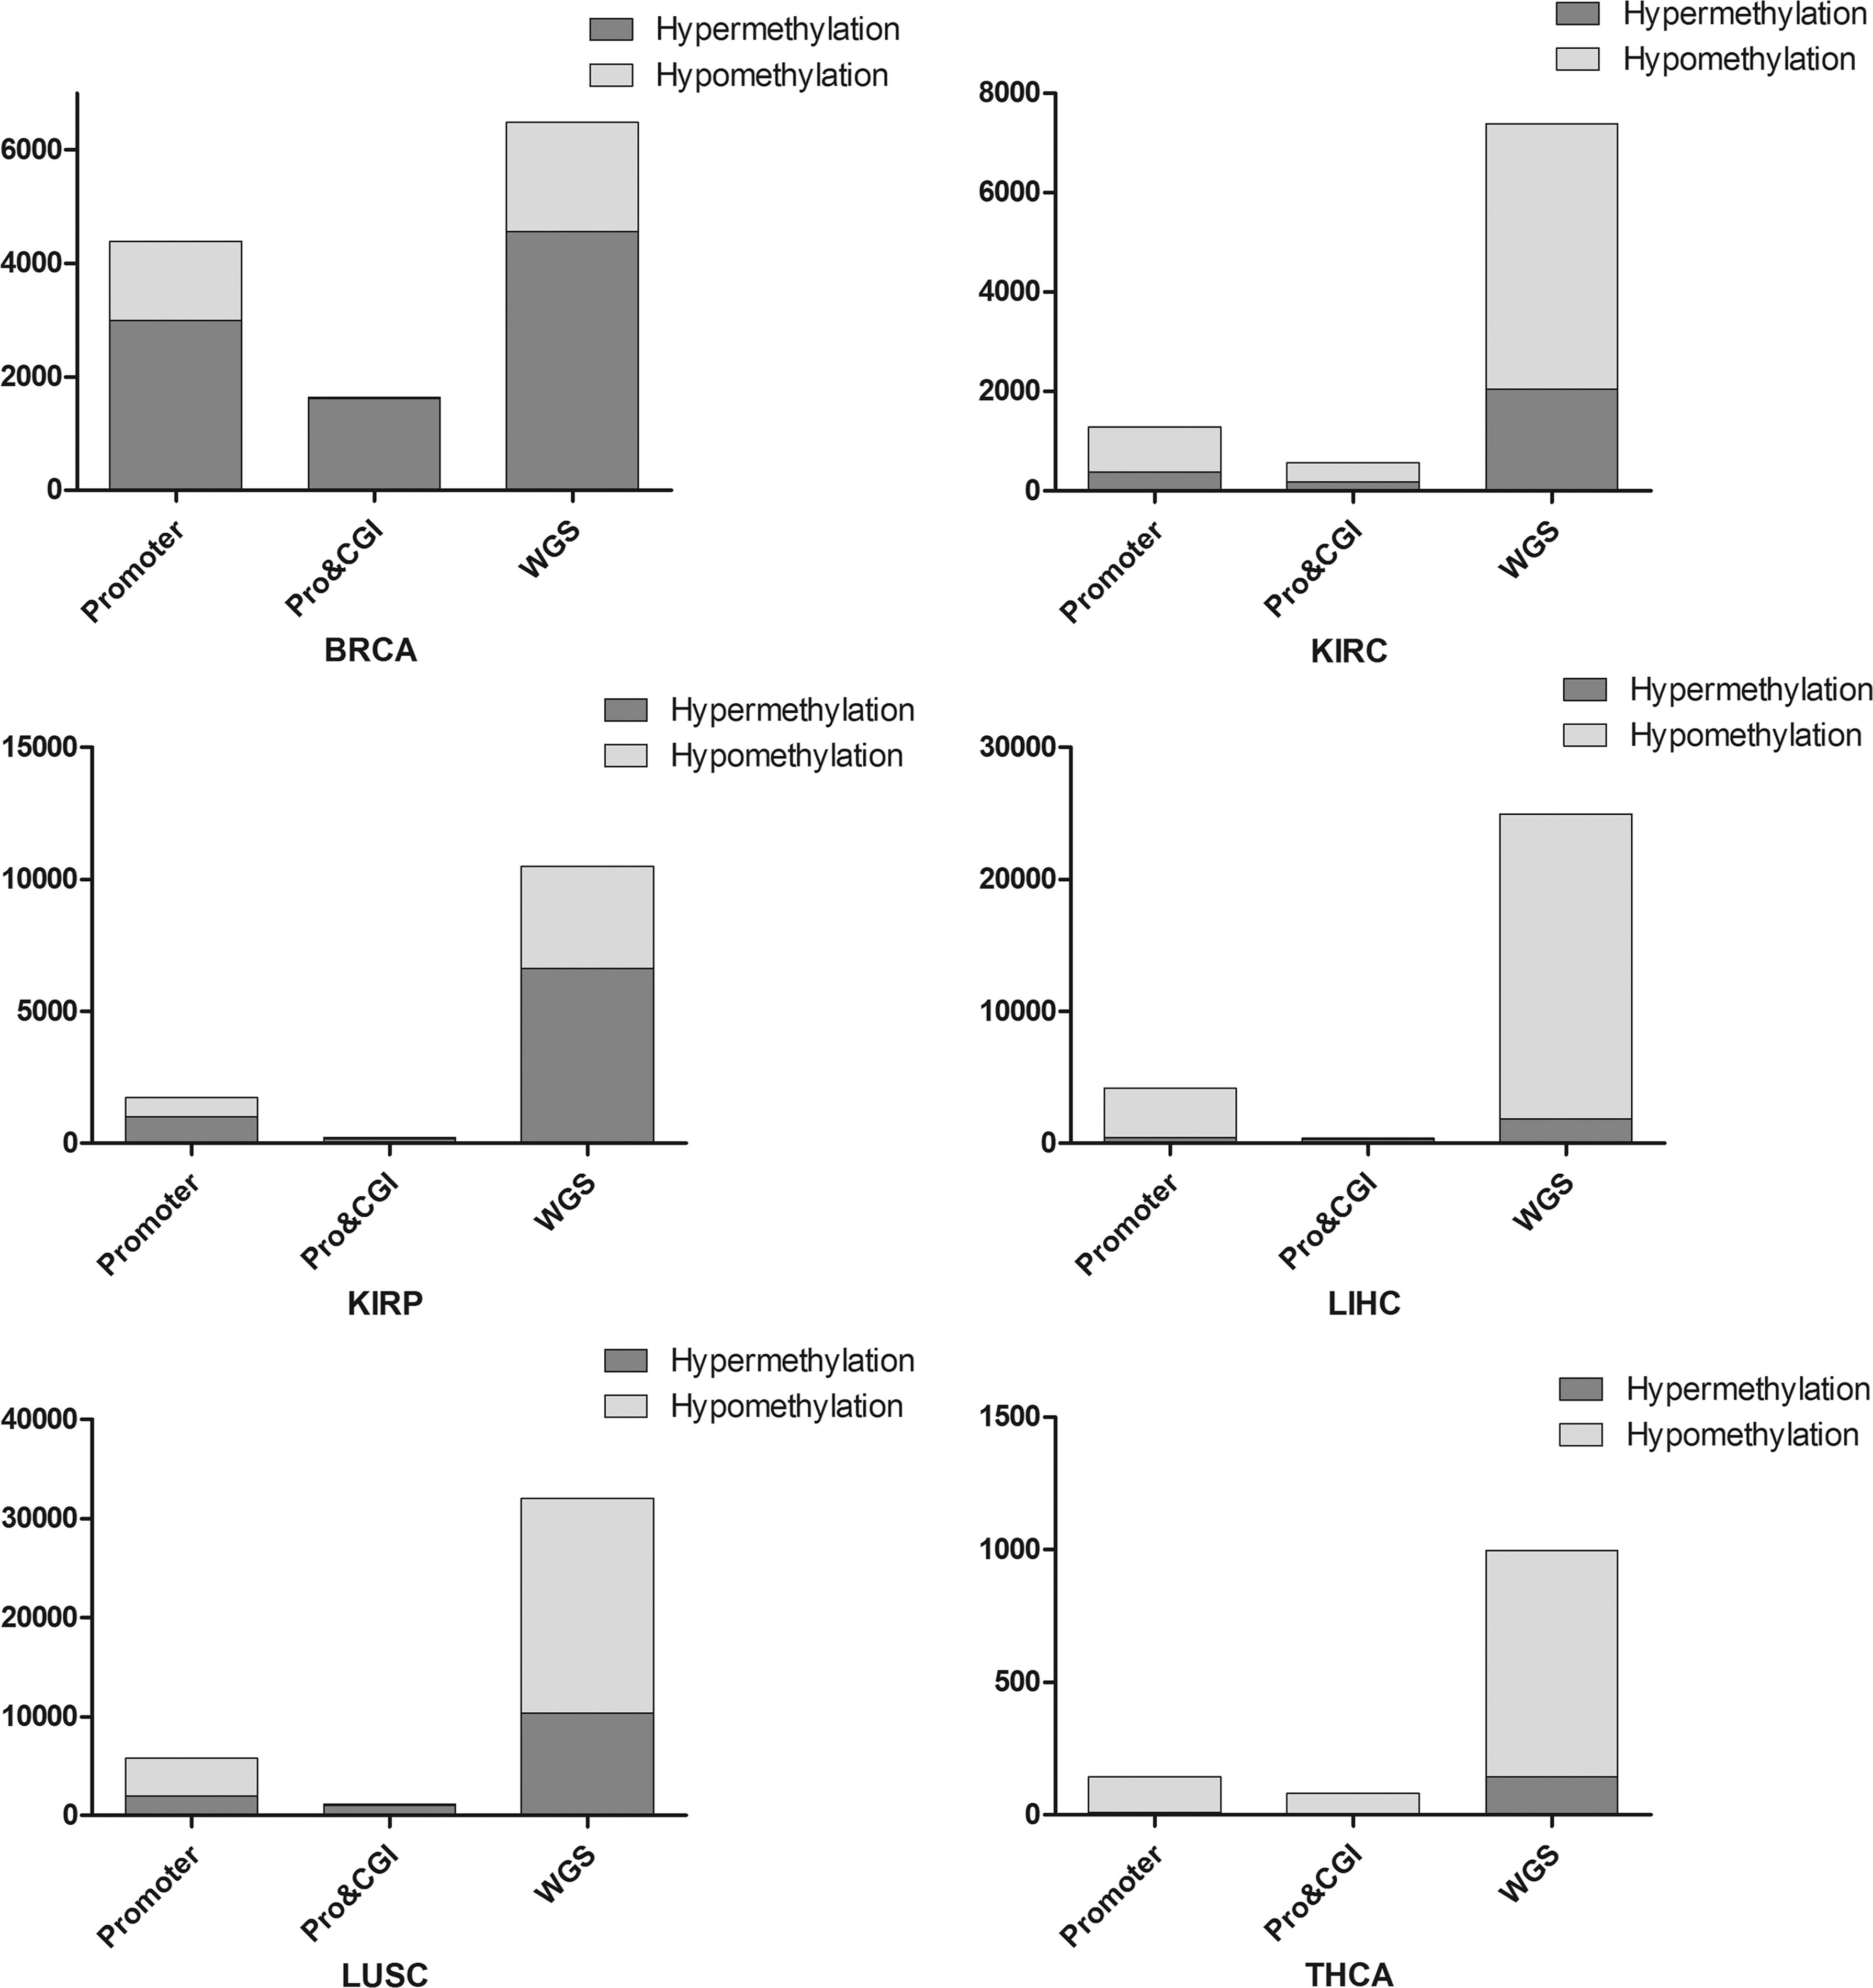
Distribution of differential methylation CpGs. BRCA, breast cancer; KIRC, kidney renal clear cell carcinoma; KIRP, kidney renal papillary cell carcinoma; LIHC, liver hepatocellular carcinoma; THCA, thyroid cancer.
The hypermethylation of the promoter region and the hypomethylation of the whole genomes are ubiquitous in multiple tumor cells. As shown in Figure 2, KIRC, LIHC, LUSC, and THCA exhibit extensive hypomethylation in the gene promoter region. At the same time, KIRC and THCA also have extensive hypomethylation on the CpG islands in the promoter region, which is inconsistent with the distribution of methylation described above. The reason may be that the hypomethylation plays an important role in early cancer and is associated with inflammation and immune response, so the lack of inflammation and immune-related functions may be the main cause of the early onset of cancer (Lawrence, 2007; Grivennikov et al., 2010; Kelly-Spratt et al., 2011).
3.2. LUSC-specific candidate diagnostic markers
To identify LUSC-specific methylation diagnostic markers, we designed a workflow and screened six LUSC-specific CpGs (cg21026460, cg08445080, cg16628135, cg16476940, cg22098115, and cg00532449). Figure 3 shows the distribution of methylation levels of the six CpGs in paracancerous and LUSC stage I samples.
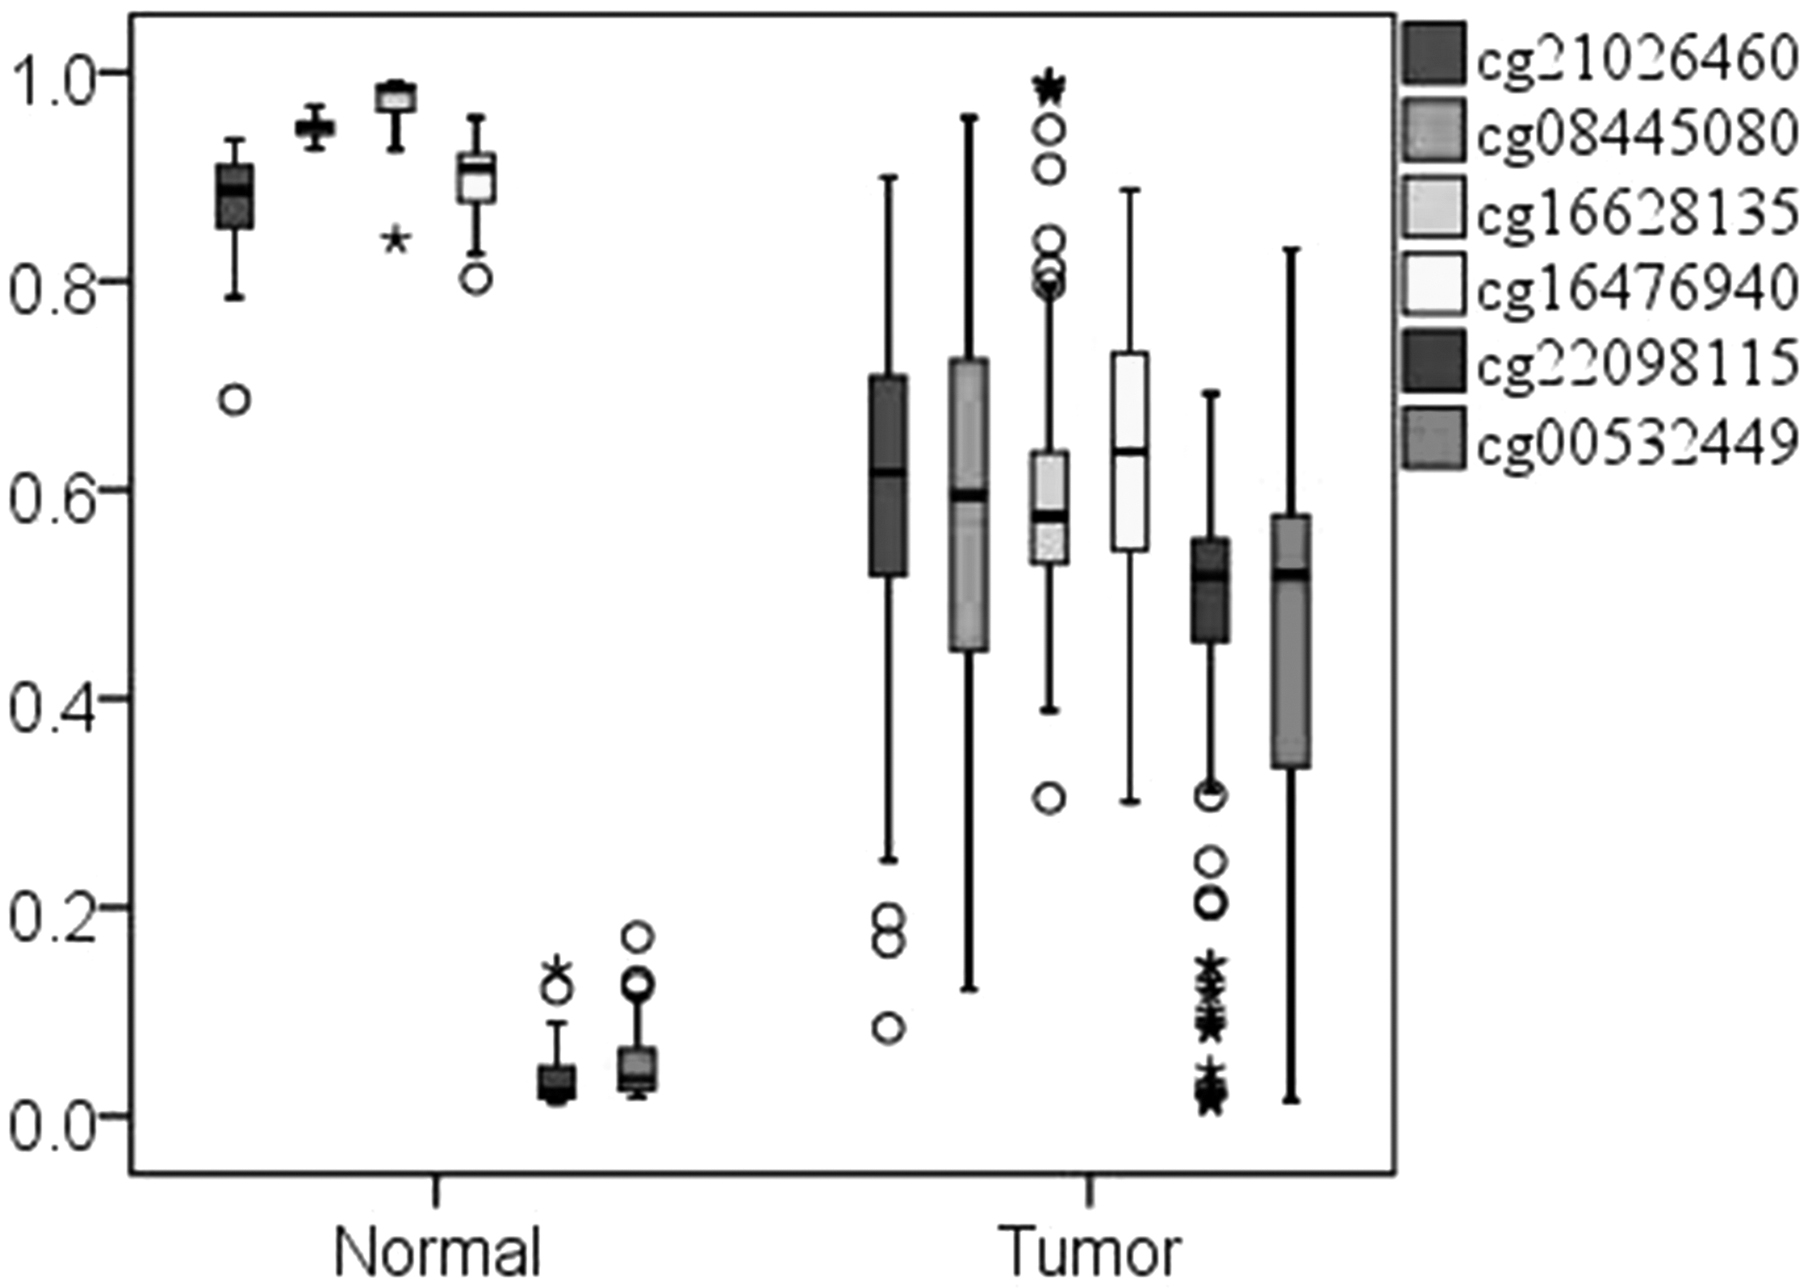
Box chart of methylation levels of six LUSC-specific CpGs in normal and stage I. The * and circle represent outliers.
As shown in Figure 3, cg21026460, cg08445080, cg16628135, and cg16476940 have methylation levels close to 1.0 in paracancerous samples, and their methylation levels are lower than 0.8 in LUSC stage I samples. The methylation level of cg22098115 and cg00532449 is much less than 0.1 in paracancerous samples and higher than 0.3 in LUSC stage I samples, which is significantly different between paracancerous and LUSC stage I samples.
Six LUSC-specific CpGs were mapped to six genes: ARHGEF4 (cg22098115), PLCH2 (cg00532449), SH2B2 (cg16476940), BAIAP3 (cg16628135), HDAC11 (cg21026460), and RP11-681L4.2 (cg08445080). Except RP11-681L4.2, the other five genes are protein-coding genes, and their functions mainly involve intracellular signal transduction, apoptosis regulation, regulation of energy metabolism, transcriptional regulation, and immune-related regulation (cytokine-mediated signaling pathways, Ras protein signal transduction regulation, antigen receptor-mediated signaling pathways), all of which are closely related to the causes of cancer.
3.3. Assessing LUSC-specific methylation candidate markers
3.3.1. Recognition of LUSC and normal samples
The tumor classification model was established using the support vector machine, and the model was optimized using sixfold cross-validation. As shown in Table 1, the classification of combination of six LUSC-specific CpGs for normal lung tissue and LUSC tumor stage I samples achieved 99.41% sensitivity and 100% specificity, respectively, which indicates that the six LUSC-specific candidate markers are highly recognized for LUSC stage I samples.
Pattern Recognition Results of Lung Squamous Cell Carcinoma-Specific CpG
LUSC, lung squamous cell carcinoma; SEN, sensitivity; SPE, specificity.
3.3.2. Specific recognition ability of LUSC-specific CpGs for LUSC
Figure 4 shows the average methylation levels of six LUSC-specific candidate markers in different cancer types. It can be observed that LUSC-specific candidate markers do not differentially methylate in the other five cancers, and their methylation levels are specific in LUSC.
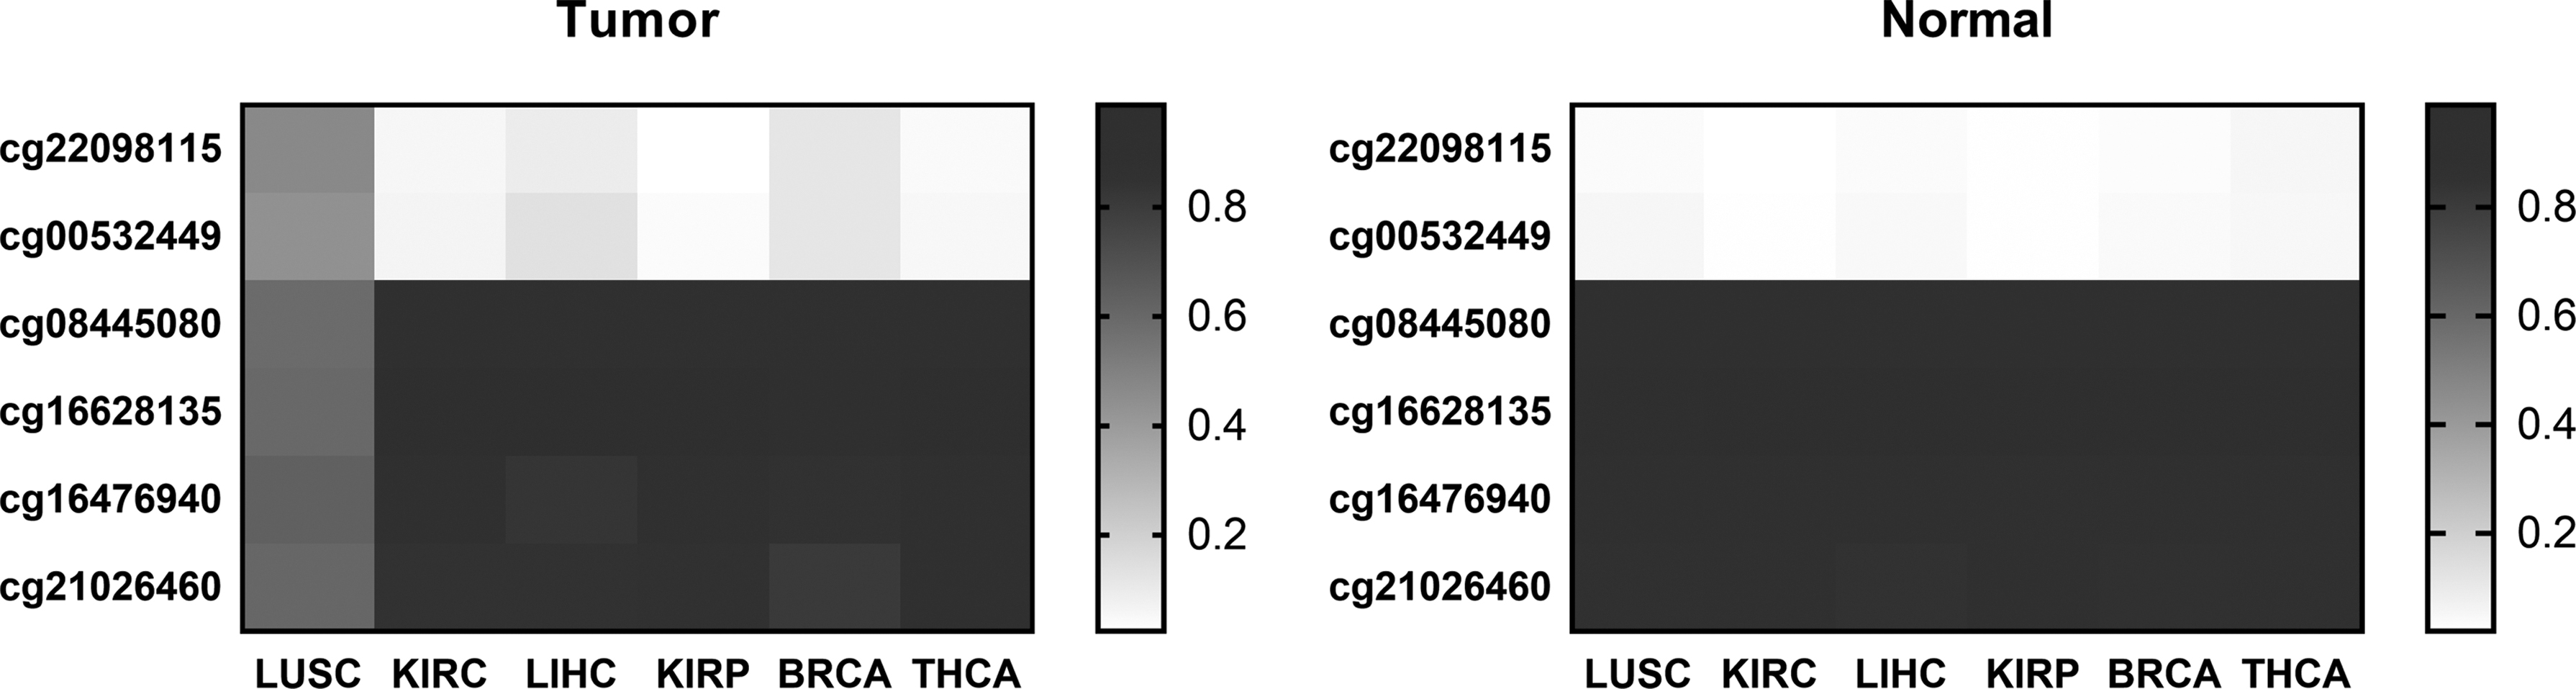
The average methylation levels of six LUSC-specific CpGs in LUSC and other cancers.
We validated the ability of LUSC-specific markers to distinguish between LUSC and non-LUSC. Table 1 shows the pattern recognition results of six LUSC-specific CpGs for LUSC and non-LUSC samples. It can be observed that LUSC-specific CpGs achieved 99.55% specificity and 93.60% sensitivity, which indicates that the six LUSC-specific CpGs have extremely high specific recognition ability for LUSC samples.
3.4. LUSC diagnostic model
An early diagnosis model of LUSC was established using the Fisher discriminant model. The six cancer data samples were divided into two types, LUSC and non-LUSC. The Fisher discriminant model was established by SPSS, and the model parameters were calculated. The model parameters are shown in Table 2. Using this diagnostic model, all samples were identified and their recognition sensitivity and specificity are 95.2% and 99.4%, respectively.
The Model Parameters of Six Lung Squamous Cell Carcinoma-Specific CpGs
3.5. Screening for specific candidate diagnostic markers for other cancers
This article attempts to apply the LUSC-specific markers recognition procedure to identify LIHC-specific candidate diagnostic markers, resulting in seven LIHC-specific candidate diagnostic markers (cg15625324, cg01794405, cg06620541, cg14821923, cg08162372, cg26301389, and cg21074827) screened. Figures 5 and 6 show the methylation levels of seven LIHC-specific CpGs in LIHC and normal liver, and the average methylation levels in LIHC and non-LIHC samples respectively. And, the recognition results of seven LIHC-specific CpGs are shown in Table 3
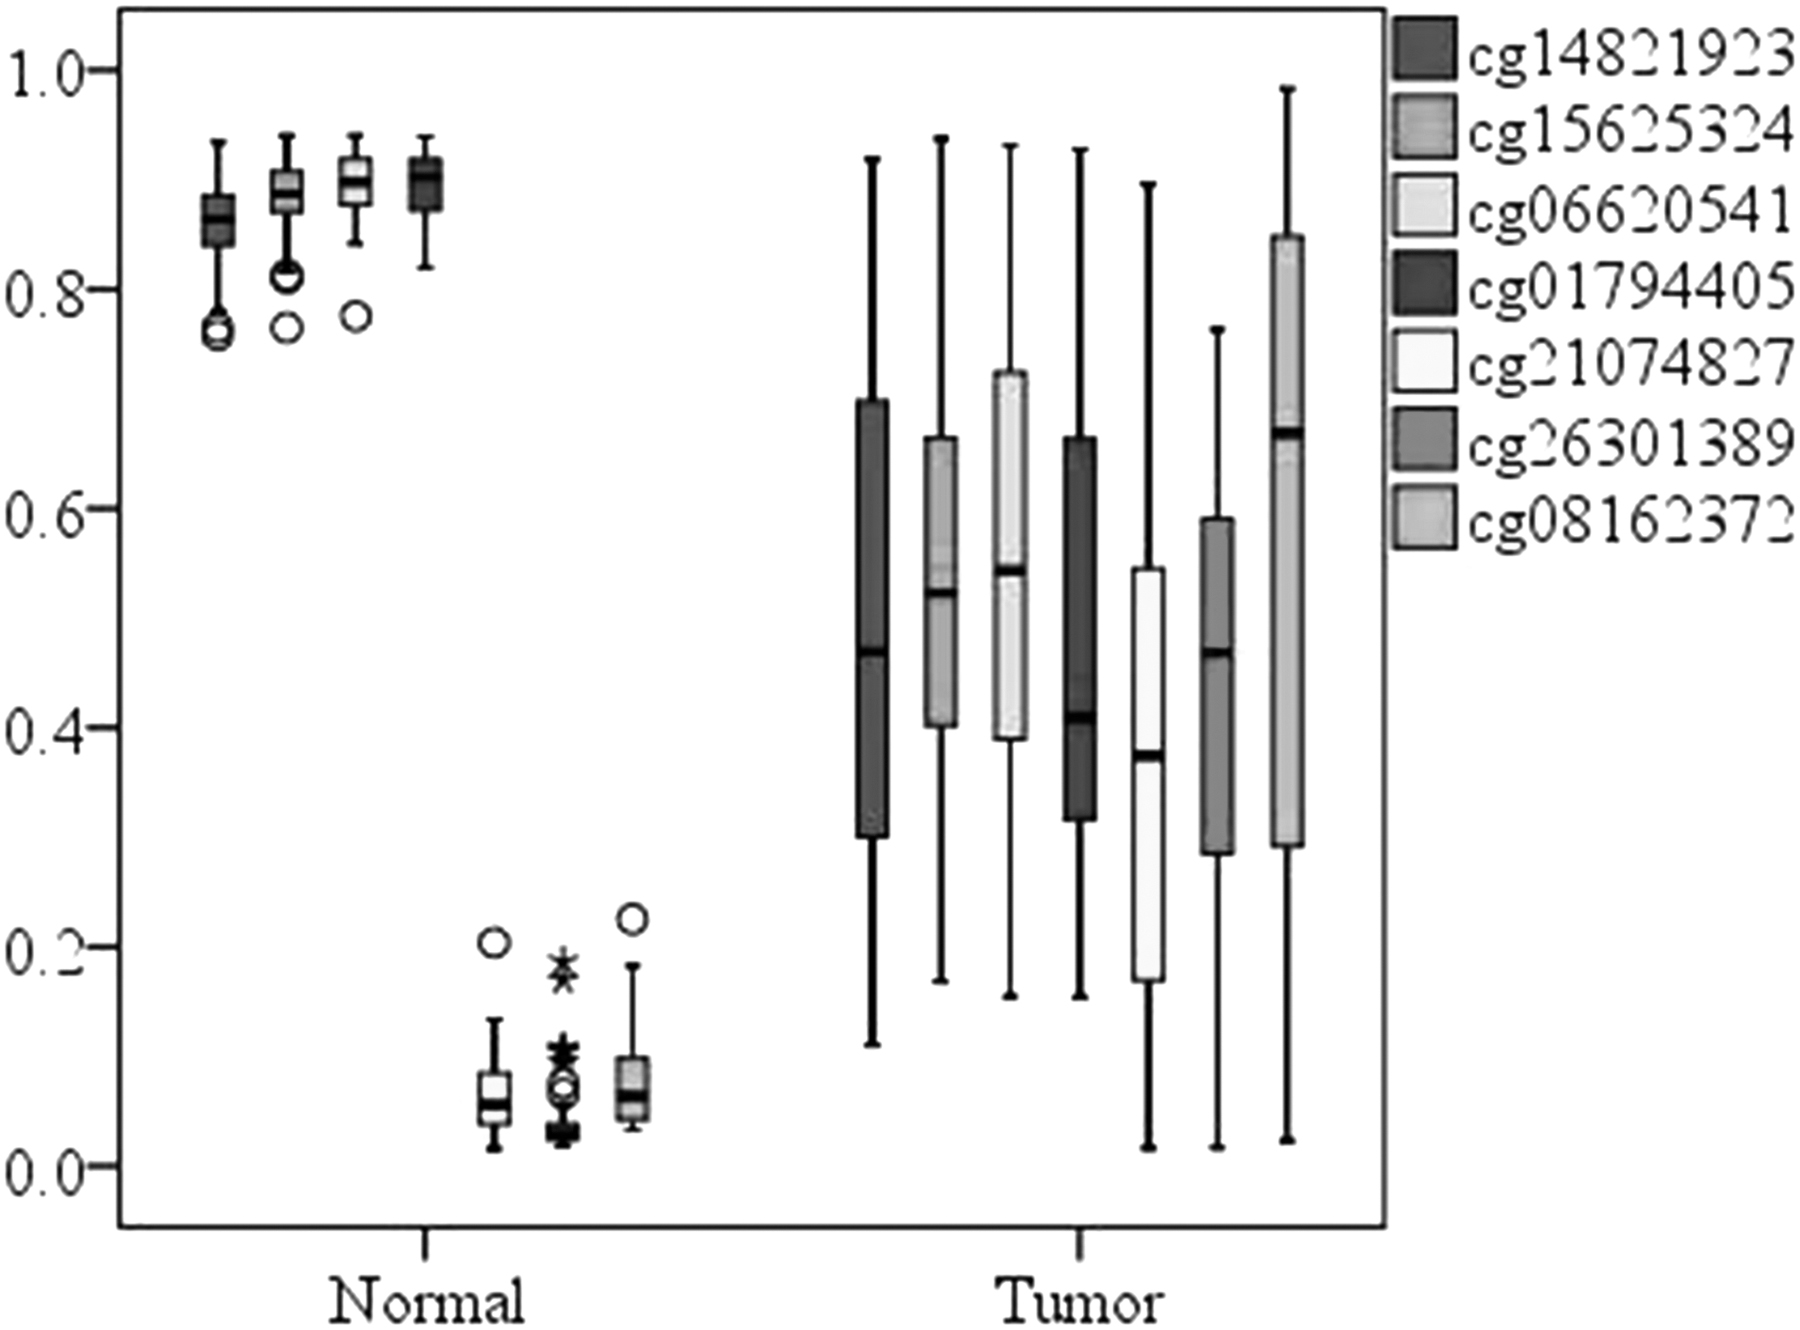
Box chart of methylation levels of seven LIHC-specific CpGs in normal and stage I.
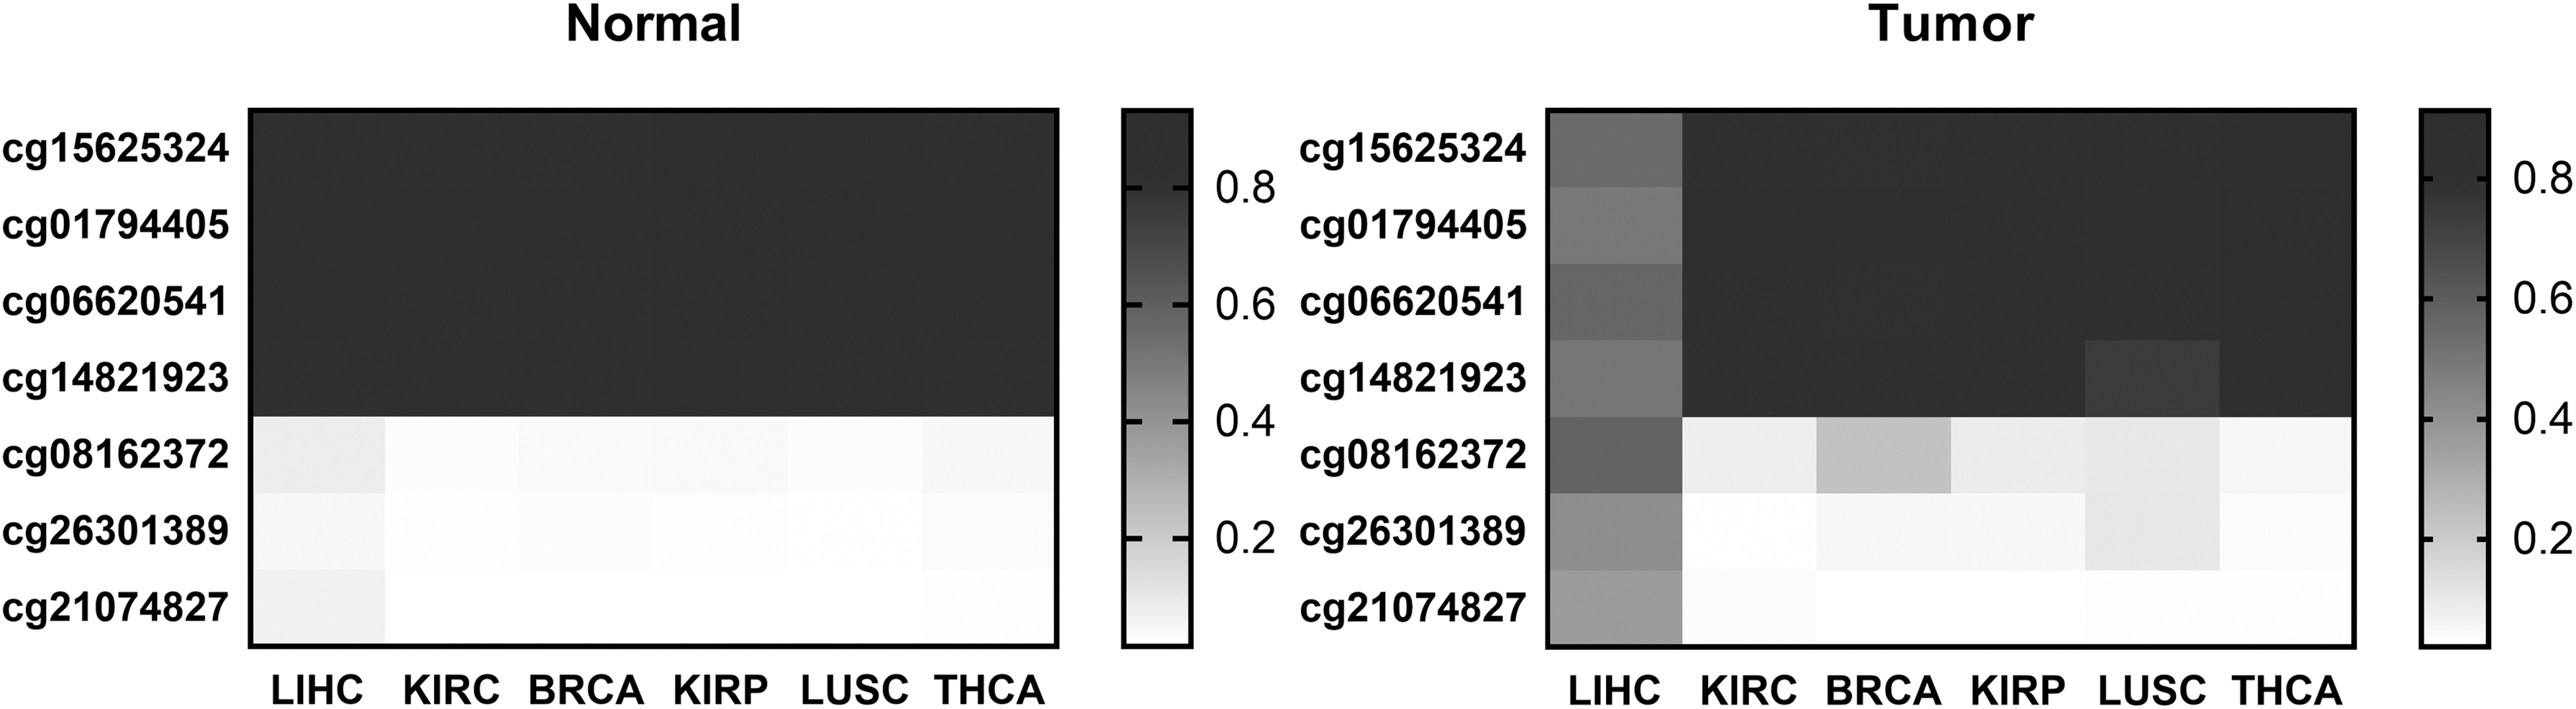
The average methylation levels of seven LIHC-specific CpGs in LIHC and other cancers.
Pattern Recognition Results of Other Four Cancers-Specific CpGs
BRCA, breast cancer; KIRC, kidney renal clear cell carcinoma; LIHC, liver hepatocellular carcinoma; THCA, thyroid cancer.
It can be observed from Figures 5 and 6 that the methylation levels of seven LIHC-specific CpGs are significantly different between LIHC and normal liver tissue and are specific in LIHC. It can be observed from Table 3 that the sensitivity of seven CpGs to LIHC and non-LIHC samples was 89% and the specificity was 98%, which has a high specific recognition ability for LIHC.
At the same time, this section also identifies the candidate markers for the other four cancers. We found that after the second step, the number of candidate CpGs for four cancers was significantly reduced, and the number of kidney renal papillary cancer and THCA was reduced to 2 and 4, respectively. After the last step, KIRP did not get the corresponding marker sites; nine BRCA-candidate CpGs, four KIRC-candidate CpGs, and four THCA-candidate CpGs were screened. In addition to renal papillary cell carcinoma, the ability of the other three cancer candidate CpGs to specifically recognize the corresponding cancer samples is shown in Table 3.
As shown in Table 3, the specific recognition sensitivity of candidate CpGs of the three cancers was less than 83% and has low recognition ability for the cancer samples, and the specificity was much higher than 98%; the difference between the two was higher than 15%, which have poor effect compared to LUSC, but there is a certain advantage over clinical.
4. Discussion
The most important finding of this study was the identification of several CpGs as LUSC-specific candidate diagnostic biomarkers. Ideal diagnostic biomarkers should be highly sensitive for detecting LUSC at an early stage, should be specific to LUSC and not detected in other tumor types, should be measured by noninvasive and cost-effective techniques, and should be validated across different populations. Here, six CpGs were identified as LUSC-specific diagnostic biomarkers by comparing LUSC with normal samples and with non-LUSC samples. These CpGs have a sensitivity (93%–99%) and a specificity (99%–100%) when predicting LUSC. However, we have not used noninvasive biological samples to verify their diagnostic capabilities, so the future work is to compare the methylation consistency between cancerous tissue and blood and to verify the predictive ability of candidate biomarkers by measuring DNA methylation in the blood. At the same time, due to the low HM450K data of LUSC, the robustness of LUSC-specific CpGs to different data sets cannot be verified.
This procedure was also applied to several other cancers. We found that except for hepatocellular carcinoma, the specific recognition sensitivity of candidate CpGs obtained from the remaining four cancers was less than 83%, and the gap between the sensitivity and specificity of pattern recognition were above 15%, of which renal papillary cell carcinoma did not even have a corresponding candidate marker. During the course of the experiment, we found that the number of specific differential CpGs (i.e., CpGs where differential methylation occurs only in a single cancer) of THCA, renal clear cell carcinoma, and renal papillary cell carcinoma are very small, so that there are not enough candidate sites for screening. The number of specific differential CpGs in BRCA is relatively high, but its specific ability to recognize BRCA is also low. The reason may be that the cause of BRCA is more complicated, and simple methylation may not have high specific recognition ability for cancers.
5. Conclusion
In this study, 6 LUSC-specific CpGs were identified by analyzing the whole-genome sequence methylation data of 172 LUSC samples and 42 normal lung tissue samples, as well as normal tissue samples and stage I samples of five other cancer types. Candidate biomarkers have the ability to classify LUSC and normal tissue samples with greater than 98% sensitivity and specificity of up to 100%, whereas classification sensitivity for LUSC and non-LUSC cancer samples is higher than 93% and specificity is higher than 99%. Then, the specific marker recognition process of LUSC was applied to the analysis of LIHC, and seven LIHC-specific CpGs were obtained, which have great specific recognition ability for LIHC. At the same time, compared with LUSC, the process is not very effective in screening other cancers-specific markers. The specific recognition sensitivity of candidate CpGs obtained from the remaining cancers was less than 83%, and the gap between the sensitivity and specificity of pattern recognition were above 15%. We have not used noninvasive biological samples to verify their diagnostic capabilities, so the next work needs to compare the methylation consistency between cancerous tissue and blood and to validate candidate biomarkers by measuring DNA methylation in the blood.
Footnotes
Acknowledgments
We would like to thank the Key Research and Development Program, the National Natural Science Foundation of China, and the Beijing International Science and Technology Cooperation Base of Intelligent Physiology Measurement and Clinical Transformation for funding this study.
Author Disclosure Statement
The authors declare they have no competing financial interests.
Funding Information
The study was funded by the Key Research and Development Program (2017YFC0111104), the National Natural Science Foundation of China (Grant No. 11572014), and the Beijing International Science and Technology Cooperation Base of Intelligent Physiology Measurement and Clinical Transformation.