
Abstract
This study aimed to explore more gene markers associated with glioma or its prognosis. The glioma-related RNAseq data from the Gene Expression Omnibus database and The Cancer Genome Atlas dataset in UCSC Xena database were downloaded. There was a total of 971 tumor samples and 102 normal samples in the 2 datasets. The differentially expressed genes (DEGs) data between tumor and normal samples were analyzed, on which were then performed function and pathway enrichment analyses. Pearson correlation coefficient between DEGs was calculated to construct the coexpression network. Finally, prognostic genes were screened. A total of 634 upregulated and 769 downregulated DEGs were identified between tumor and control groups. These DEGs were significantly involved in 15 upregulated pathways, such as p53 signaling pathway, and 16 downregulated pathways, such as neuroactive ligand–receptor interaction, and cell adhesion molecules. In the coexpression network, pseudouridine synthase 7 (PUS7), EFR3 homolog B (EFR3B), and neuronal cell adhesion molecule (NRCAM) had the top three highest degrees. Additionally, 17 prognostic genes were selected, such as thrombospondin-1 (THBS1), caspase-8 (CASP8), glutamate ionotropic receptor AMPA type subunit 2 (GRIA2), GRIA4, and ADCYAP receptor type I (ADCYAP1R1). Pathways of p53 signaling pathway and neuroactive ligand–receptor interaction may play important roles in glioma progression. PUS7, EFR3B, and NRCAM may be potential biomarkers of glioma. THBS1, CASP8, GRIA2, GRIA4, and ADCYAP1R1 may serve as prognostic markers in glioma.
1. Introduction
Gliomas are primary brain cancers that arise from glial cells, which account for the majority of malignant brain tumors in adults (Goodenberger and Jenkins, 2012). Gliomas are traditionally classified as astrocytic, ependymal, or oligodendroglial tumors based on their histological appearance (Ferluga and Debinski, 2014; Weller et al., 2015). The astrocytic tumors are the most common and include the most malignant type of glioblastoma that had a very poor survival time of ∼15 months (CBTRUS, 2011). It is necessary to advance our mechanistic understanding of glioma tumorigenesis.
Like cancer in general, gliomas develop due to genetic alterations that accumulate with tumor progression (Riemenschneider et al., 2010). Genome-wide molecular-profiling studies have revealed comprehensive mutational landscapes for the major types of gliomas (Cancer Genome Atlas Research Network et al., 2015; Korshunov et al., 2015; Ceccarelli et al., 2016). For instance, mutation of the isocitrate dehydrogenase 1 (IDH1) gene, or the related IDH2 gene, has been identified in the majority of world health organization grades II and III astrocytic, oligodendroglial, and oligoastrocytic gliomas (Balss et al., 2008; Yan et al., 2009). Mutation of the tumor suppressor gene, TP53, has been found in more than half of the grade II diffuse astrocytomas (Riemenschneider et al., 2010). Moreover, primary glioblastoma shows frequent EGFR amplification and PTEN mutation, and secondary glioblastoma is characterized by frequent mutations in the TP53 and IDH1 genes (Kleihues and Ohgaki, 1999; Ohgaki and Kleihues, 2007). These molecular characteristics can be used to improve the prediction of outcomes of patients, and to guide individualized treatment (Reifenberger et al., 2016).
In this study, we downloaded the glioma-related RNAseq datasets from the Gene Expression Omnibus (GEO) database and The Cancer Genome Atlas (TCGA) database to explore more gene markers associated with glioma. Additionally, we performed survival analysis to screen prognostic genes of glioma.
2. Methods
2.1. Data collection
We downloaded the glioma-related RNAseq data from the GEO database (Barrett et al., 2013; www.ncbi.nlm.nih.gov/geo) and TCGA dataset in UCSC Xena database (Haeussler et al., 2019; https://xenabrowser.net/datapages). The GEO dataset (GSE57872) contained 441 tumor samples and 102 normal samples. On this dataset was performed the gene expression quantification using RSEM method. The RNAseq data (IlluminaHiSeq pancan normalized) downloaded from UCSC Xena database included 530 tumor samples.
2.2. Differential expression analysis
There was a total of 971 tumor samples and 102 normal samples in the 2 datasets. After normalization of the data matrixes using betaqn method in R, the differentially expressed genes (DEGs) data between tumor and normal samples were analyzed using limma package (version 3.10.3; Ritchie et al., 2015). Paired t test was used for significance test to obtain the p value. Benjamini–Hochberg (BH) method was used for multiple test adjustment to obtain the adjusted p value. The thresholds for DEGs were set as adjusted p value <0.05 and |log fold change (FC)| > 1.
2.3. Function and pathway enrichment analyses of DEGs
The functional annotations, including biological process (BP), molecular function (MF), and cellular component (CC) enriched by the DEGs, were analyzed using Database for Annotation, Visualization, and Integrated Discovery (Huang da et al., 2009; version 6.7, https://david-d.ncifcrf.gov). Results were visualized using GOplot (Walter et al., 2015). Based on Kyoto Encyclopedia of Genes and Genomes (KEGG) database, gene set enrichment analysis (GSEA, version 3.0; Damian and Gorfine, 2004) was used to conduct KEGG pathway analysis. Adjusted p value <0.05 was used as the threshold.
2.4. Coexpression analysis of genes
Pearson correlation coefficient between DEGs was calculated, and the correlation test was performed using the corr.test method (parameter ci = F, adjust = “BH”) of psych (Jason, 2013) in R. BH method was used for multiple test adjustment. Gene pairs with r > 0.8 and p value <0.05 were screened and Cytoscape software (Shannon et al., 2003; version 3.7.0) was used to construct the coexpression network.
2.5. Prognostic gene screening
The prognostic information of patients, including overall survival (OS) and OS status were collated according to the downloaded clinical data. Based on the obtained DEGs as the candidate genes, the patients were divided into high-expression and low-expression group according to the median of gene expression value. Then combining the prognostic information, the Kaplan–Meier (K-M) survival curve was drawn with K-M survival analysis method. The significance p value was calculated using the logrank test. The gene with p value <0.05 was preliminarily considered to be associated with prognosis.
3. Results
3.1. DEGs identification
The number of annotated genes in the TCGA dataset and GEO dataset were 20,530 and 5948, respectively. There were a total of 5678 common genes in the two datasets, among which there were 1403 DEGs (634 upregulated and 769 and downregulated; Fig. 1A). The top 10 upregulated and downregulated genes are shown in Figure 1B.

3.2. Gene ontology enrichment analysis
Gene ontology (GO) enrichment analysis was performed on these DEGs, and the results showed that a total of 24 BP, 23 CC, and 5 MF were significantly enriched. As shown in Figure 2, DEGs were significantly enriched in functions related to cell projection organization, morphogenesis, vesicle, membrane-bound vesicle, cytoskeletal protein, and actin. These functions may be related to aberration of cancer cells, acquisition of foreign substances, intercellular communication, and metastasis of cancer cells.
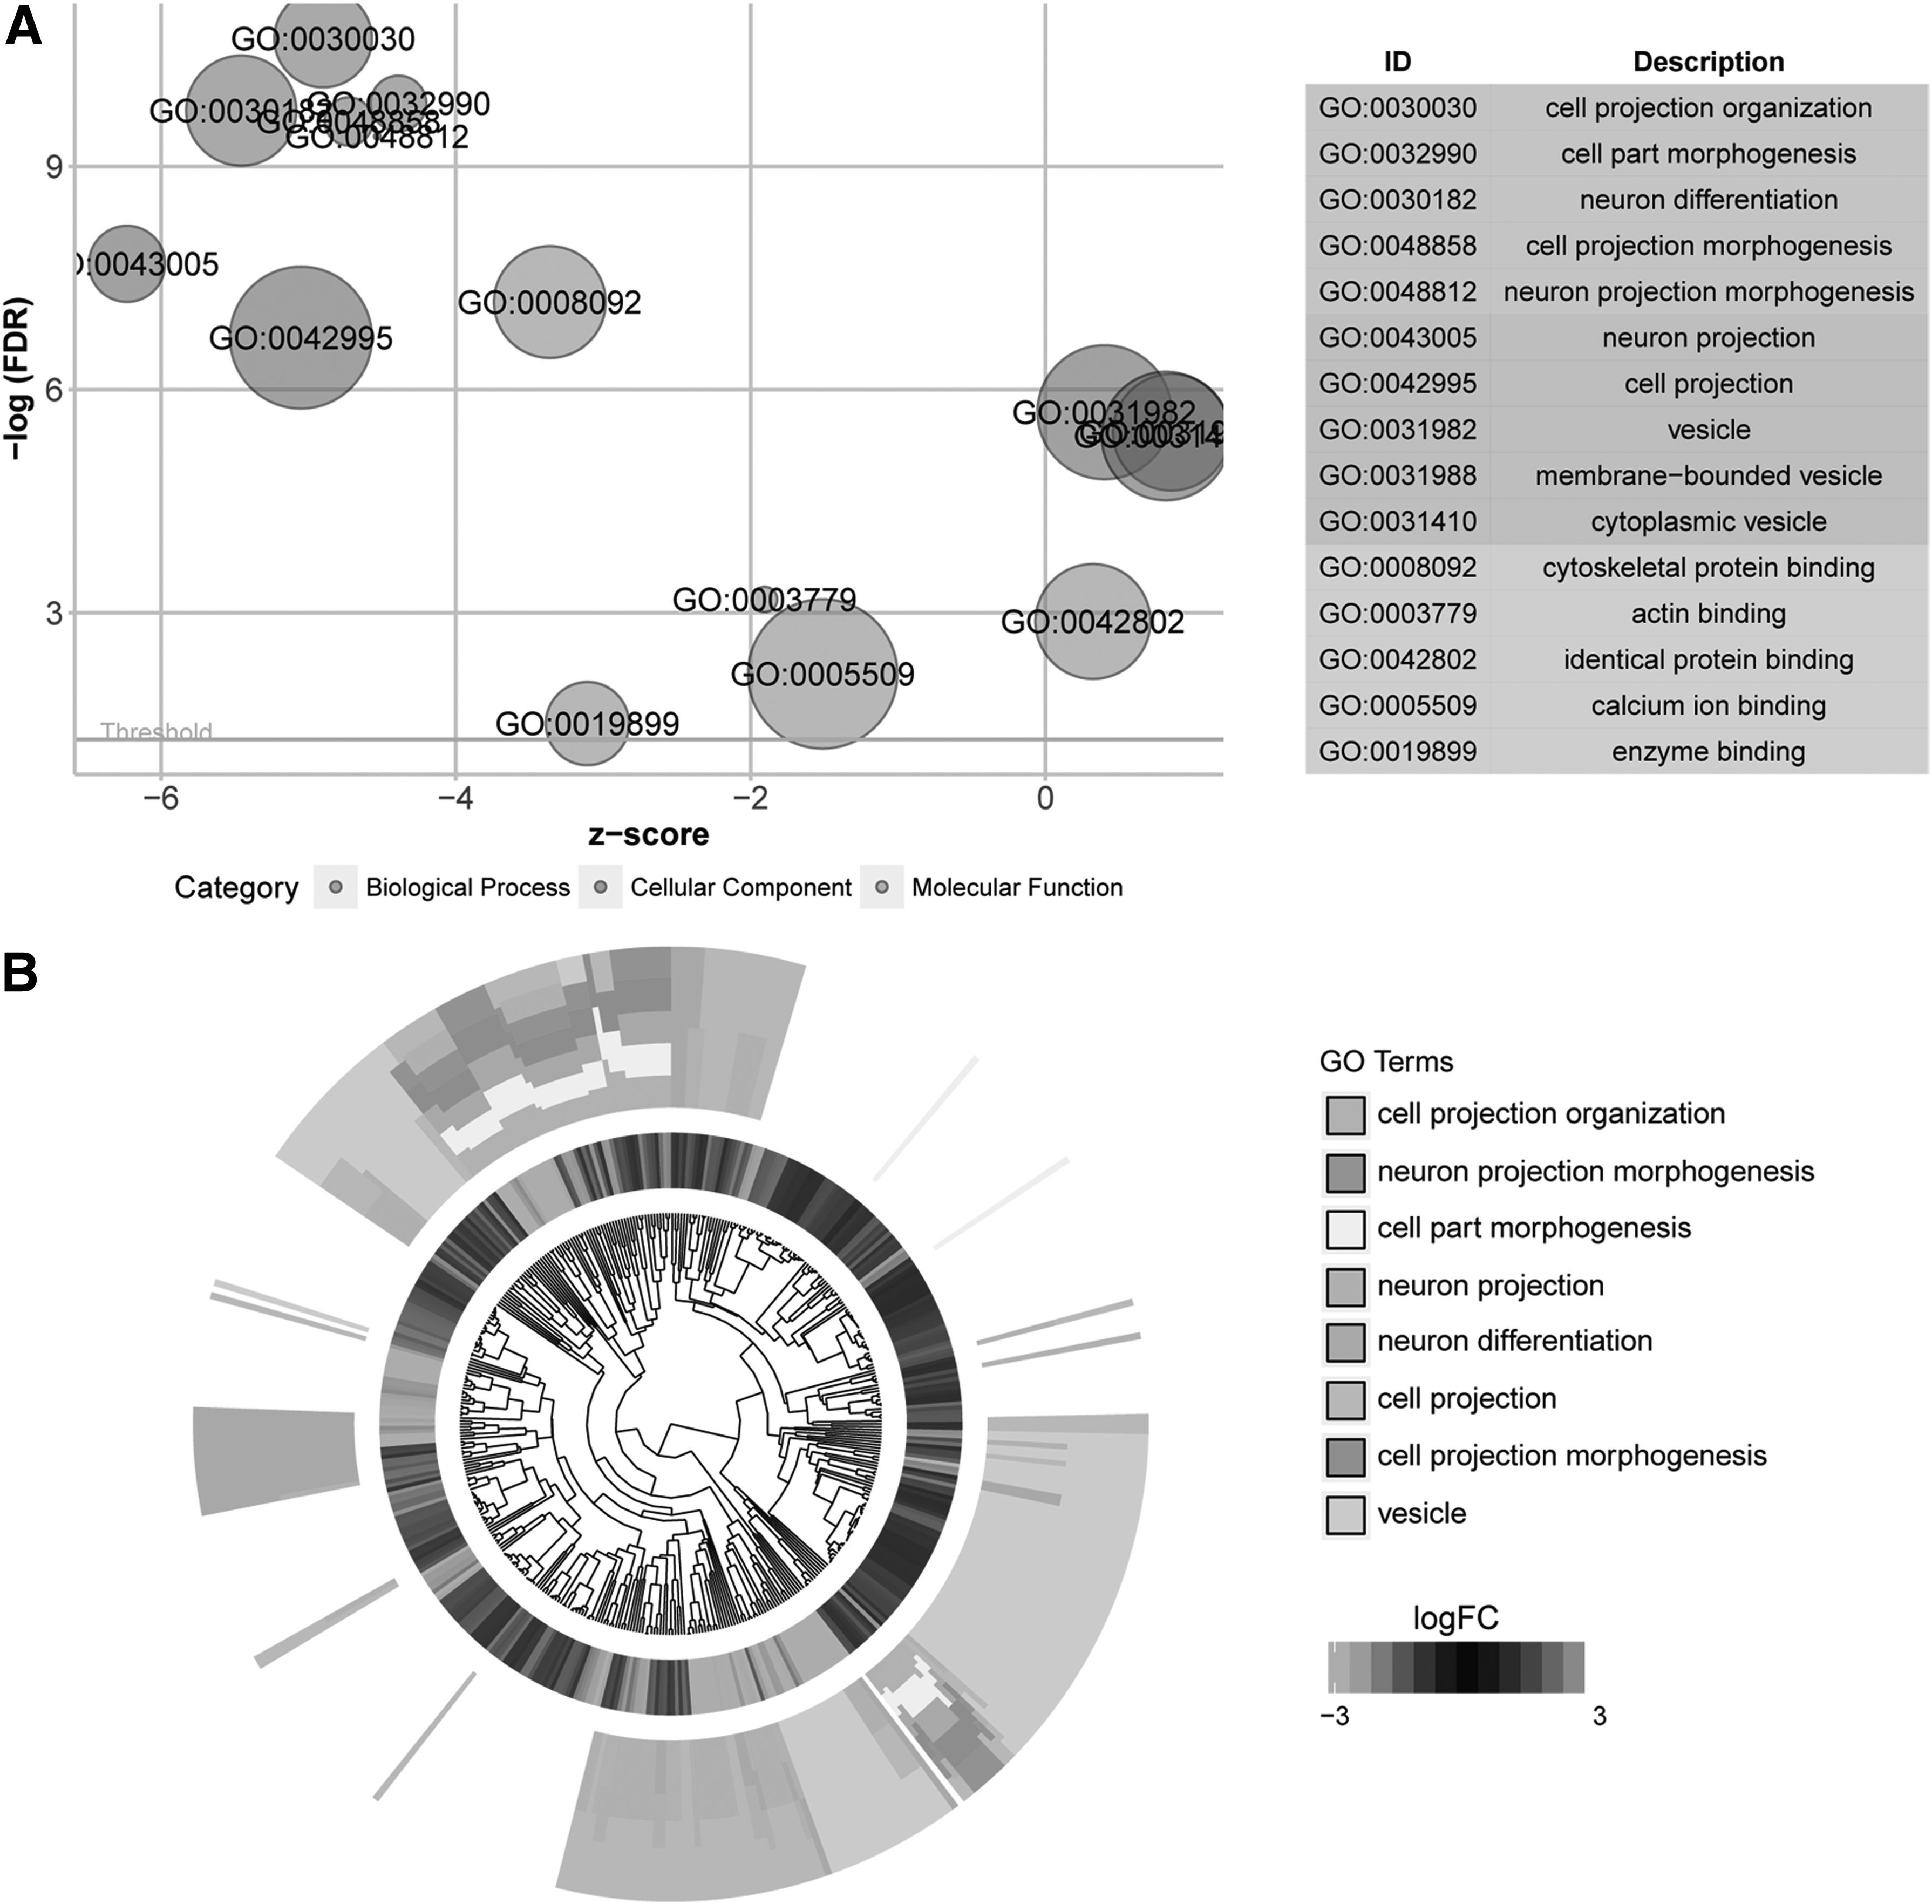
Function enrichment analysis results.
3.3. KEGG pathway enrichment analysis
According to the enrichment analysis by GSEA, a total of 31 significantly enriched pathways we identified, including 15 upregulated pathways [normalized enrichment score (NES) >0] and 16 downregulated ones (NES <0; Fig. 3A, B). p53 signaling pathway had the largest NES enrichment score among the upregulated pathways (Fig. 3C). Additionally, cell cycle pathway, and small-cell lung cancer were also significantly upregulated. Among the downregulated pathways, neuroactive ligand–receptor interaction had the highest NES (Fig. 3D). Many signal transduction pathways, such as phospholipase D signaling pathway, peroxisome proliferators-activated receptor (PPAR) signaling pathway, and cyclic adenosine monophosphate (CAMP) signaling pathway were also downregulated.
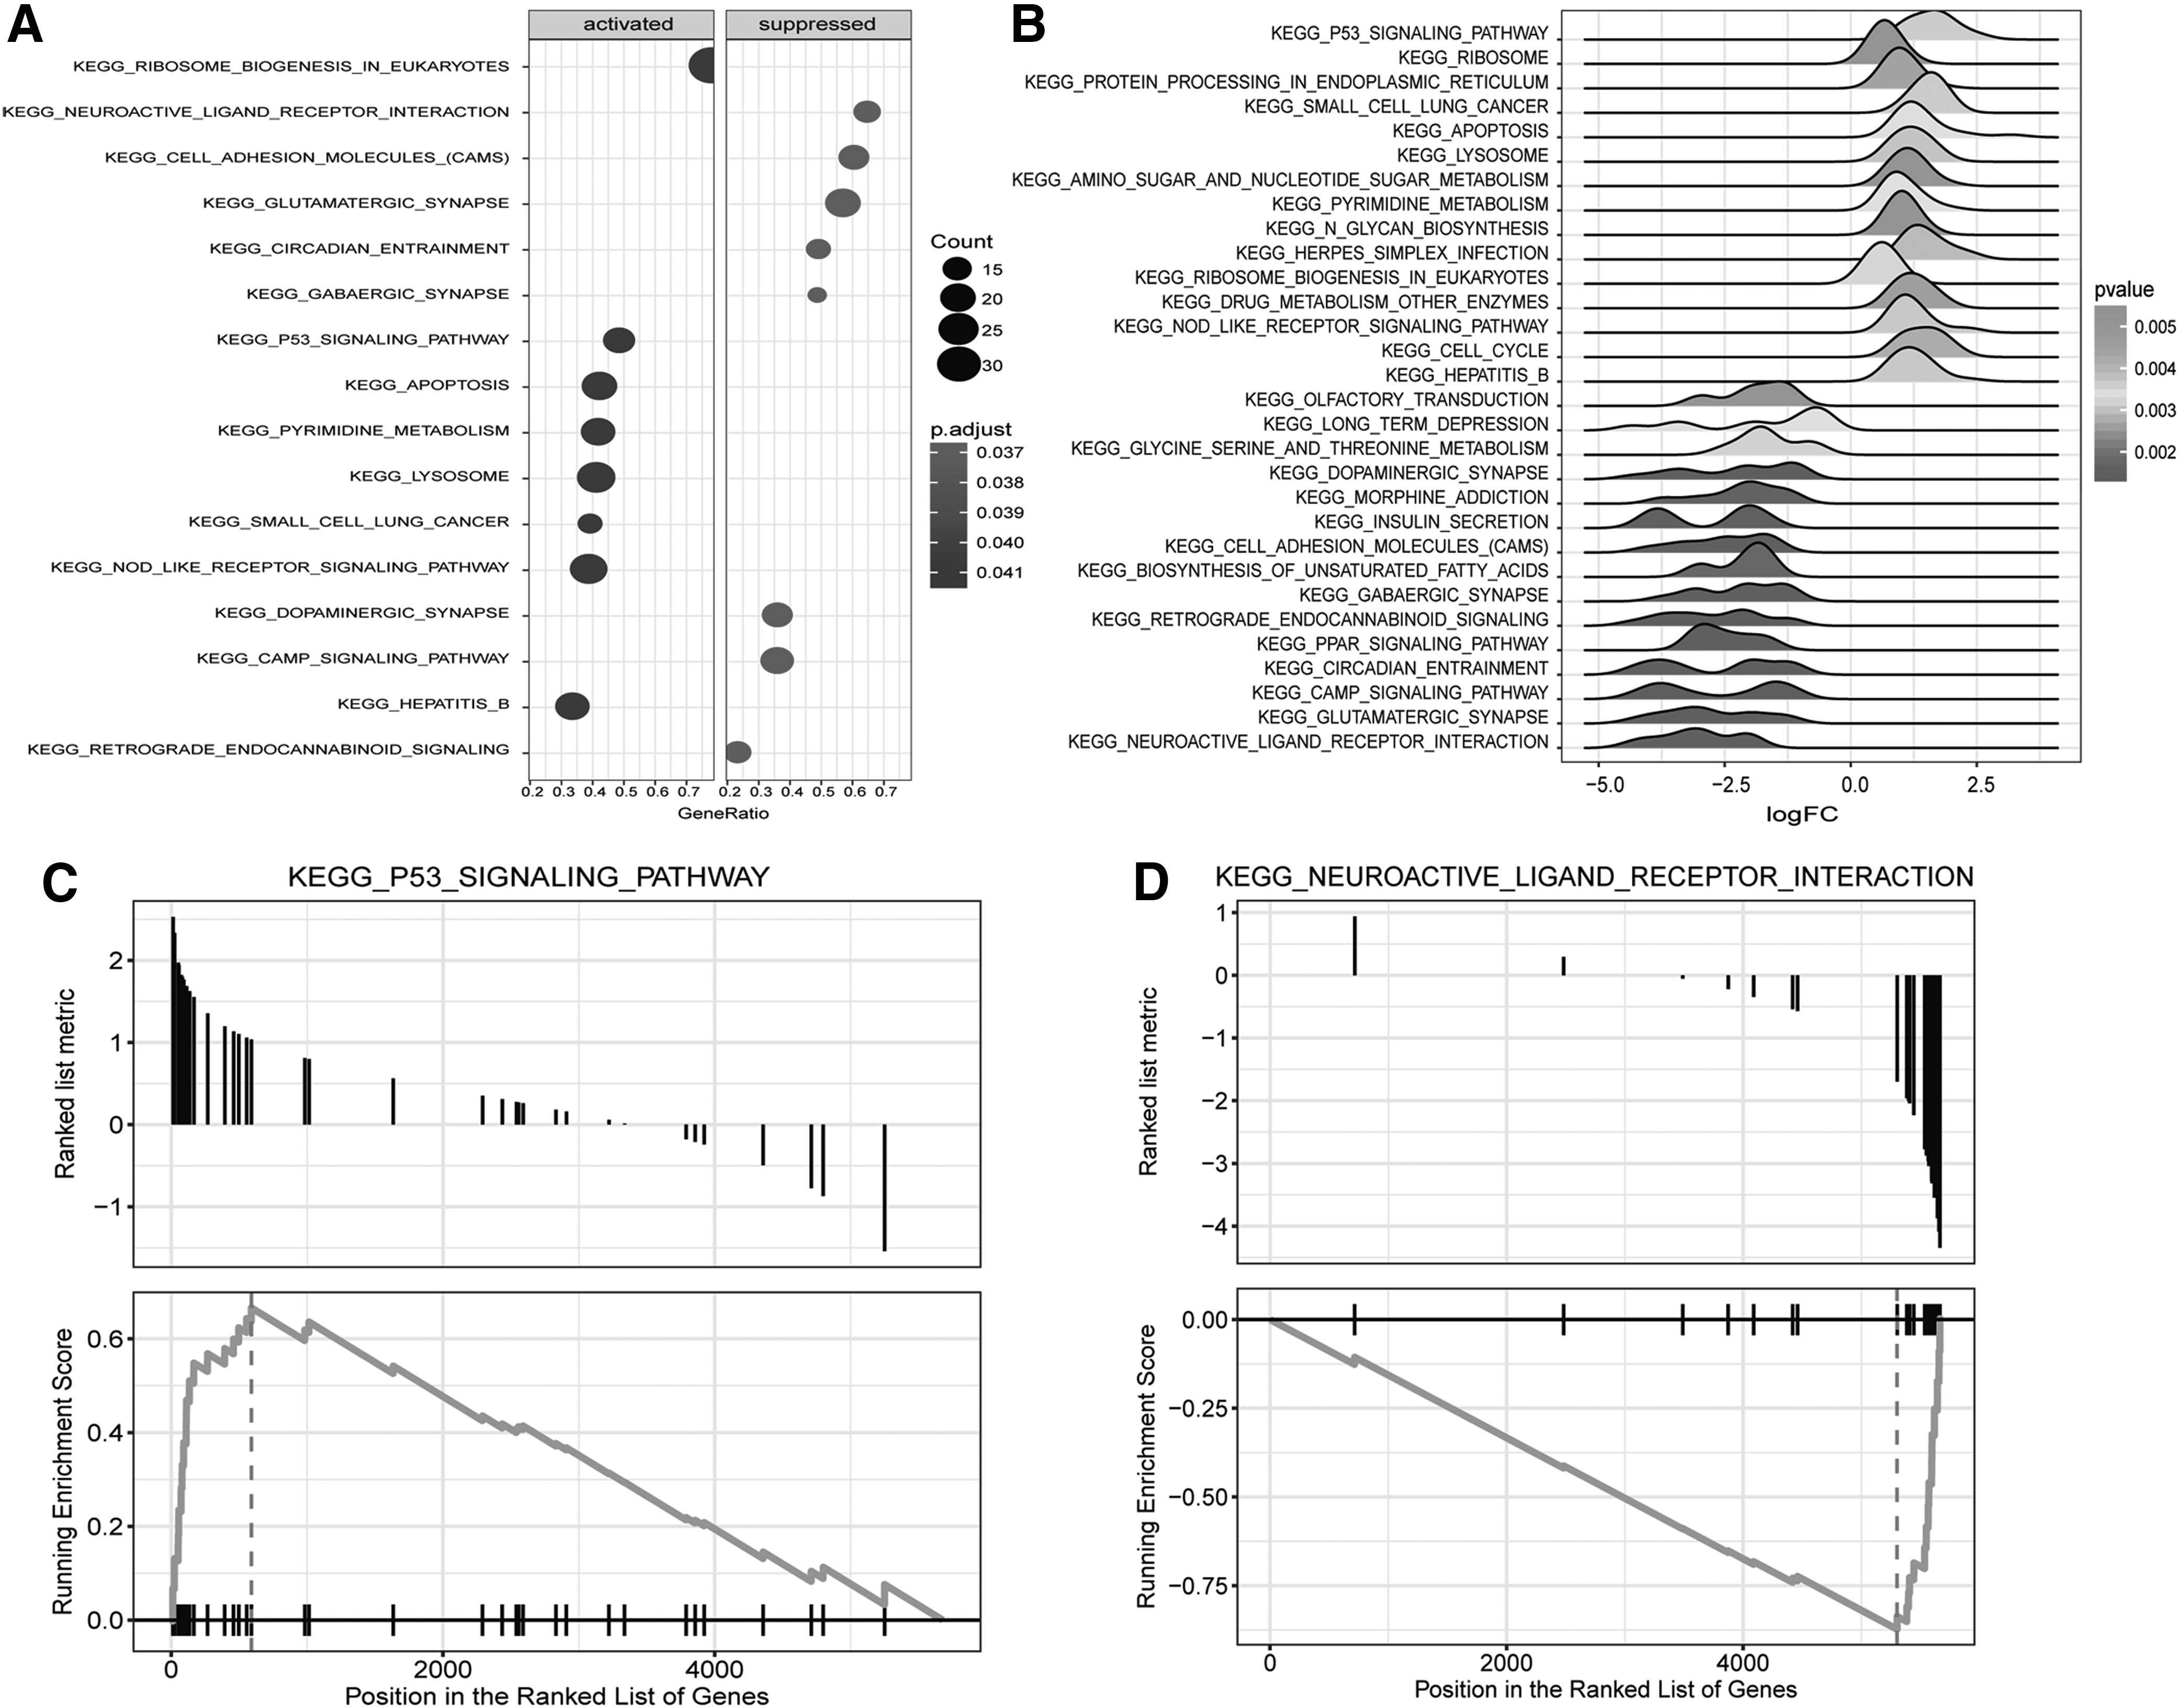
Enrichment results of GSEA pathway.
3.4. Gene coexpression network
For the 1403 DEGs, we calculated the correlation coefficient and significance degree between two genes based on their expression amount in different samples, and screened the gene pairs with r > 0.8 and adjusted p value <0.05. Cystoscape was used for visualized analysis on the gene pairs, as shown in Figure 4. There were 119 nodes (genes) in this coexpression network, among which 54 genes were upregulated and 65 genes were downregulated. As can be seen from Figure 4, there were 5 connected networks in the coexpression network, and the corresponding gene numbers were 2, 3, 3, 6, and 105, respectively. In this coexpression network, pseudouridine synthase 7 (PUS7), EFR3 homolog B (EFR3B), and neuronal cell adhesion molecule (NRCAM) had high connectivity degree (hub genes).

Gene coexpression network. Dark grey indicates upregulated genes and light grey indicates downregulated genes.
3.4. Prognosis analysis
The downloaded TCGA clinical data contained the information of 515 patients. The information of survival status and corresponding survival time was extracted, and the mismarked cases were deleted, and finally the clinical information of 514 patients was used. In GO and GSEA enrichment analyses, respectively, 779 and 884 DEGs were analyzed, and 286 genes were common genes. According to logFC values of these genes, the top 10 upregulated and downregulated genes were selected. The K-M survival curves were drawn by combining their expression values and clinical information (Fig. 5). Based on the significance threshold of p value <0.05, the expressions of 17 genes (except for ATP1A2, CNTN2, and MYH11) were significantly correlated with the survival time of the patients.

Gene expression related survival curve of 20 genes. The black curve and the grey curve represent the low expression group and the high expression group, respectively. HR, hazard ratio.
4. Discussion
In this study, a total of 634 upregulated and 769 and downregulated DEGs were identified between tumor and control groups. These DEGs were significantly involved in 15 upregulated pathways, such as p53 signaling pathway, and 16 downregulated pathways, such as neuroactive ligand–receptor interaction, and cell adhesion molecules (CAMs). In the coexpression network, PUS7, EFR3B, and NRCAM had the top three highest degrees. Additionally, 17 prognostic genes were selected, such as thrombospondin-1 (THBS1), caspase-8 (CASP8), glutamate ionotropic receptor AMPA type subunit 2 (GRIA2), GRIA4, and ADCYAP receptor type I (ADCYAP1R1).
TP53 is one of the most commonly mutated tumor suppressor genes in human cancers (Slattery et al., 2009; Yan et al., 2016). p53 is normally expressed at low levels to maintain the homoeostasis of cell cycle and cell death. The p53 protein is activated in response to stress factors, such as oxidative free radicals, hypoxia, DNA damage, or oncogenes. Activated p53 can either repress or transactivate the downstream target genes that in turn regulate apoptosis, cell cycle arrest, angiogenesis, and metastasis (Harris and Levine, 2005). In this study, the p53 signaling pathway was significantly upregulated, suggesting that it may promote the progression of glioma.
Moreover, many of the dysregulated genes in the p53 signaling pathway were found to be correlated with the survival time of the patients, such as THBS1 and CASP8. THBS1 is an extracellular matrix molecule involved in migration, invasion, and suppression of angiogenesis in glioma (Sargiannidou et al., 2001). Previous study has reported that THBS1 and transforming growth factor-beta 2 are correlated with glioma grade, showing higher expression levels in malignant high-grade gliomas, than in low-grade gliomas (Kawataki et al., 2010). CASP8 belongs to the cysteine aspartyl-specific protease family, an important defense system against tumor progression and malignant transformation (Bethke et al., 2008). It has been reported that advanced glioblastoma exhibits dysregulated CASP8 expression (Martinez et al., 2007). Taken together, THBS1 and CASP8 may be implicated in glioma development through p53 signaling pathway.
The pathway of neuroactive ligand–receptor interaction was the most significantly downregulated pathway. A recent study reveals that defective neuroactive ligand–receptor interaction pathway is a poor prognosticator in glioblastoma patients (Pal et al., 2017). GRIA2, GRIA4, and ADCYAP1R1 that associated with prognosis were enriched in this pathway. GRIA2 and GRIA4 encode AMPA-selective ionotropic glutamate receptor subunit. Glutamate is a major neurotransmitter in the central nervous system. There is evidence that glutamate and its receptors play roles in regulating tumor growth (Stepulak et al., 2005). Blocking expression of glutamate receptor subunits inhibits proliferation of cancer cells (Watanabe et al., 2008). ADCYAP1R1 (also named PAC1) is present in many neurologic cancers, such as neuroendocrine, brain, and pheochromocytomas, and play an important role in the modulation of growth and differentiation of these cancers (Reubi et al., 2000; Martinez and Vicente, 2013). Therefore, we speculated that pathway of neuroactive ligand–receptor interaction as well as its enriched genes, GRIA2, GRIA4, and ADCYAP1R1, may act as potential prognostic markers in glioma.
In the coexpression network, PUS7, EFR3B, and NRCAM had the top three highest degrees, besides NRCAM was involved in pathway of CAMs. PUS7 gene is reported to be a potential target in the immunomodulation of cancer (Qadir et al., 2018). The role of EFR3B has not been fully investigated to our knowledge. NRCAM was initially discovered in central and peripheral nervous system (Grumet et al., 1991). It was recently reported to be aberrantly expressed in human cancers (Chan et al., 2011; Tsourlakis et al., 2013). Overexpression of NRCAM promotes cell proliferation and motility. Previous study has reported that CAMs play an important role in the nervous system development (Sakurai, 2016). Taken together, considering the critical roles of the three genes in the coexpression network, we speculated that they may involve in glioma progression.
5. Conclusions
In conclusion, pathways of p53 signaling pathway and neuroactive ligand–receptor interaction may play important roles in glioma progression. PUS7, EFR3B, and NRCAM may be potential biomarkers of glioma. THBS1, CASP8, GRIA2, GRIA4, and ADCYAP1R1 may serve as prognostic markers in glioma.
Footnotes
Acknowledgment
This work was supported by the National Natural Science Foundation for Youth (Project No. 81400404).
Author Disclosure Statement
The authors declare they have no conflicting financial interests.