




Abstract
Weighted gene co-expression network analysis (WGCNA) is a widely used software tool that is used to establish relationships between phenotypic traits and gene expression data. It generates gene modules and then correlates their first principal component to phenotypic traits, proposing a functional relationship expressed by the correlation coefficient. However, gene modules often contain thousands of genes of different functional backgrounds. Here, we developed a stochastic optimization algorithm, known as genetic algorithm (GA), optimizing the trait to gene module relationship by gradually increasing the correlation between the trait and a subset of genes of the gene module. We exemplified the GA on a Japanese plum hormone profile and an RNA-seq dataset. The correlation between the subset of module genes and the trait increased, whereas the number of correlated genes became sufficiently small, allowing for their individual assessment. Gene ontology (GO) term enrichment analysis of the gene sets identified by the GA showed an increase in specificity of the GO terms associated with fruit hormone balance as compared with the GO enrichment analysis of the gene modules generated by WGCNA and other methods.
Introduction
With the advent of next-generation sequencing (NGS), transcript quantification has become possible for virtually all living organisms. As a consequence of steep reductions of per-base costs and progressive technological enhancements (Wadapurkar and Vyas, 2018), the number of studies employing NGS for transcript quantification has increased steadily (Lachmann et al., 2018). One of the aims of NGS studies is the detection of gene clusters that change their expression patterns in a co-ordinated manner throughout different conditions. To do so, a software tool, coined weighted gene co-expression network analysis (WGCNA) has been developed (Langfelder and Horvath, 2008). WGCNA generates correlation networks based on gene expression data. Highly interconnected genes are then clustered into modules, based on a topological overlap measure (Langfelder and Horvath, 2008). Subsequently, the first principal components of modules are computed, termed module eigengenes (ME), which then can be correlated to trait data. Based on the correlation coefficient between MEs and the external traits, modules that likely include genes significantly impacting the trait of study are identified. WGCNA is a method that has been extensively used, for example, for the proposal of marker genes associated with Alzheimer's disease (Miller et al., 2010) or to highlight conservation and divergence of gene expression between human and chimpanzee brains (Oldham et al., 2006).
Modern software for the alignment of RNA-seq data to existing genomes (Dobin et al., 2013), coupled with high-performance computing, has the capability to rapidly align transcripts up to the coding sequence (CDS) level, rendering datasets of quantified expression (Anders et al., 2015) with hundreds of thousands of features. Thus, WGCNA often generates modules containing thousands of different CDSs. Although their corresponding MEs can still be correlated to particular traits, the number of CDSs per module is overwhelming, exacerbating the identification of marker genes or the comparison between networks. Aiming at reducing the number of genes in a module, we developed a genetic algorithm (GA).
A GA is a heuristic search method that is capable of detecting a near-optimal solution to a given search problem via the application of the principles of the theory of evolution (Mitchell, 1996); that is, the GA gradually increases the quality (fitness) of a collection of solutions over a given number (g) of generations. A GA initiates the search with a random population of x solutions, followed by natural selection, whereby a fitness value is assigned to each solution, increasing or decreasing their chances to reproduce with another “solution” (individual) in the population. The reproduction process is characterized by one or more recombination events, generating the next generation of solutions (offspring). Finally, a mutation process may occur modifying the “genetic” makeup of the offspring. GAs are commonly used for the analyses of biological data, for example, for multiple sequence alignments (Notredame and Higgins, 1996; Gondro and Kinghorn, 2007), motif discovery (Wong et al., 2011), RNA structure prediction (Vanbatenburg et al., 1995), etc.
Here, we describe the development of a GA customized for the optimization of CDSs/genes of modules in respect to a phenotypic trait. The GA successfully narrowed down the set of potential candidate genes to a number sufficiently small allowing for their individual analysis and concomitantly increased the trait to gene specificity. We applied our GA on datasets comprising RNA-seq and hormone-associated metabolites from two varieties of Japanese plum fruit during on-the-tree ripening and during postharvest storage (Farcuh et al., 2017, 2018, 2019). The two cultivars differed in their ripening behavior (Kim et al., 2015): a climacteric cultivar Santa-Rosa (SR), producing increased levels of autocatalytic ethylene and respiration rates during fruit ripening, and its nonclimacteric bud sport mutant Sweet Miriam (SM) showing no ethylene production or high respiration rates during ripening.
Methods
Datasets acquisition and processing
Datasets for RNA-seq and hormone levels were adopted from Farcuh et al. (2017, 2018, 2019). Preprocessing and quantification of transcripts and hormones were performed as described therein.
Weighted gene co-expression network analysis settings
All data were log-transformed for usage with WGCNA. WGCNA version 1.60 was used. Execution of WGCNA was performed as instructed in Langfelder and Horvath (2008) and the associated tutorial. Soft thresholding of the adjacency matrix was achieved at β = 17. The manual hybrid model (Fig. S4) was chosen to generate gene modules.
Genetic algorithm parameterization
Before the initiation of the GA, all negatively correlated genes to each trait were removed from the module expression matrix. The GA was run with all parameters set to their respective default values. The GA was set to achieve an absolute |fitness| value.
Gene Ontology term enrichment analysis
For the GO term enrichment analysis, we used Agrigo (http://bioinfo.cau.edu.cn/agriGO/) (Du et al., 2010; Tian et al., 2017). We performed a singular enrichment analysis against the Phytozome v11.0 P. persica v.2.1 genome.
Availability and dependencies
The source code for the GA is available under: https://github.com/toubiana/GENETIC_ALGORITHM
Operating system(s): Platform independent
Programming language: R
The GA operates in R without any dependencies, but we recommend installing package WGCNA for gene module generation.
Results
Hormones specifically correlated to two module eigengenes
This study is based on datasets of Japanese plums previously published (Farcuh et al., 2017, 2018, 2019). In brief, gene expression and fruit hormone contents were measured in two cultivars: a climacteric SR and its nonclimacteric bud-sport mutant SM, during fruit development on-the-tree as well as throughout postharvest storage and in response to ethylene treatments. Gene expression analyses and contents of abscisic acid (ABA), ethylene, indole-3-acetic acid (IAA), gibberellins (GA1 and GA3), salicylic acid (SA), and the cytokinins trans-zeatin (tZ) and its precursor isopentenyl (iP) were performed at 12 different fruit development stages (Farcuh et al., 2017, 2018, 2019).
Transcripts from RNA-seq sequencing were aligned and quantified at the CDS level against the Prunus persica genome (Verde et al., 2013, 2017). All 12 storage stages were compared for differentially expressed CDSs (Anders and Huber, 2010), and a total of 18,714 differentially expressed CDSs were identified. Subsequently, the relative expression values of all 18,714 CDSs were fed into the WGCNA pipeline (Methods section). Overall, 18,621 out of the 18,714 transcripts were clustered into 14 modules (Table 1), whereas 93 CDSs remained unclustered. MEs were computed for all 14 modules and correlated to the profiles of all 8 hormones. The correlation analysis revealed that all hormones had the strongest positive correlation to either ME darkslateblue, where the corresponding module contained 2142 CDSs, or ME turquoise, where the corresponding module contained 4437 CDSs (Fig. 1). The following correlation coefficients were recorded between ME darkslateblue and ABA = 0.64, ethylene = 0.79, and IAA = 0.77; and ME turquoise and GA1 = 0.73, GA3 = 0.79, iP = 0.36, SA = 0.94, and tZ = 0.96, respectively (Fig. 1).

ME to hormones correlation heatmap. Heatmap representation of the correlation analysis of 14 MEs and 8 hormones. The lower triangle illustrates the correlation coefficients, where a red rectangle represents a negative correlation and a blue rectangle a positive correlation. The upper triangle (shaded area) represents the corresponding p-values. Variables on the x and y axes are ordered as determined by hierarchical clustering. ME, module eigengenes.
Weighted Gene Co-expression Network Analysis Modules
CDS, coding sequence.
Bold values correspond to the modules with the strongest correlations to hormones.
The Gene Ontology (GO) initiative was developed to provide a system, in which sets of genes can be classified hierarchically in a graph-like structure (Harris et al., 2008). GO term enrichment analysis is the natural successor to WGCNA, whereby genes of modules identified via correlation analysis are analyzed to establish a functional relationship between the genes and the trait under investigation.
We identified the corresponding genes to all the CDSs within the modules darkslateblue and turquoise (Supplementary Data S1) and performed GO enrichment analysis (Tables 2 and 3). Genes of module darkslateblue were categorized into 67 different significant (determined by a false discovery rate multiple hypothesis testing correction) GO terms, whereas genes of module turquoise were categorized into 58 significant GO terms. In total, 110 different GO terms were represented in both modules.
Significant Gene Ontology Terms Associated with Module Darkslateblue
Significant Gene Ontology Terms Associated with Module Darkslateblue
FDR, false discovery rate.
Significant Gene Ontology Terms Associated with Module Turquoise
To optimize the correlation between hormones and the genes within a module, and to reduce the number of candidate genes, we developed a GA for trait-related gene selection (TRGS). We denoted the matrix of a gene expression module as Expr of size m × n, where 1 ≤ i ≤ m represented conditions (Con) and 1 ≤ j ≤ n genes (Gen). Within a given Expr, the TRGS algorithm identified a subset of genes showing the greatest correlation coefficient of its first principal component E to a given hormone H. Given Expr, the TRGS optimization objective can be defined as:
where C is a subset of genes in the module, Expr[
A typical GA defines the population (structure and initial set of possible solutions), recombination and mutation (operators used to search through the space of possible solutions), and the fitness function (the optimization objective). Following the bio-inspired terminology common to GAs, we will refer to solutions of the optimization problem as chromosomes. An overview of TRGS can be seen in Figure 2. TRGS main components are discussed next.
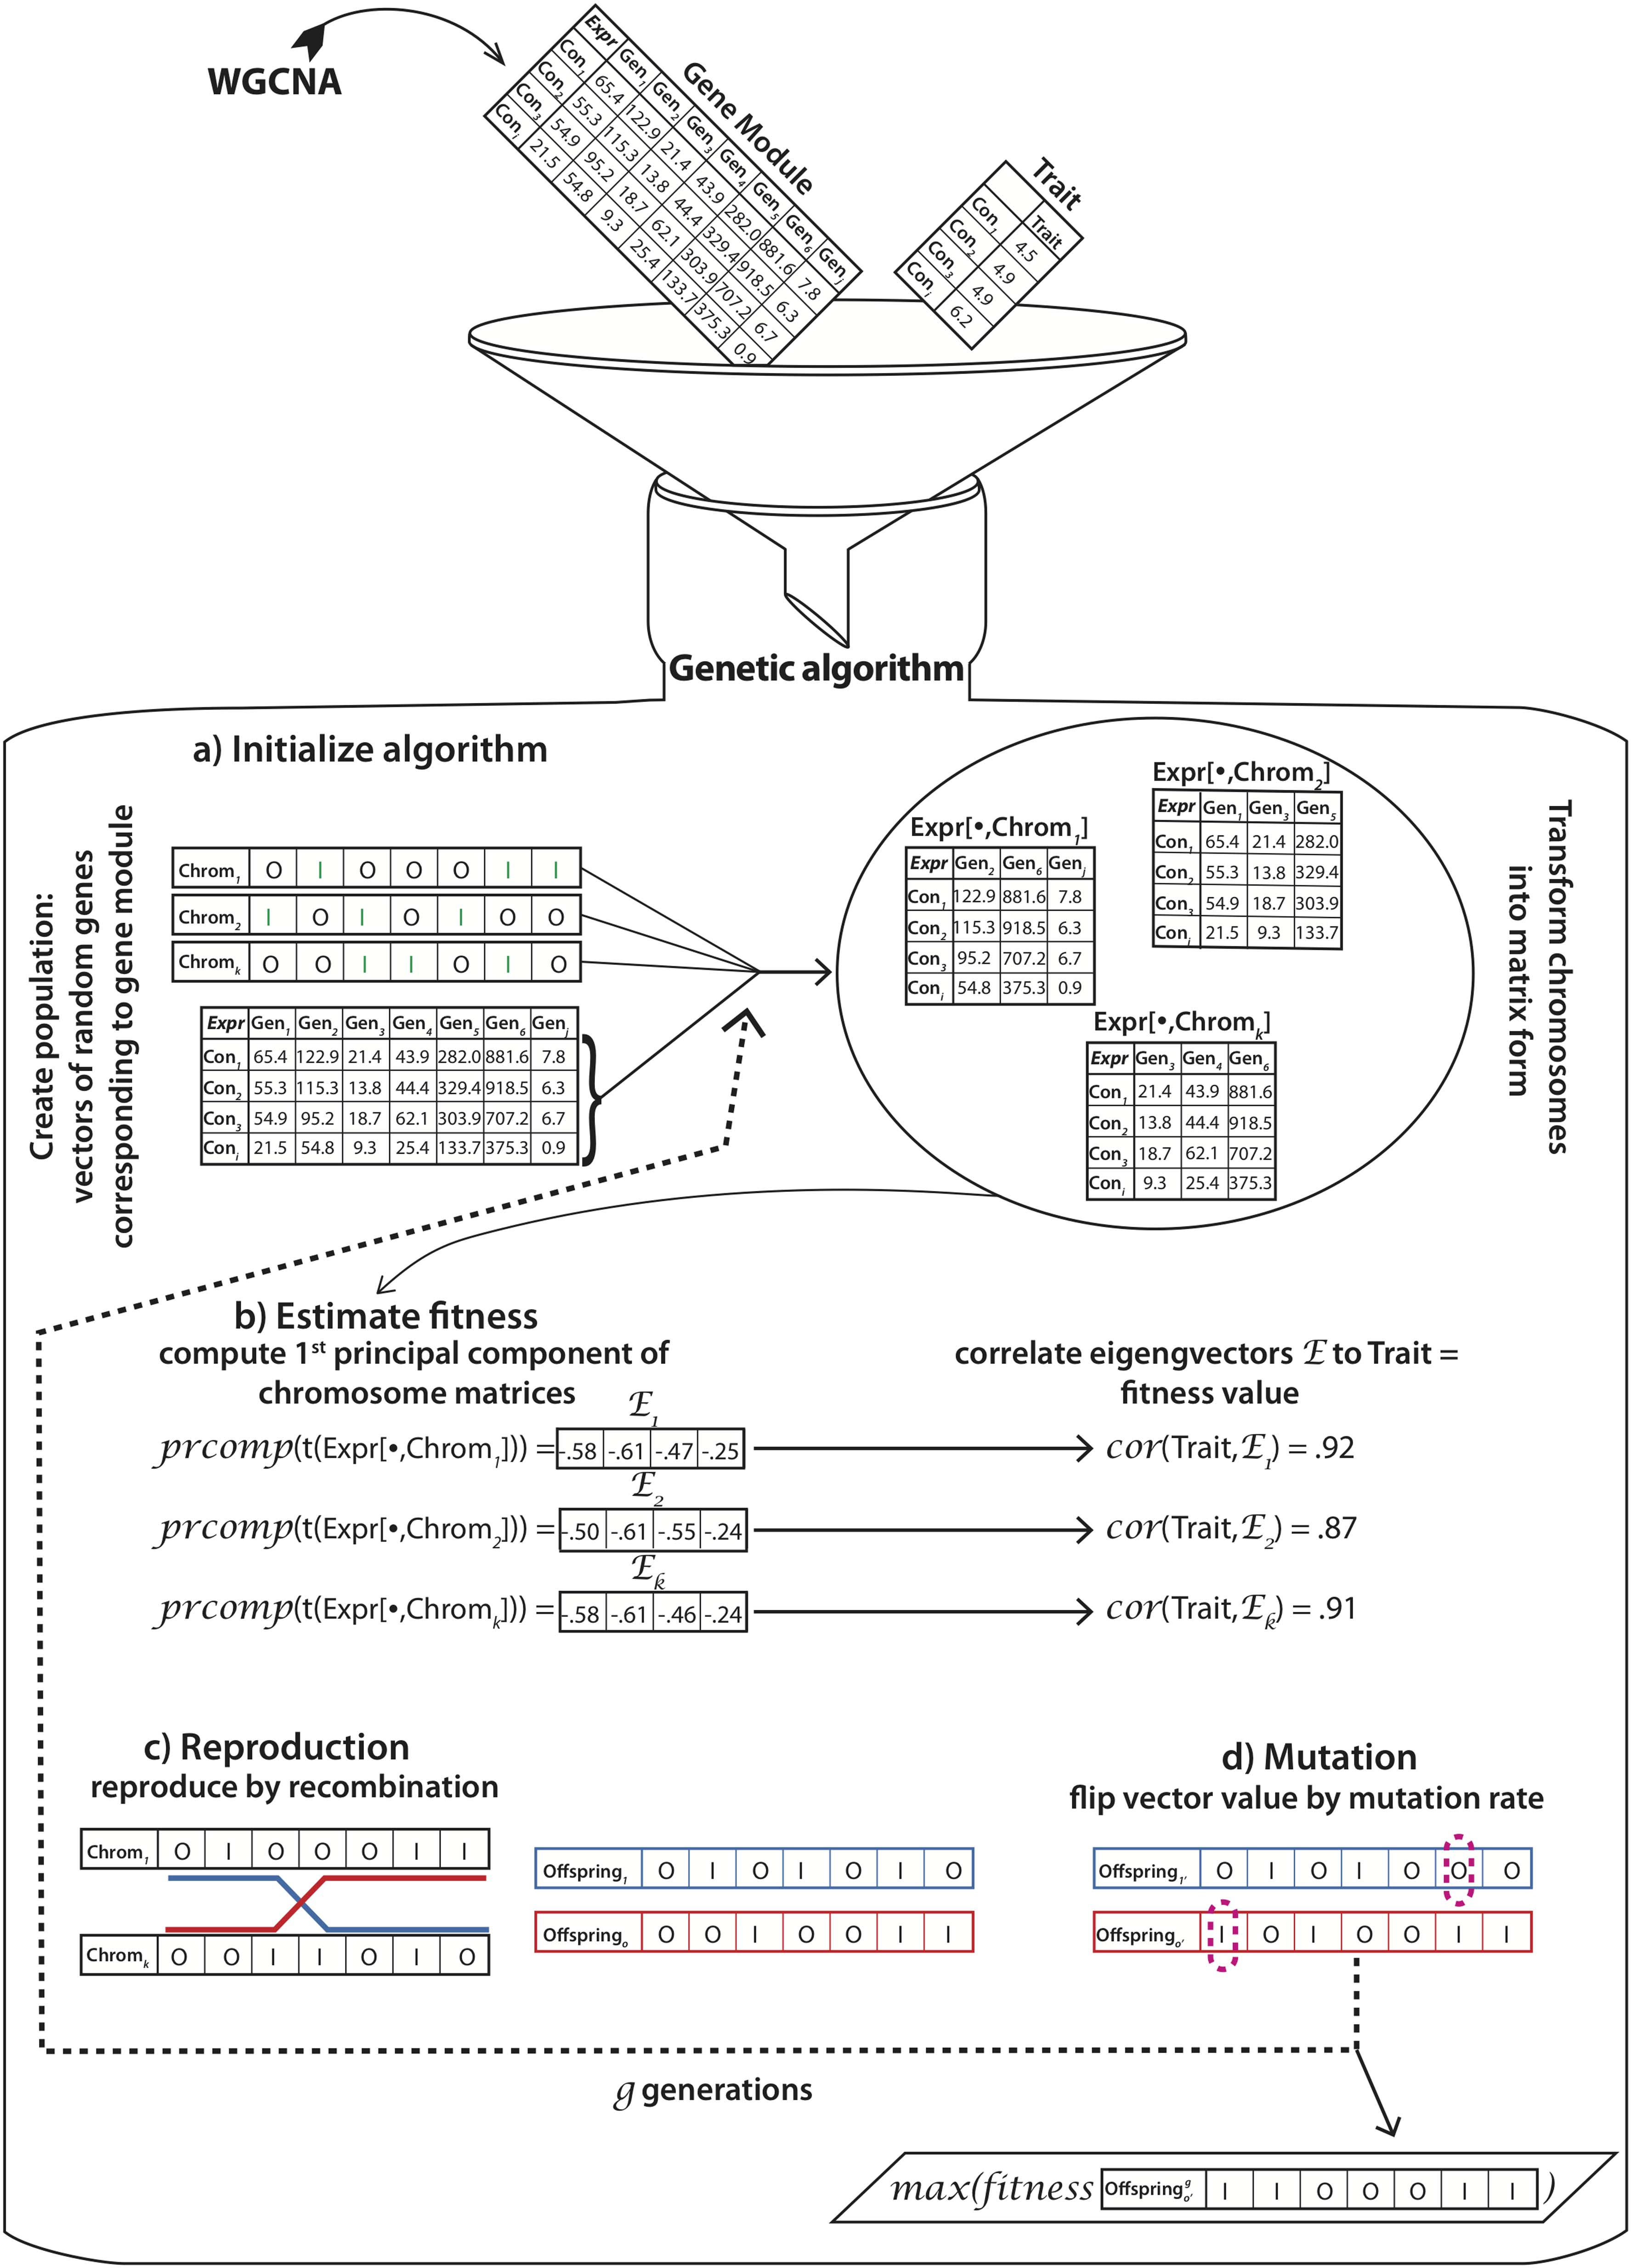
GA overview. A gene expression dataset Expr corresponding to the subset of genes of the gene module generated by WGCNA of size m × n, where 1 ≤ i ≤ m represents conditions (Con) and 1 ≤ j ≤ n genes (Gen) and a dataset of traits T is fed into the GA;
TRGS intakes seven arguments, namely: (1) the expression matrix Expr; (2) the population size ps, corresponding to the number of chromosomes within a single generation. The default value of ps was 1000 and remained unchanged throughout the algorithm execution. Each chromosome was represented by a binary vector of size n, where the value “1” represented a “selected gene” and “0” represented an “ignored gene”; (3) number of genes ng, representing the number of genes that should be available for chromosomes in the initial generation (the default is set to 10); (4) crossover events ce, which determined the number of crossover events that should occur during recombination of two chromosomes (the default is set to 1); (5) mutation rate mr, which determined the chance of each gene in a chromosome to flip its value reciprocally (the default is set to 0.001%); (6) number of generations g, which specified the number of generations TRGS should be running (the default is set to 1000); and (7) the trait to which the subset of genes should be correlated. As a result, the initial generation was created with chromosomes chrom1, chrom2…chrom k … of length n, where 1 ≤ k ≤ ps and where ng random cells of each chromosome were set to 1 and the rest were set to 0.
Trait-related gene selection fitness function
The fitness value of each chromosome determined its chances to participate in a reproduction event. Here, we first selected a subset of columns of the expression matrix corresponding to the selected genes in each chromosome, for example, Expr[
Trait-related gene selection recombination
Chromosomes with greater fitness have higher chances to participate in a recombination event to generate chromosomes for the subsequent generation. The GA considered that recombination took place between two different chromosomes (mother and father chromosome) only. The amount of crossover events between mother and father chromosomes was determined by parameter ce. The locus l for the crossover event was determined randomly. At the specified l, the mother and father chromosomes were split, so that the child chromosome chromoffspring was composed of chrommother[1:l] and chromfather[(l + 1):n] (Fig. 2c). Each offspring generation was composed of the same number of chromosomes corresponding to ps.
Trait-related gene selection mutation
After the recombination step, each chromoffspring was subjected to a possible mutation event, where each value in the chromosome could change from 0→1 or from 1→0, respectively, determined by mr (Fig. 2d).
Trait-related gene selection return values
After the TRGS had run for g generations, it returned a set of binary vectors corresponding to the final generation (denoted lastpopulation) and the fitness values of each one of them. We also recorded the average fitness of every generation for further analysis of the algorithm performance.
Genetic algorithm performance evaluation
We employed the GA on module darkslateblue for hormones ABA, ethylene, and IAA and on module turquoise for hormones GA1, GA3, iP, SA, and tZ. To test for its performance, the GA was executed 100 times (iterations) for each hormone to its respective module. We recorded the average correlation for each generation across the 100 iterations and its respective standard deviations (Fig. 3). Unequivocally, the GA increased the magnitude of correlation over 1000 generations in all 100 iterations. For the final generation, ABA recorded an average correlation coefficient of 0.97, when correlating its E to a subset of CDSs of module darkslateblue versus the original value of 0.64 to ME darkslateblue. Further, the greatest correlation between any CDS in module darkslateblue to ABA was estimated at 0.91 (Table 4). The respective values for ethylene were 0.98 versus 0.79 and 0.9; for IAA, 0.98 versus 0.77 and 0.98; for ME turquoise, the respective values for GA1 were 0.94 versus 0.73 and 0.96; for GA3, 0.98 versus 0.79 and 0.96; iP increased to 0.91 versus 0.36 and 0.62; SA recorded 0.98 versus 0.94 and 0.92; and tZ increased to 0.99 versus 0.96 and 0.95. Other GA-associated performance measures are summarized in Supplementary Figures S1, S2, S3.
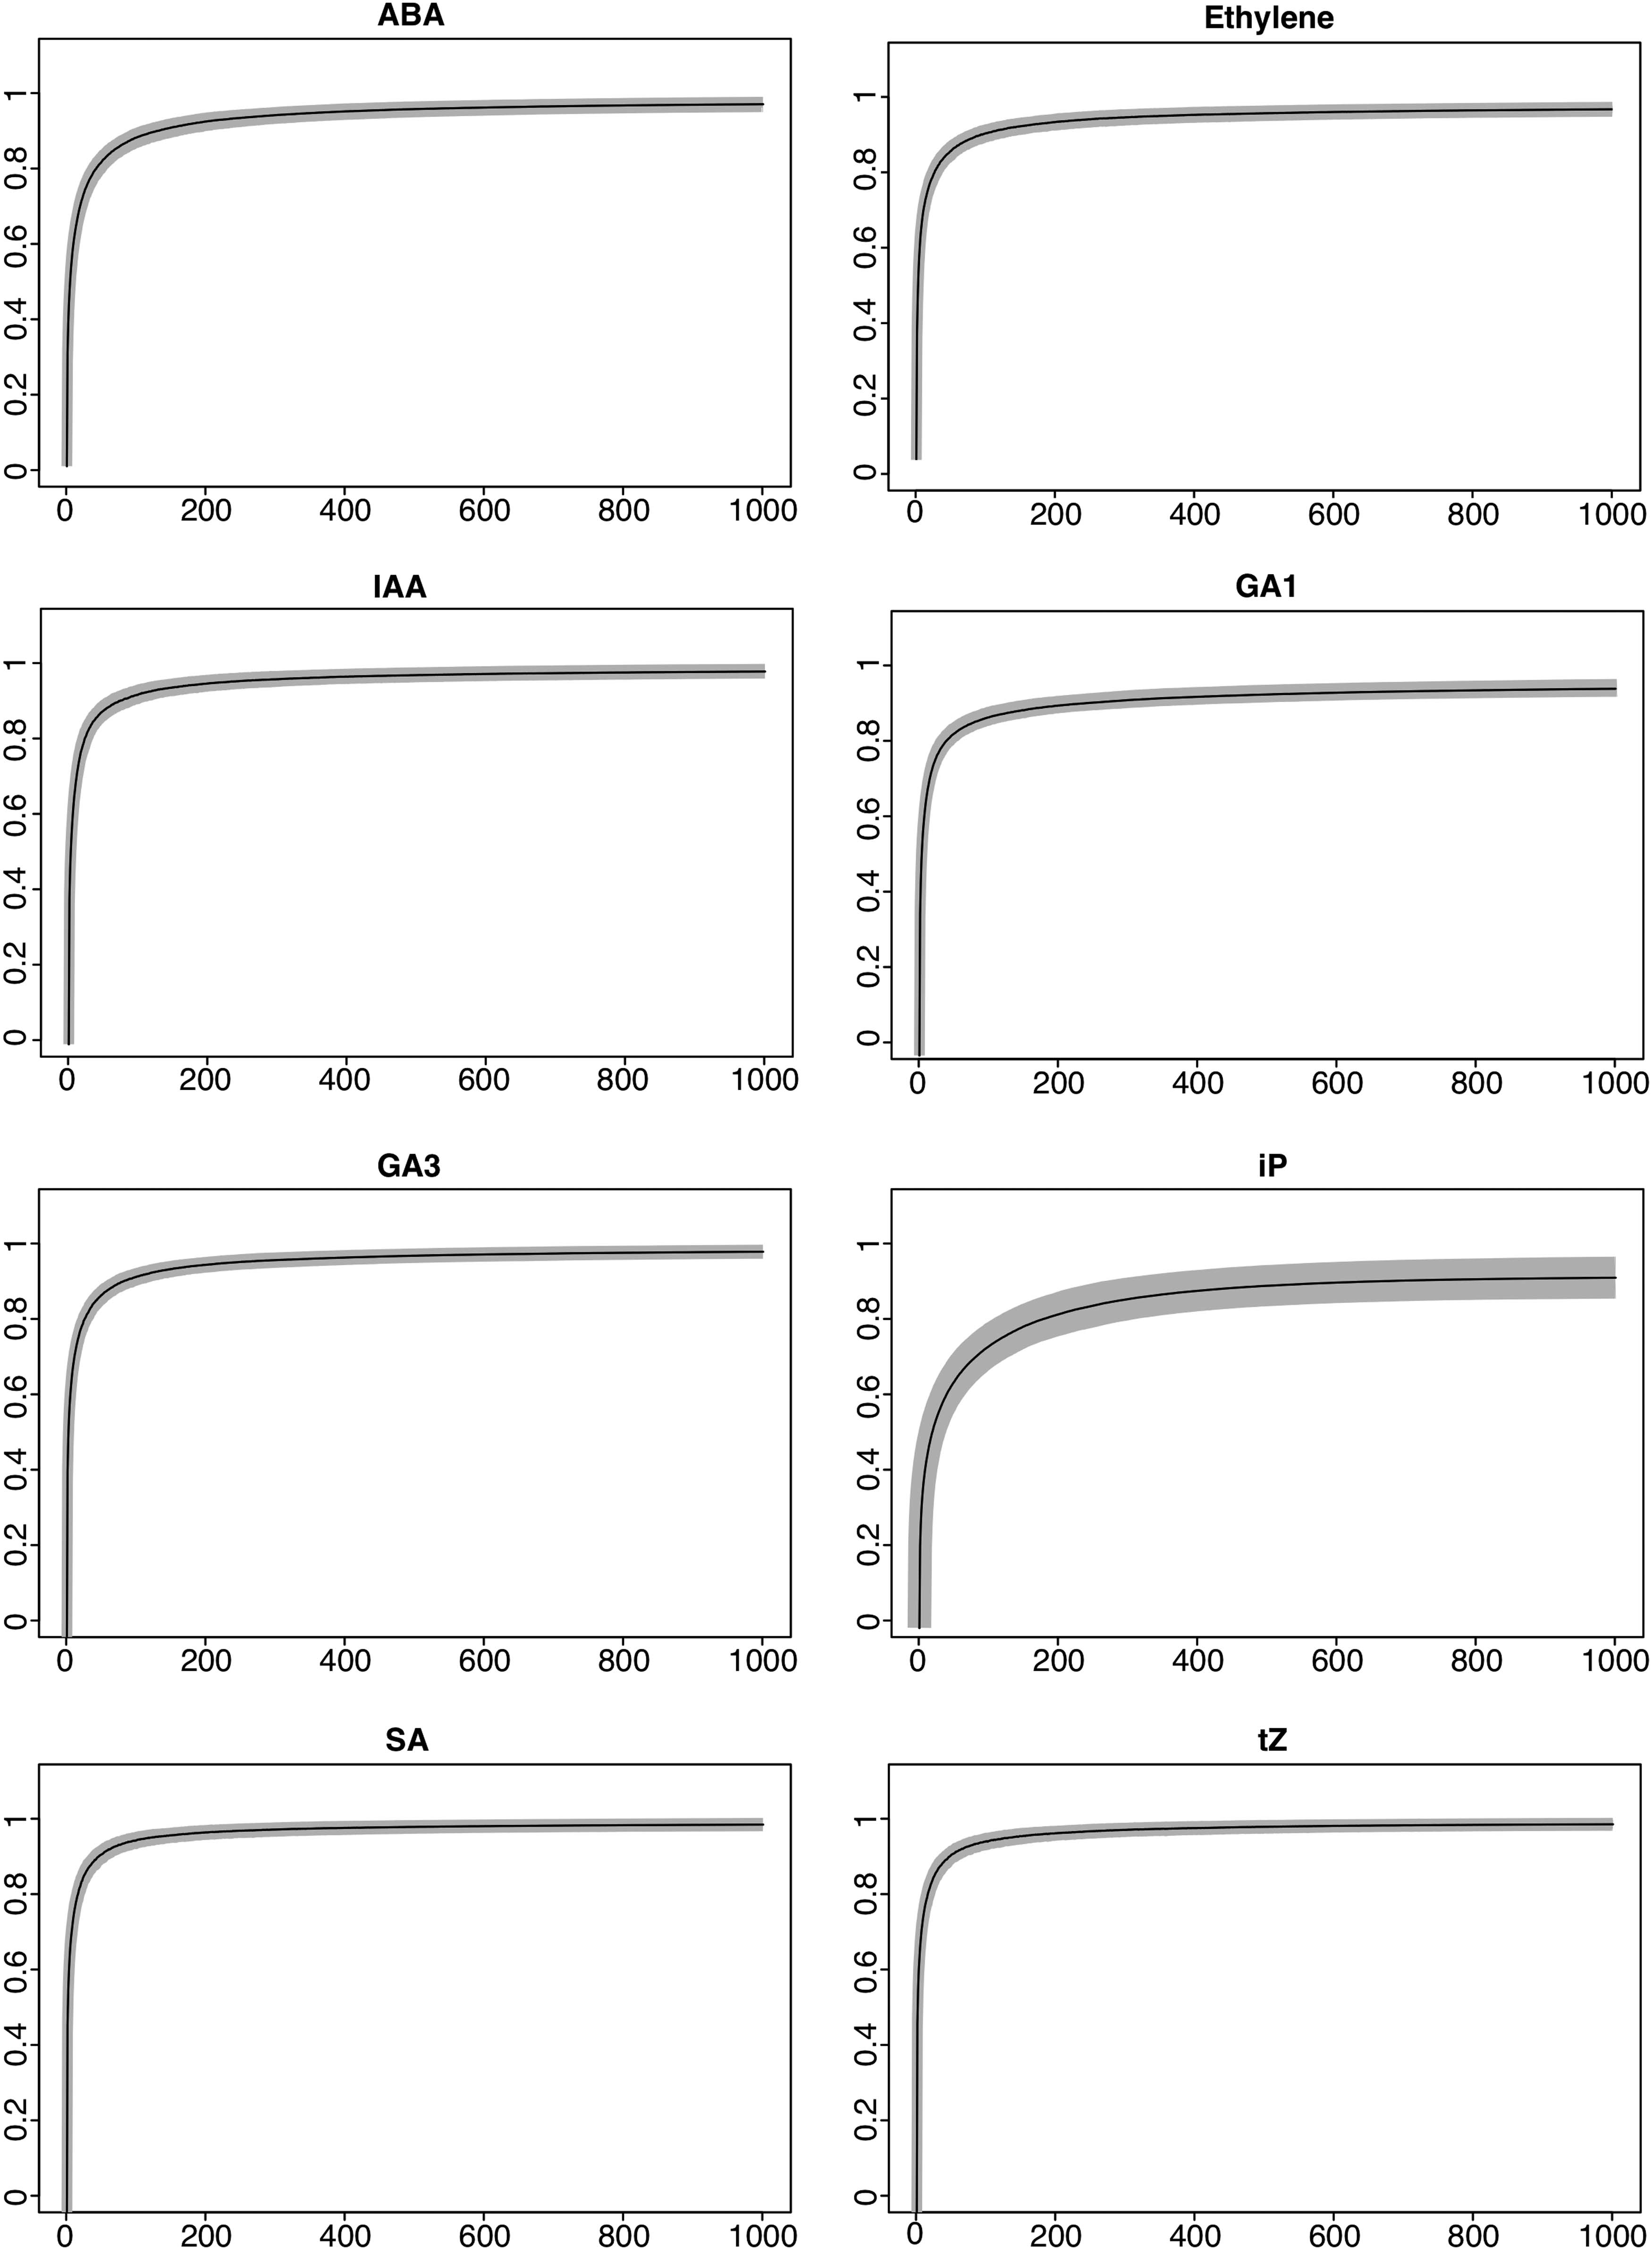
GA average correlation over 1000 generations and 100 iterations. The GA was performed for 1000 generations and with 100 iterations for all 8 hormones. ABA, ethylene, and IAA were run against CDSs of module darkslateblue, whereas GA1, GA3, iP, SA, and tZ were run against CDSs of module turquoise. The average for each generation across iterations was recorded. X-axes represent generations, y-axes represent correlation coefficients, and gray shaded areas represent standard deviations. ABA, abscisic acid; CDS, coding sequence; GA1 and GA3, gibberellins; IAA, indole-3-acetic acid; iP, precursor isopentenyl; SA, salicylic acid; tZ, trans-zeatin.
Correlation Overview
ABA, abscisic acid; GA, genetic algorithm; GA1 and GA3, gibberellins; IAA, indole-3-acetic acid; iP, precursor isopentenyl; ME, module eigengenes; SA, salicylic acid; tZ, trans-zeatin.
To select for putatively biologically meaningful genes, threshold settings were applied on the optimized solutions. Given that the application of the GA on different datasets produces different outcomes, the threshold settings were defined to be relative to the outcome; that is, given 1000 chromosomes with binary values (genes) in the final generation of each iteration: (1) a summation vector of length chromosome with the summed-up value for each gene for all chromosomes of the final generation over all iterations;
where f represents iteration, k chromosome, and g generation,
(2) next, duplicate values of the summation vector were removed as a function of:
(3) finally, the threshold was defined as the average of the unique values:
where n detects the length of the vector.
CDSs above the threshold were included into the final subset of the modules' CDSs—the corresponding genes of the modules and the subset of corresponding genes identified for the eight hormones can be viewed in Supplementary Data S1. For ABA, the GA optimized for 213 CDSs, for ethylene 197 CDSs, and for IAA 190 CDSs in contrast to the 2142 CDSs in module darkslateblue. For GA1, 211 CDSs were identified; for GA3 284 CDSs; for iP 183 CDSs; for SA 313 CDSs; and for tZ 303 CDSs in contrast to 4437 CDSs in module turquoise.
Comparative genetic algorithm performance evaluation
To evaluate the performance of the CDS subsets determined by the GA in comparison to other subsets of CDSs of the respective modules, we correlated the first principal component of the final CDS subsets, determined by the threshold settings as described earlier (similar to step b in Fig. 2), to their respective hormones. For ABA, an absolute correlation coefficient of 0.98 was computed: for ethylene 0.98, for IAA 0.98, for GA1 0.96, for GA3 0.99, for iP 0.94, for SA 0.99, and, finally, for tZ 0.99 (Fig. 4). Subsequently, empirical p-value analysis was employed, where for 100,000 random subsets of CDSs from modules darkslateblue and turquoise the correlation coefficient of their first principal component to their respective hormones was estimated. The number of CDSs for the random subsets corresponded to the number of CDSs present in the final subset, as determined for each hormone (see Section 3.10). Unequivocally, the subsets determined by the GA recorded higher correlation coefficients than any of the random subsets (Fig. 4).

Comparative performance evaluation. Bar-graph representation of the correlation coefficient of the first principal component of the subsets of CDSs versus their respective hormones. The analysis was performed for the subsets determined by the GA (black bars), by the strongest correlating CDSs (dark grey bars), and intramodular connectivity (light gray). Empirical p-value analysis was performed for subsets of CDSs determined by GA. The corresponding values are indicated above the black bars. X-axes represent hormones, and y-axes represent correlation coefficients.
Next, we pairwise correlated hormone profiles to each CDS expression profile of their respective modules. Then, we chose the CDS profiles with the strongest correlation coefficients and correlated their first principal component to their respective hormones. Again, the number of CDSs with the greatest correlation corresponded to the number of CDSs present in the final subset, as determined for each hormone. Also, the correlation coefficient for the subset of CDSs determined by the GA was invariably greater than the correlation coefficient for the subsets of CDSs determined by pairwise correlation.
WGCNA includes an approach for determining the most contributing genes within a module. The approach is based on using the weights of the correlation coefficients (edges in a graph) for each node within the module, where nodes with the greatest accumulative weight are considered the most contributing. The value derived from this approach is termed “intramodular connectivity” (Dong and Horvath, 2007). We determined the CDSs with the greatest intramodular connectivity values and correlated their first principal component to their respective hormones. The number of CDSs based on the intramodular connectivity corresponded to the number of CDSs present in the final subset for each hormone. The subsets of CDSs determined by the GA recorded greater correlation coefficients than the subsets ascertained by intramodular connectivity (Fig. 4).
To provide a biological perspective to the GA outcomes, we performed GO term enrichment analysis for (1) all eight sets of genes generated by the GA, (2) all eight sets of the highest correlating CDSs, (3) and intramodular connectivity. Based on the GA (Table 5), 65 different GO terms were identified, of which 20 were associated with hormones based on module darkslateblue. Out of the 20 identified GO terms, none intersected between hormones ABA, ethylene (Fig. 5a). For hormones based on module turquoise, 49 different GO terms were identified (Table 5), of which 18 (37.5%) intersected between hormones GA1, GA3, iP, SA, and tZ (Fig. 5a). For the analysis of the strongest correlating CDSs, 75 significant GO terms were detected (Supplementary Data S2). For hormones based on module darkslateblue, 24 GO terms were identified, of which 1 (4.17%) intersected (Fig. 5b). For hormones based on module turquoise, 59 GO terms were identified, of which 51 (86.44%) intersected (Fig. 5b). For CDSs determined by the intramodular connectivity, 119 significant GO terms were detected (Supplementary Data S2). For hormones based on module darkslateblue, 65 GO terms were identified, of which 61 (93.85%) intersected (Fig. 5c). For hormones based on module turquoise, 57 GO terms were identified, of which 51 (92.98%) intersected (Fig. 5c). The high intersect of GO terms for intramodular connectivity stems from the fact that the identification of significant genes within a module is based on the module itself rather than from its relation to the trait.
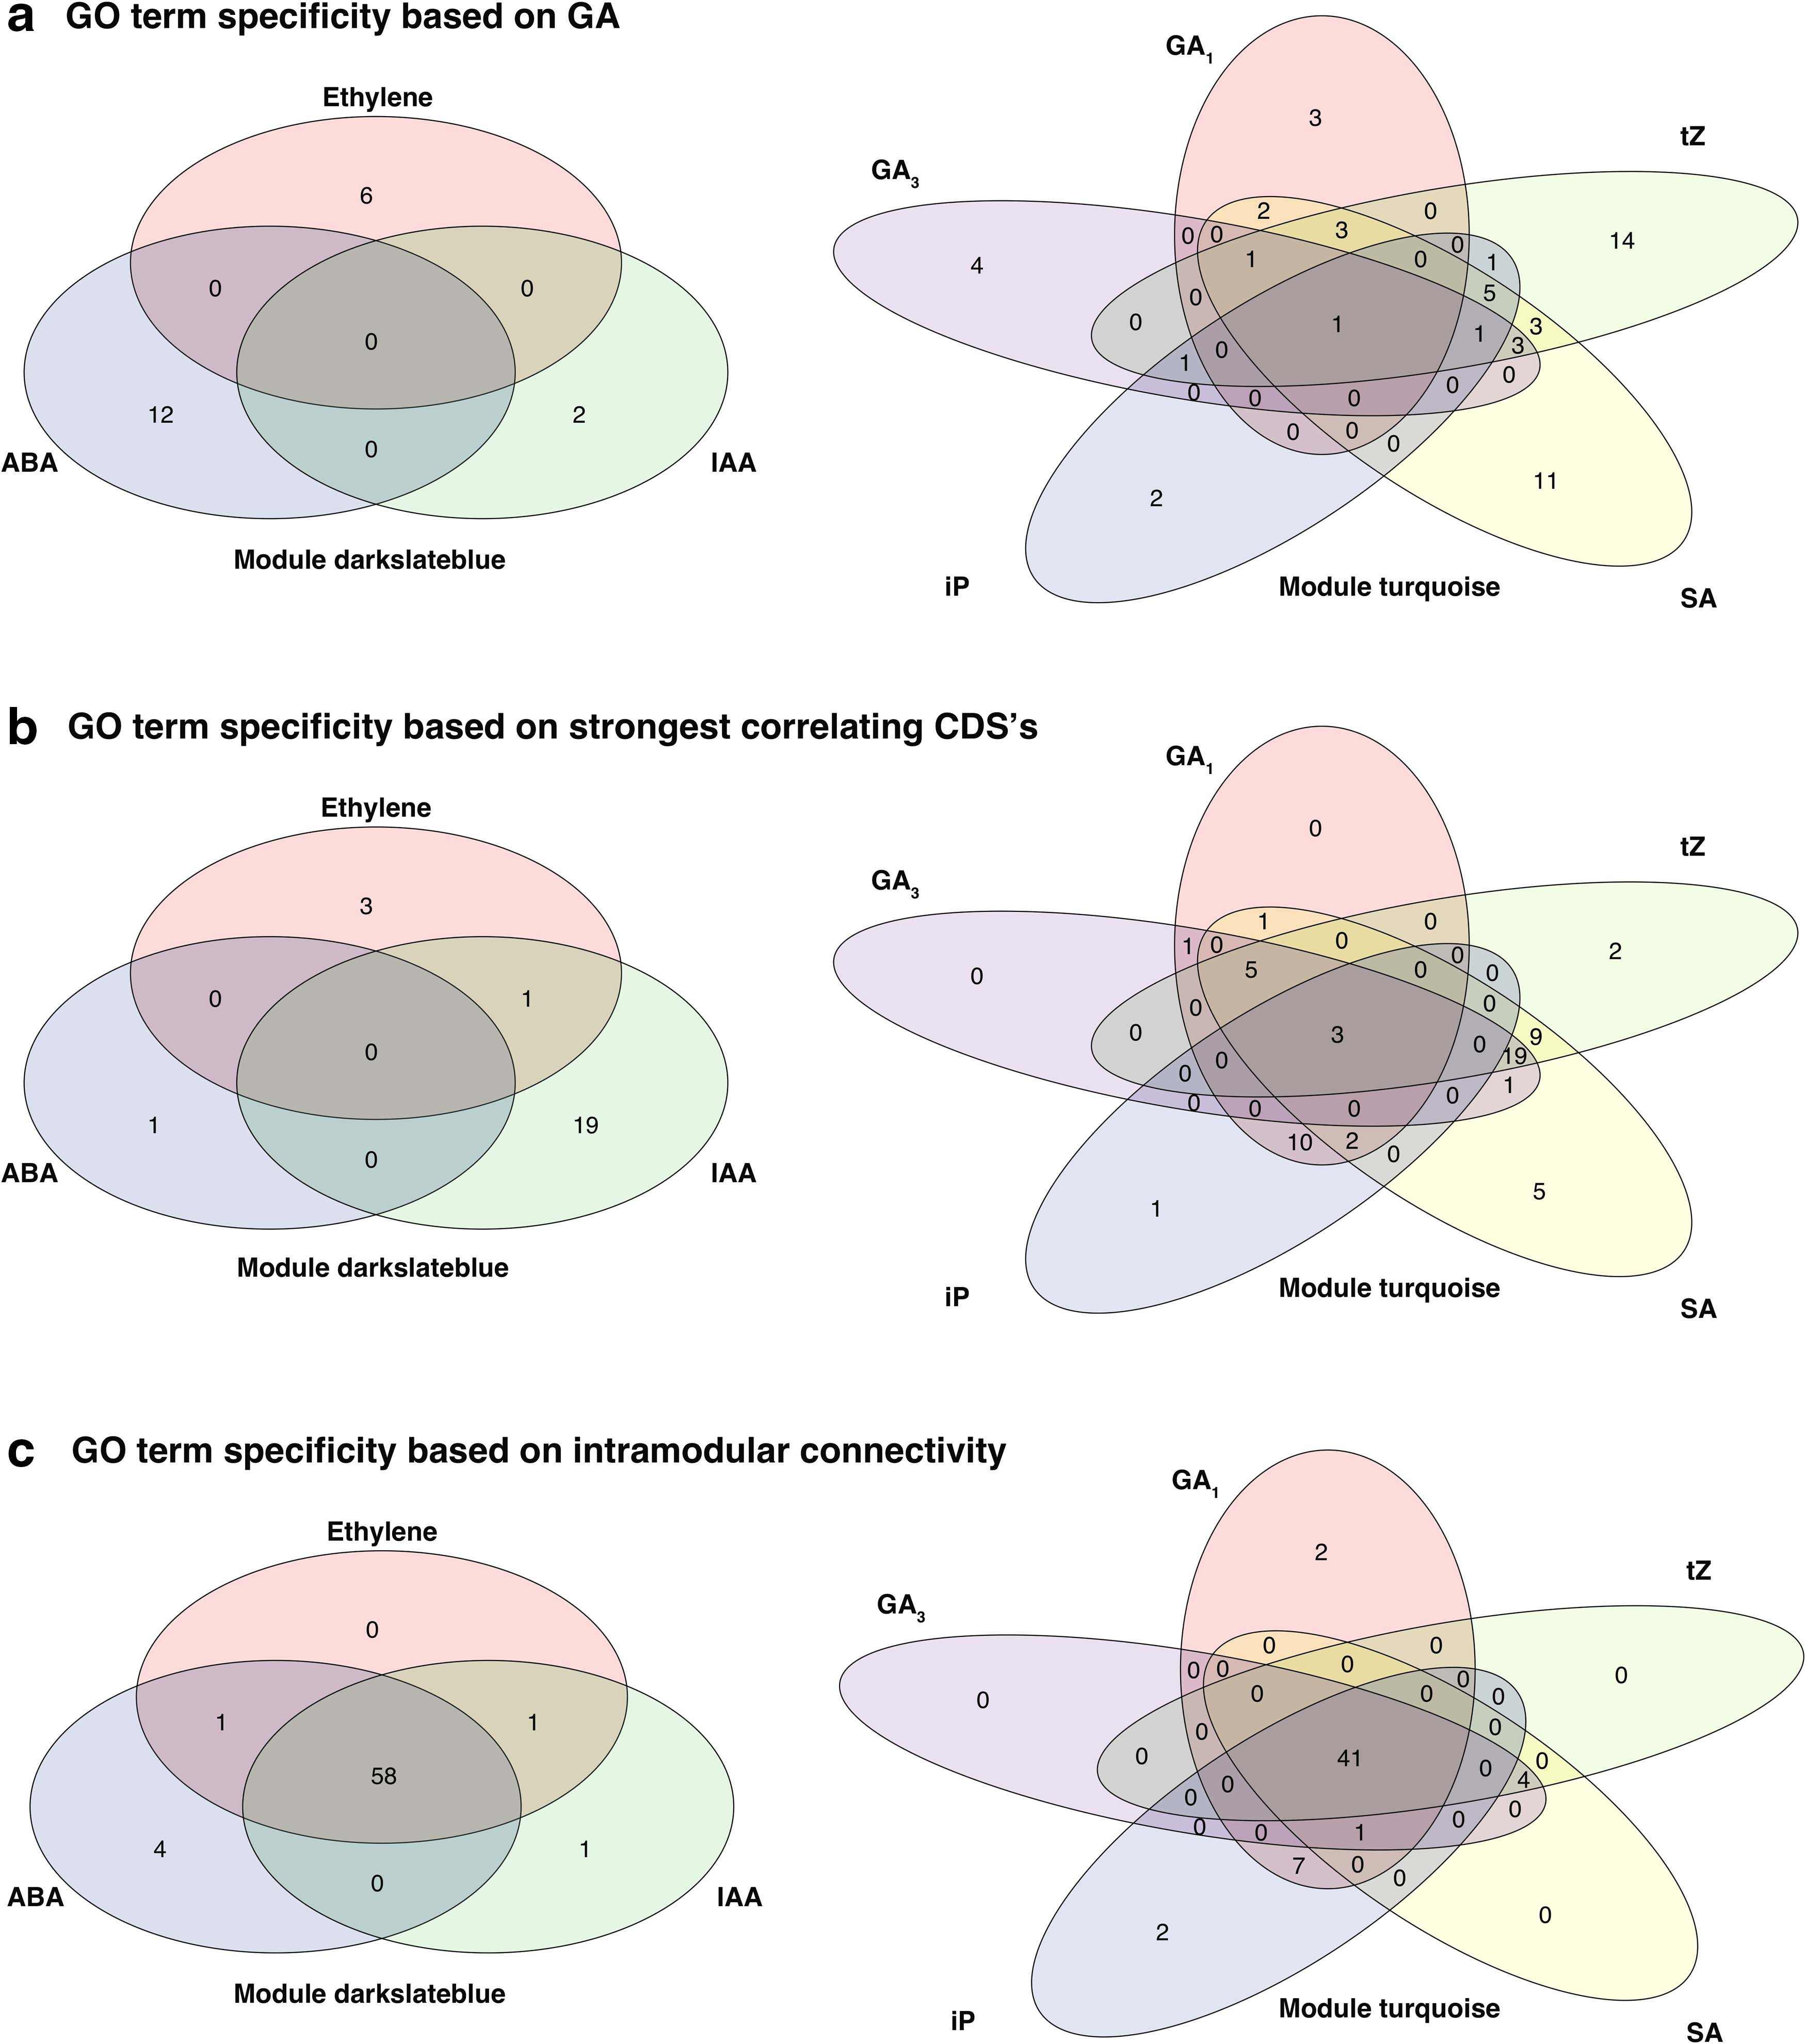
Intersect of GO terms associated with hormones. Illustrated are three sets of venn diagrams associated with the different methods for the identification of CDSs:
Significant Gene Ontology Terms Associated with Hormones Based on Genetic Algorithm
Significant GO terms for respective hormones are highlighted in bold.
GO, Gene Ontology.
When inspecting the genes identified by the GA (Supplementary Data S3), a number of genes found are highly associated with hormone regulation, for example, Prupe.1G349500, coding for the ABA-responsive GRAM domain-containing protein, functioning downstream of ABI5 (Mauri et al., 2016); Prupe.2G320300, encoding a heavy metal transport/detoxification superfamily protein (IAA has been associated with increased heavy metal levels in Brassica juncea) (Srivastava et al., 2013) in barley root tips (Zelinova et al., 2015); Prupe.7G031400, encoding a member of the auxin carrier family protein (Forestan and Varotto, 2012; Forestan et al., 2012); and Prupe.3G161500, encoding a gibberellin-regulated family protein, demonstrated to be involved in plant development (Zhong et al., 2015; Qu et al., 2016; Trapalis et al., 2017). In addition, four cytokinin-associated disease resistance proteins were detected (Prupe.2G066600, Prupe.7G138300, Prupe.8G179400, and Prupe.2G055700) (Choi et al., 2010; Grosskinsky et al., 2011; Argueso et al., 2012; Großkinsky et al., 2013).
Discussion
The identification of genes controlling phenotypic traits is one of the core goals in functional biology. A useful tool to accomplish this task is correlation-based network analysis, where gene expression and trait performance are quantified at different conditions and their co-ordinated behavior is expressed via a correlation coefficient. WGCNA is a useful tool for establishing gene-trait relationships, generating gene modules whose the first principal component is correlated to the trait under investigation. However, often these gene modules contain thousands of different genes, rendering the gene-trait relationships insufficiently determined to indicate a genuine functional association.
Here, we developed a GA-optimizing gene module to trait relationships, gradually increasing the correlation between the trait and a subset of genes comprising the module. We exemplified the GA on a Japanese plum dataset, where gene expression and content levels of eight different hormones were measured in fruits at different developmental stages in two genetically related cultivars. A comparison between the original correlation coefficient of MEs to hormones (Fig. 1) and the correlation coefficient of the gene subsets within the gene module to hormones (Fig. 3) showed that the GA improved the gene to trait relationships. Further, the comparison between genes detected via the GA and genes proposed by the strongest correlating genes, as well as the WGCNA integrated method intramodular connectivity, revealed that the approach presented in this study consistently outperformed the other two methods. Although the strongest correlating genes method also achieved relatively good results, it showed high fluctuations (Fig. 4).
In parallel, the GA succeeded in significantly reducing the number of genes associated with the respective hormones (Supplementary Data S1). The GA also discriminated the GO terms associated with the eight hormones (Tables 2, 3, 5, Fig. 5 and Supplementary Data S2). Assessment of the set of genes associated with each hormone identified single genes with defined function in hormone regulation (Supplementary Data S3).
Conclusions
We demonstrated that the GA developed in this study is a valuable extension to WGCNA, reducing the number of correlated genes to a number sufficiently small for the assessment of individual genes, thus identifying meaningful candidate genes for subsequent in vivo analyses. We exemplified our study on a fruit hormone and gene expression dataset, but we emphasize that this approach can be used on datasets of any origin (similar to WGCNA itself).
Footnotes

References
Supplementary Material
Please find the following supplemental material available below.
For Open Access articles published under a Creative Commons License, all supplemental material carries the same license as the article it is associated with.
For non-Open Access articles published, all supplemental material carries a non-exclusive license, and permission requests for re-use of supplemental material or any part of supplemental material shall be sent directly to the copyright owner as specified in the copyright notice associated with the article.
