
Abstract
Primary biliary cholangitis (PBC) is an autoimmune liver disease characterized by cholestasis and cirrhosis, and in which hepatic failure may occur. This study explores the changes in the gene expression profiles of liver tissues during the pathogenesis of PBC. Array dataset GSE79850 was downloaded from the Gene Expression Omnibus database. GeneSpring software was used to analyze differentially expressed genes (DEGs) in liver tissues from PBC patients compared with those from controls. Gene ontology (GO) annotation, the Kyoto Encyclopedia of Genes and Genomes (KEGG), and Reactome pathway enrichment analyses were performed by using Database for Annotation, Visualization and Integrated Discovery (DAVID) software. Cytoscape software was used to construct a protein–protein interaction (PPI) network. Plug-ins Molecular Complex Detection and iRegulon were used for clustering analysis and transcription factors related to key genes with PBC. A total of 77 DEGs, including 47 up- and 30 downregulated genes, were identified. The PPI network was established with 74 nodes and 356 protein pairs. The C-C motif chemokine ligand 5 (CCL5), interleukin 7 receptor (IL7R), and TNF receptor superfamily member 1A (TNFRSF1A) were identified as hub genes in the PPI network and may, therefore, be marker genes for PBC. Further, the upregulated genes CCL5 and IL7R, and downregulated TNFRSF1A were included in immune system processes as a GO term in the category Biological Processes. In conclusion, CCL5, IL7R, TNFRSF1A, and the immune response pathway may have crucial roles in PBC. These genes and pathways may be potential targets for treating PBC.
1. Introduction
Primary Biliary Cholangitis (PBC) is an intrahepatic cholestasis disease involving the interlobular bile duct in the liver. The etiology and pathogenesis of PBC have not been fully clarified. Genetic susceptibility, environmental factors, and immune tolerance deficits are related to the pathogenesis of PBC (Chen et al., 2016). PBC has a hidden onset, and symptoms of patients with PBC are often atypical in the early stage and tend to be ignored and easily misdiagnosed. Once diagnosed, the illness tends to be severe, progressing to a decompensation period of cirrhosis, with refractory ascites, upper gastrointestinal bleeding, and hypersplenism. Anti-mitochondrial antibody (AMA) is a specific diagnostic marker of PBC and is used for the early diagnosis of PBC. The positive rate of the AMA-M2 subtype is 90%–95%. However, many studies have suggested that AMA is not relevant to clinical disease progression and disease classification, and AMA cannot be cleared from the body after treatment or liver transplantation (Luettig et al., 1998; Miyakawa et al., 2001). Because of intrahepatic cholestasis, the most significant changes in biochemical indicators in PBC patient serum are those in alkaline phosphatase (ALP) and gamma-glutamine peptide. A total of 96% of PBC patients demonstrated ALP levels that are typically 2–10 times higher than healthy levels, and this is seen in early and asymptomatic patients but these indicators are not specific.
The diagnosis of PBC needs to meet two of the following three criteria (European Association for the Study of the Liver, 2009; Lindor, 2009; Bowlus and Gershwin, 2014; Zweers et al., 2017): (1) AMA titer >1:40; (2) ALP level is 1.5 times higher than the normal upper limit and lasts for more than 24 weeks; and (3) liver biopsy shows nonsuppurative cholangitis and interlobular bile duct damage. However, patients with AMA negativity have difficulty in early diagnosis and differentiation from other autoimmune liver diseases and to make a definite diagnosis requires an invasive liver biopsy that not only increases the economic burden but also results in psychological and physical harm to PBC patients, and often misses the best timing for treatment. Moreover, ursodeoxycholic acid (UDCA), the only drug approved by the FDA for the treatment of PBC, failed to treat some patients with poor prognosis and such patients later progressed to liver failure. Therefore, early diagnosis and evaluation of PBC are urgently required.
PBC is a complex classic autoimmune disease with obvious genetic components and strong environmental effects. Although the etiology of the disease is unclear, the role of genetic factors is widely known and when combined with exposure to environmental factors, it may lead to the collapse of immune tolerance. It is now acknowledged that patients with PBC lose their tolerance to mitochondrial antigens, and in particular, the E2 component of the pyruvate dehydrogenase complex results in biliary epithelial cell invasion, ultimately leading to bile duct injury, cirrhosis, and liver failure. Genome-wide association studies (GWAS) on PBC patients have been extensive, and many studies have found that there is a significant association between different populations and the onset of PBC. A GWAS study of human leukocyte antigen (HLA) showed that the HLA-DQA1 and HLA-DQB1 loci are strongly correlated with PBC disease susceptibility and, in particular, the HLA-DRB1T, HLA-DQA1, and HLA-DQB1 loci.
However, 80%–90% of PBC patients do not carry these common HLA susceptibility alleles, so HLA cannot explain the entire genetic susceptibility underlying PBC, which indicates that other genes are related to the onset of PBC (Joshita et al., 2017). To date, GWAS have demonstrated that there are dozens of non-HLA sites in the entire genome that are significantly associated with PBC susceptibility (Hirschfield et al., 2009, 2010; Liu et al., 2010, 2012; Juran et al., 2012; Cordell et al., 2015). Moreover, many immune pathways are involved in PBC. For example, IL12-JAK-STAT4 signaling promotes Th1 T cell polarization and is associated with a risk to PBC patients.
In this study, for the purpose of screening the gene expression profiles of the liver tissue of PBC patients, we downloaded the GSE79850 dataset (Hardie et al., 2016) from the Gene Expression Omnibus (GEO) database (www.ncbi.nlm.nih.gov/geo) (Barrett et al., 2013), and GeneSpring software was used to analyze differentially expressed genes (DEGs). Moreover, gene ontology (GO) and pathway enrichment analyses were carried out. The related key genes and pathways may be potential diagnostic and therapeutic targets for PBC.
2. Methods
2.1. Gene Expression Omnibus data processing
The GEO database is an international public resource library for receiving, registering, archiving, searching, and downloading microarray chip, next-generation sequencing and other forms of high-throughput functional genomics data. We downloaded the GSE79850 array dataset based on the 770 gene Pan-Cancer Immunity panel platform (Nanostring®; nCounter, Seattle, WA) from the GEO database. The dataset contains 24 liver tissue samples, including 9 high-risk PBC samples, 7 low-risk PBC samples, and 8 control samples, and we combined the high-risk and the low-risk into one group called the PBC group.
2.2. Identification of differentially expressed genes in primary biliary cholangitis
GeneSpring software (version 11.5; Agilent) was used to analyze the array database. The chip model could not be identified, so we used “created Technology” in GeneSpring to create a new platform (nanoString GPL19965 platform) and then imported matrix and comment files. We applied “Experiment grouping” to divide the data into “PBC” and “control” groups, respectively, in accordance with the sample information. The principal component analysis was used to control probe quality. “Filter ProbeSets by Expression” was set with intensity values less than 20% in GeneSping for filtering out the quality of the probes. An unpaired t-test was used to identify DEGs with >2.0-fold change in expression, and p < 0.05 was defined as statistically significant. Mev software was used to construct a heat map.
2.3. Gene ontology and pathway enrichment of differentially expressed gene analyses
GO was used to analyze the biological function of the DEGs, including three aspects of biology: biological processes (BP), cellular components (CC), and molecular function (MF) (Gene Ontology Consortium, 2006). The Kyoto Encyclopedia of Genes and Genomes (KEGG) is one of the most commonly used biological information databases. Its main function is to provide information at a molecular level, especially for high-throughput sequencing technology used in improving the function of biological systems (Kanehisa and Goto, 2000). The Database for Annotation, Visualization and Integrated Discovery (DAVID) 6.8 (https://david.ncifcrf.gov) was used to analyze GO terms, KEGG, and Reactome pathways. p < 0.05 was defined as statistically significant.
2.4. Analysis of protein– protein interaction network
We used the Search Tool for the Retrieval of Interacting Genes (STRING, version 10.5) database, an online tool, to evaluate the interactive relationships among DEGs (Szklarczyk et al., 2011, 2015). All of the DEGs in this study were uploaded to STRING, and the threshold value was set with a combined score of >0.4. To construct protein
GenCLiP 2.0 (http://ci.smu.edu.cn/GenCLiP2/analysis.php), the online tool for literature mining (Wang et al., 2014), was used to analyze the hub genes obtained from the PPI network. We used the “Literature Mining Gene Networks” option to construct the co-citation network of hub genes. Subsequently, the related biological function of these hub genes was analyzed by using the “Gene Cluster with Literature Profiles” option with p ≤ 1 × 10⁻¹⁸ and hit ≥18.
2.5. Analysis of marker genes and transcription factors related to primary biliary cholangitis
The comparative toxicogenomics database (CTD) is an online tool for formalizing, harmonizing, and centralizing gene and protein data for different species (Davis et al., 2015). We evaluated whether any hub genes among the DEGs had been confirmed as marker genes of PBC in the CTD database in previous studies. “PBC” was used as the keyword. Then, the plug-in iRegulon in Cytoscape (Janky et al., 2014) was used to calculate transcription factors related to our marker genes. Marker genes and their corresponding transcription factor pairs with Normalized Enrichment Scores (NES) >5 were selected, and the regulatory transcription factor network was the output.
3. Results
3.1. Identification of differentially expressed genes
The GeneSpring analysis of GSE79850 in liver tissue from PBC patients compared with control patients yielded 77 DEGs in total (p < 0.05 and >2.0-fold change in expression). This included 47 upregulated genes and 30 downregulated genes (as shown in Fig. 1).
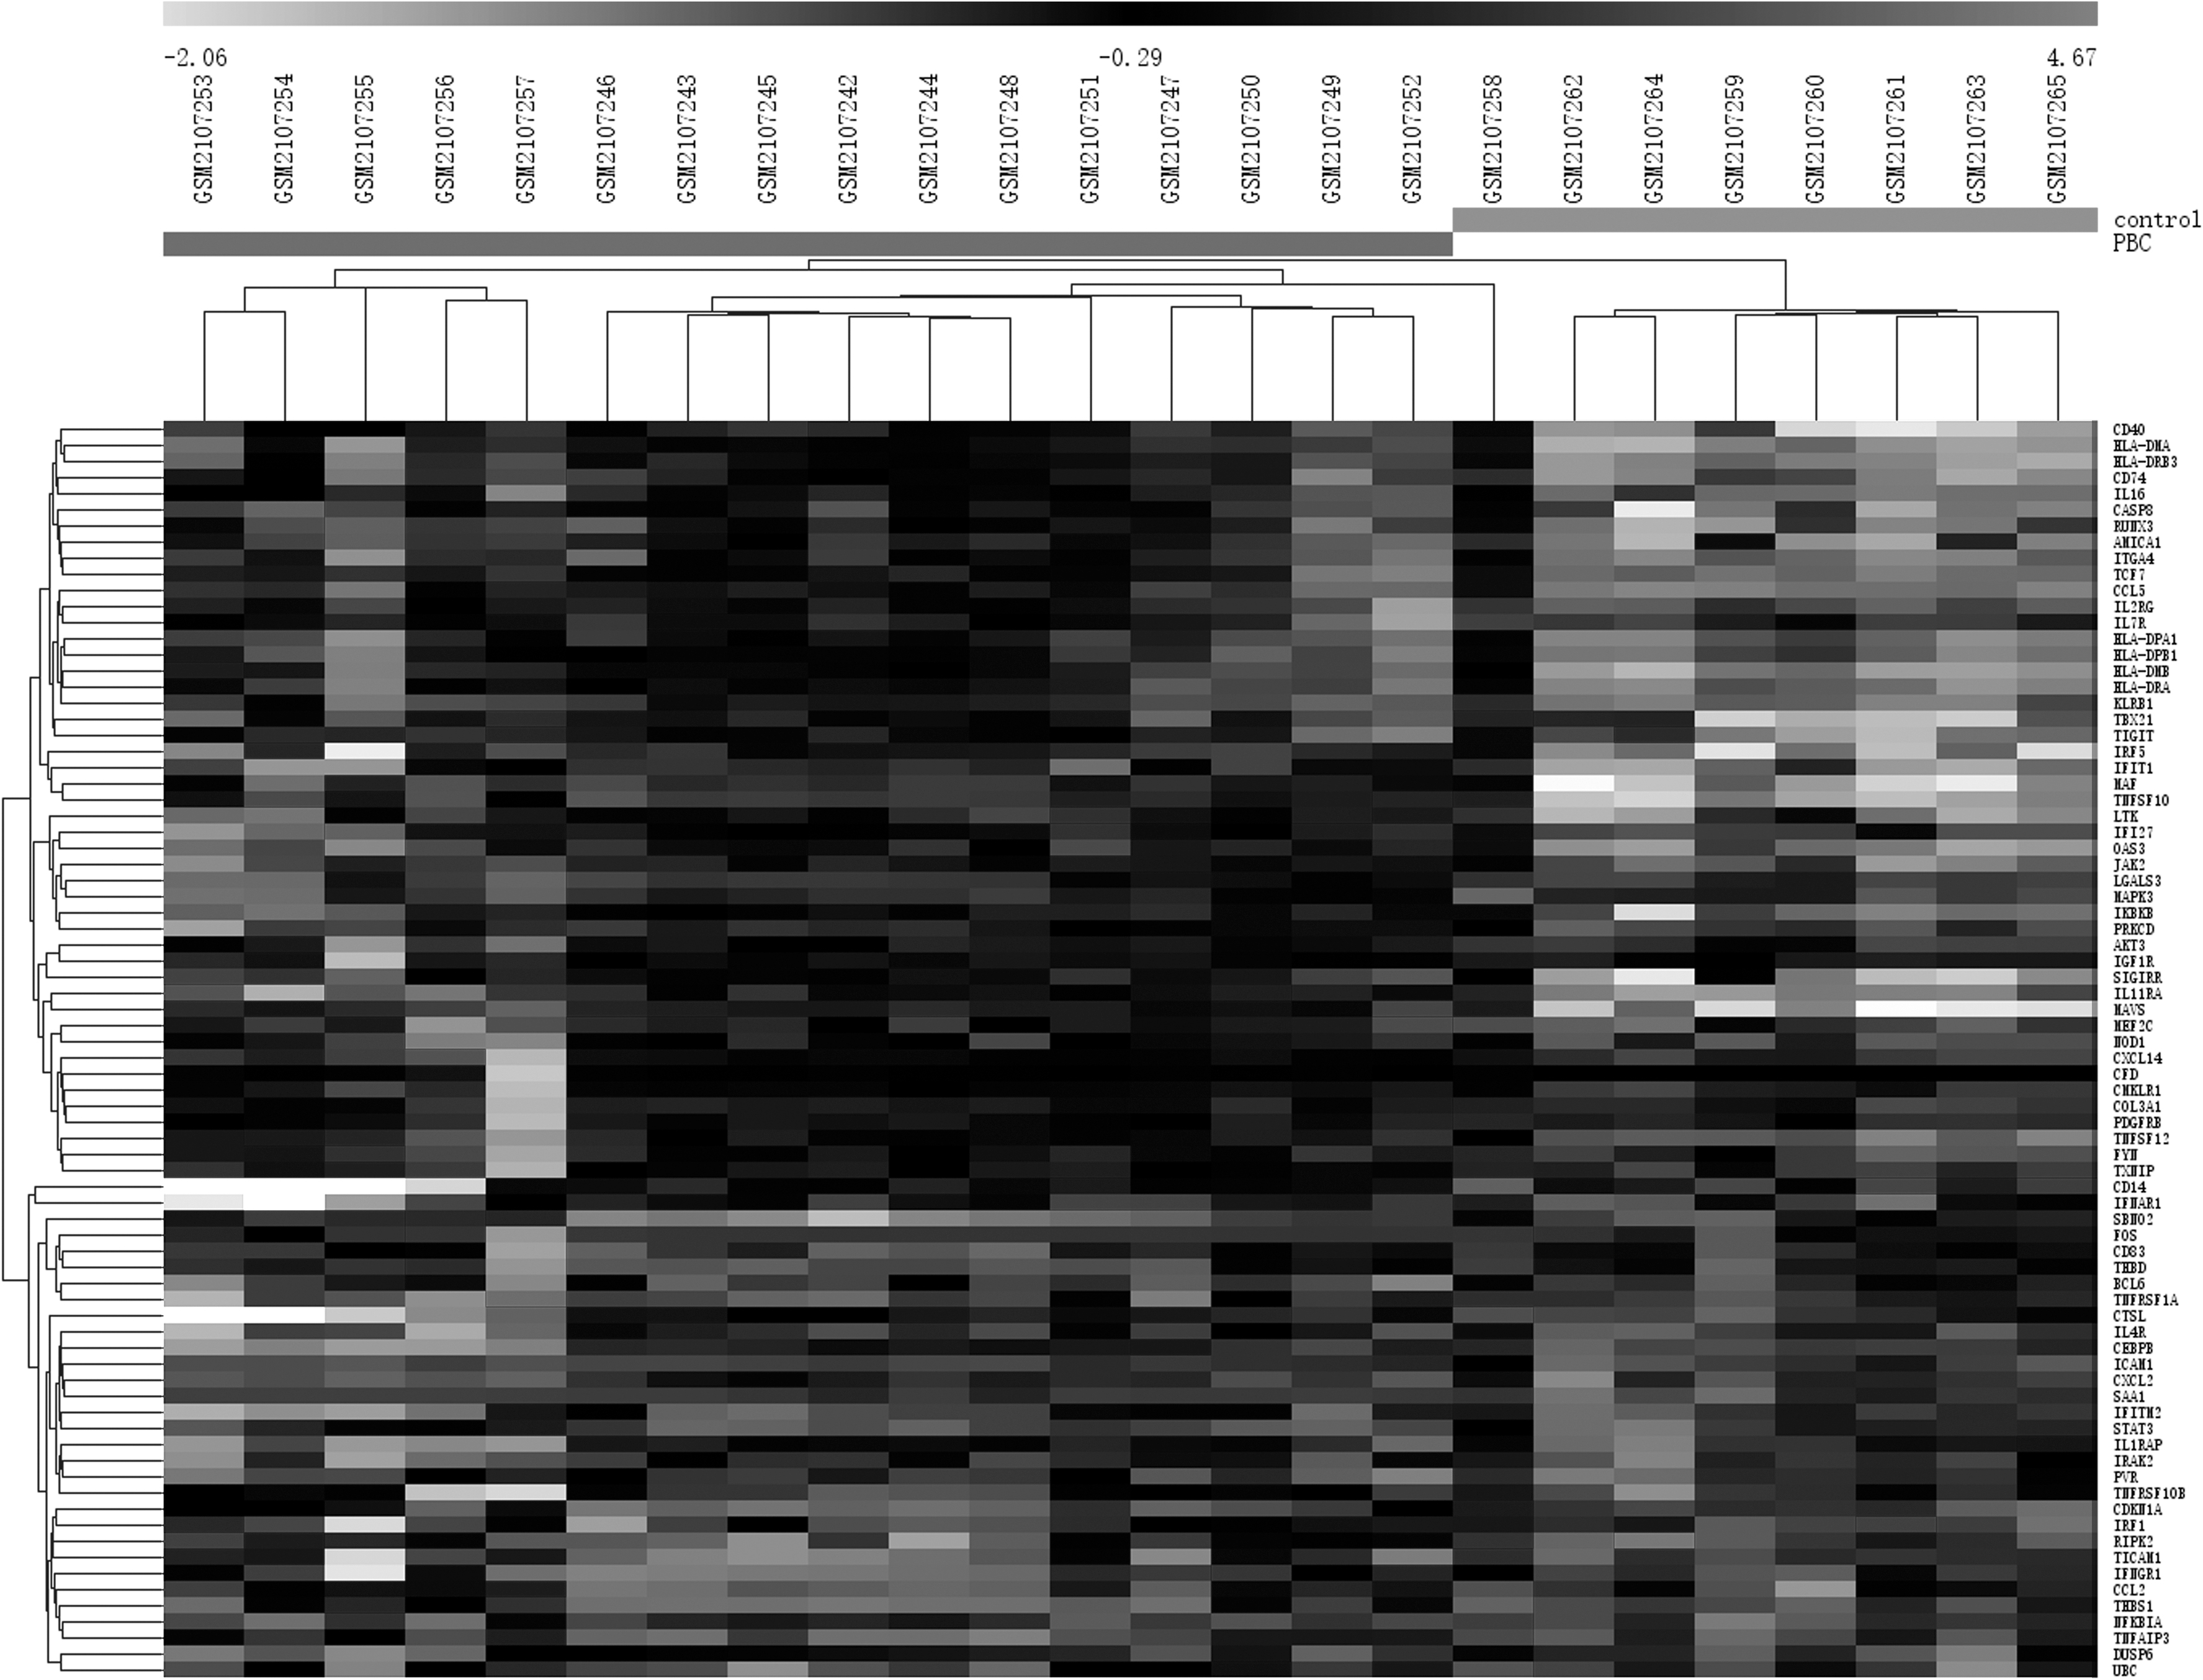
Heat map of differentially expressed genes. Light grey color represents a lower expression level, and dark grey color represents a higher expression level. Black color indicates no differential expression.
3.2. Gene ontology term enrichment analyses
We uploaded upregulated or downregulated DEGs to DAVID to analyze the GO terms, KEGG, and Reactome pathways. The GO analysis results demonstrated that all the DEGs were significantly enriched in BPs. The upregulated DEGs were enriched in genes involved in the immune response, response to cytokines, and cellular responses to cytokine stimuli (Table 1); the downregulated DEGs were enriched in genes involved in the defense response, inflammatory response, and response to cytokines (Table 1). The GO-CC analysis also indicated that the upregulated DEGs were significantly enriched in major histocompatibility complex (MHC) class II protein complex, MHC protein complex, and cell membrane components; downregulated DEGs were enriched in extracellular space, cell surface, and intrinsic components of the plasma membrane (Table 1). In addition, for MF, the upregulated DEGs were enriched in antigen binding, MHC class II receptor activity, and signal transducer activity (Table 1); the downregulated DEGs were enriched in signal transducer activity, macromolecular complex binding, and identical protein binding (Table 1).
Gene Ontology Analysis of Differentially Expressed Genes (p < 0.05)
BP, biological process; CC, cellular component; GO, gene ontology; MF, molecular function; MHC, major histocompatibility complex.
3.3. Pathway analysis
The KEGG pathways of upregulated DEGs were significantly enriched in the type A influenza and herpes simplex infection (A in Table 2); correspondingly, downregulated DEGs were significantly enriched in the tumor necrosis factor (TNF) signaling pathway and the nuclear factor-kappa B (NF-κB) signaling pathway (A in Table 2). In the Reactome pathway of the DEGs, the upregulated genes were significantly enriched in interferon gamma signaling and MHC class II antigen presentation (B in Table 2); whereas the downregulated genes were enriched in TAK1 activates NF-κB by phosphorylation and activation of I-kappa-B-kinase (IKK) complex and the nucleotide-binding oligomerization domain (NOD)1/2 signaling pathway (B in Table 2).
Kyoto Encyclopedia of Genes and Genomes and Reactome Pathway Enrichment Analyses for Differentially Expressed Genes (p < 0.05)
FADD, Fas-associated via death domain; HTLV-I, human T cell leukemia virus-I; IKK, I-kappa-B-kinase; KEGG, Kyoto Encyclopedia of Genes and Genomes; NF-κB, nuclear factor kappa B; MAP, mitogen-activated protein; NOD, nucleotide-binding oligomerization domain; PD-1, programmed death-1; PI3K, phosphoinositide-3-kinase, AKT serine/threonine kinase; RAF, Raf-1 proto-oncogene, serine/threonine kinase; RIP, receptor interacting serine/threonine; TAK1, TGF-beta-activated kinase; TCR, T cell receptor; TLR4, toll-like receptor 4; TRAF6, TNF receptor-associated factor 6; ZAP, zeta chain of T cell receptor-associated protein kinase.
3.4. Protein– protein interaction network analysis
Based on the analysis of the STRING database, data with a PPI score of >0.4 were selected. We obtained 74 nodes and 356 protein pairs (Fig. 2). The top 10 hub genes with higher degrees included intercellular adhesion molecule 1 (degree = 29), signal transducer and activator of transcription 3 (degree = 27), mitogen-activated protein kinase 3 (degree = 26), C-C motif chemokine ligand 2 (degree = 24), Caspase 8 (degree = 24), CD40 Molecule (degree = 23), C-C motif chemokine ligand 5 (CCL5) (degree = 23), Fos proto-oncogene, AP-1 transcription factor subunit (degree = 23), Janus Kinase 2 (degree = 23), and interferon regulatory factor 1 (degree = 22).

Protein
All the selected nodes and edges were analyzed by using the MCODE module. We obtained two clusters with MCODE scores >3. Two significant modules called “cluster 1” and “cluster 2” were selected (Fig. 3). Genes involved in the two clusters were functionally annotated (Fig. 3a). Enrichment analysis demonstrated that the genes in cluster 1 were mostly enriched in the TNF signaling pathway, Influenza A, Chagas disease (American trypanosomiasis), and Toxoplasmosis; whereas the genes in cluster 2 were enriched in herpes simplex virus, antigen processing and presentation, asthma, and graft-versus-host disease.
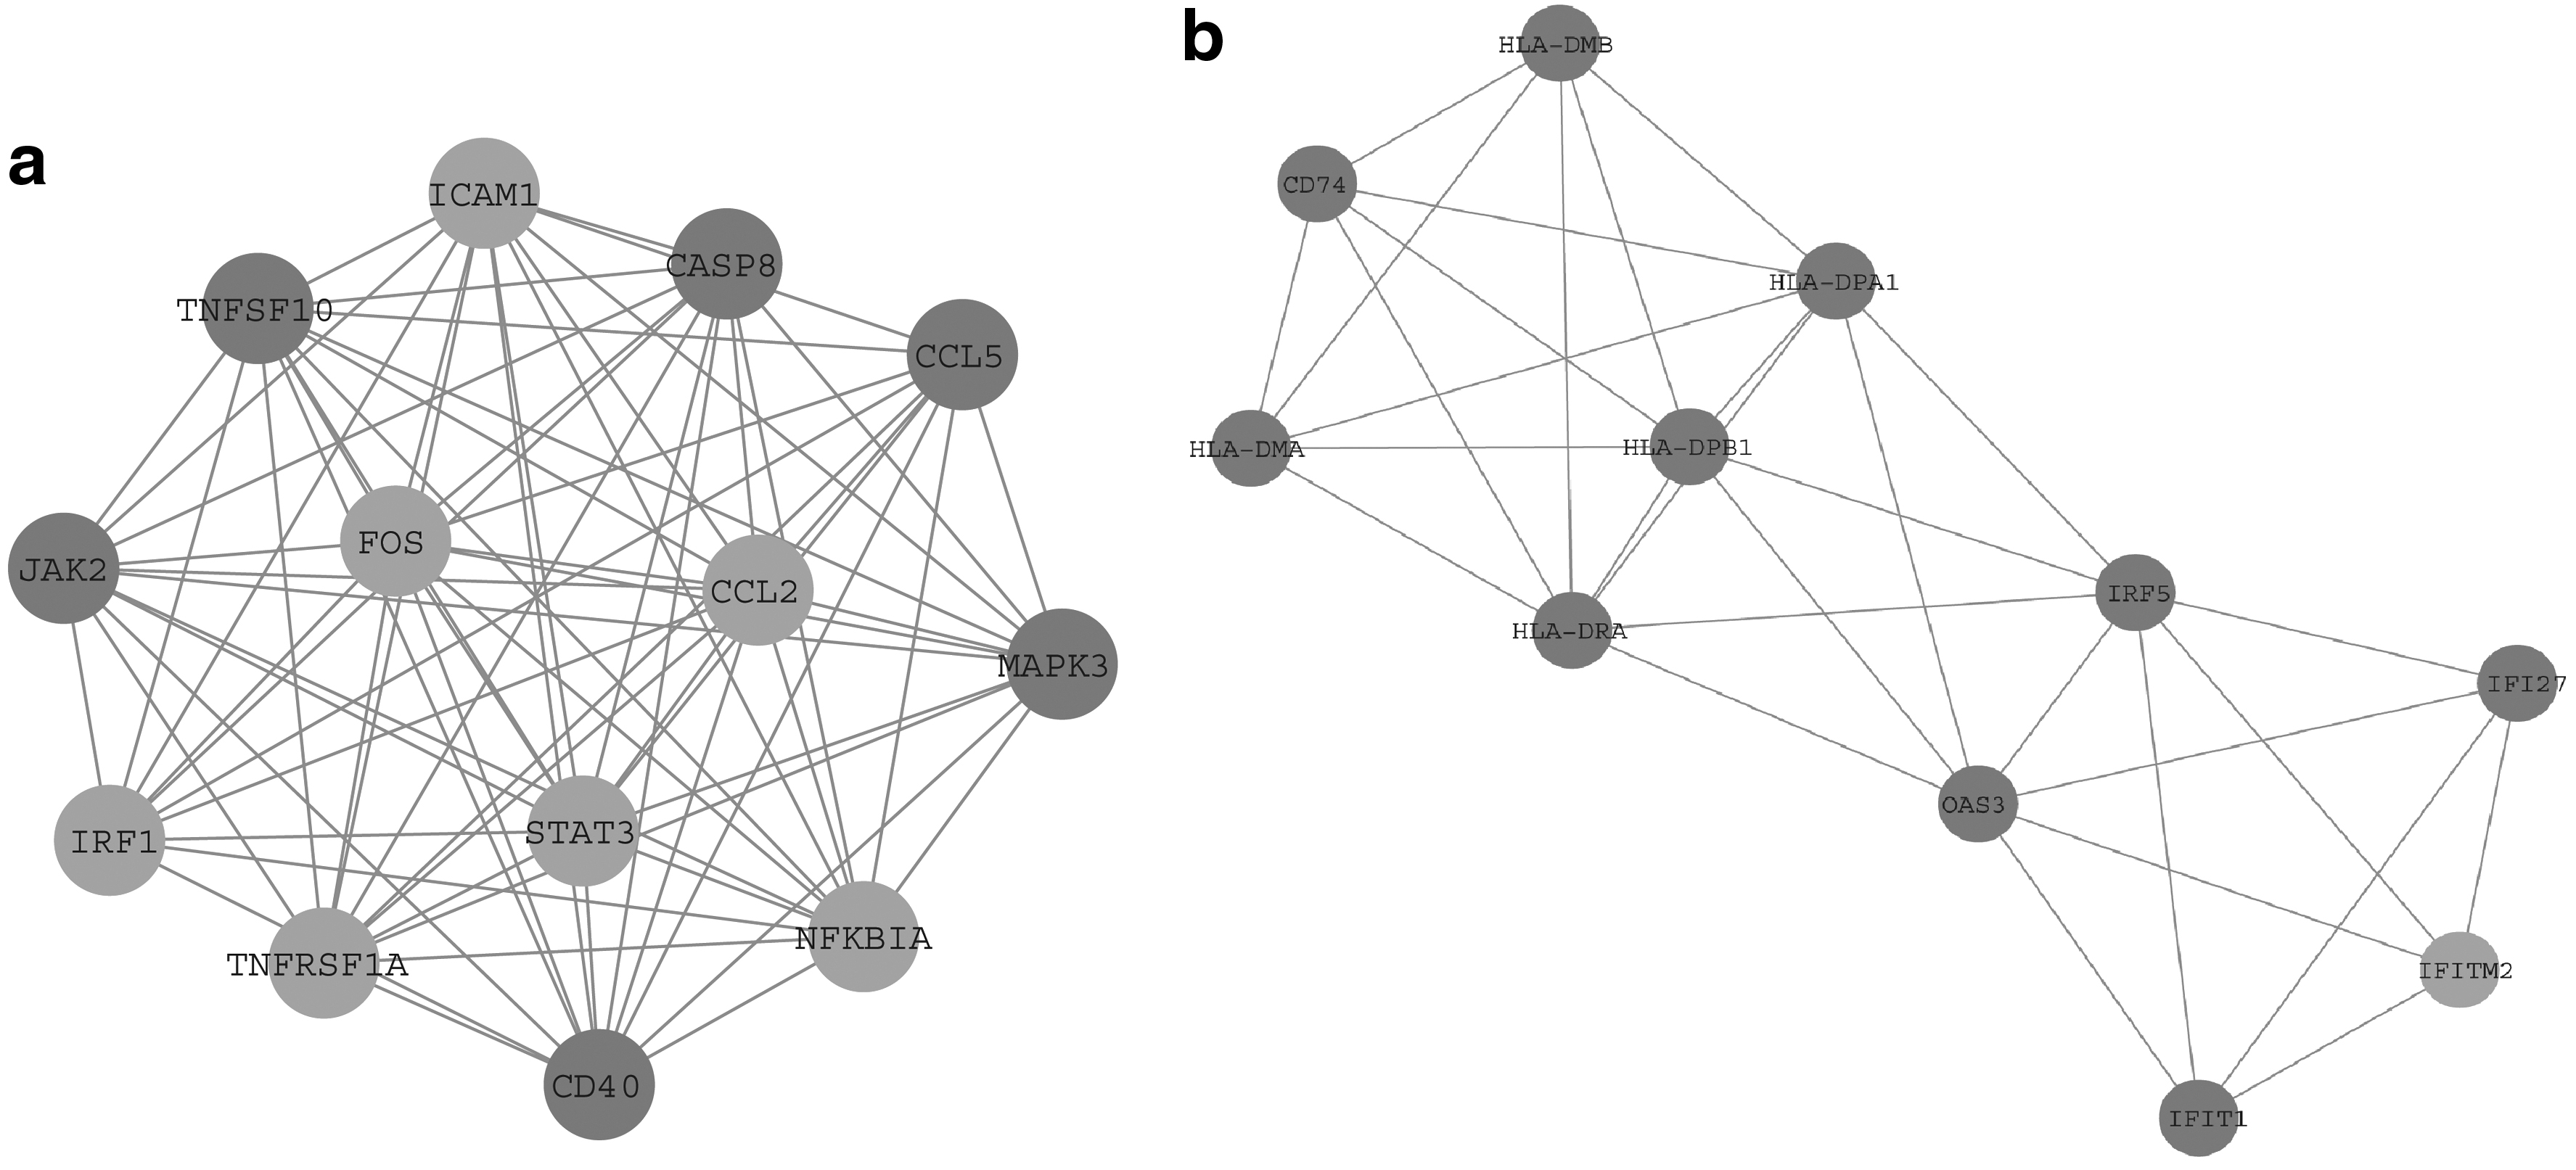
Analysis of 74 nodes and 356 edges by plug-ins MCODE.
Literature mining of 29 genes with a degree >10 in the PPI network was performed. A total of 27 previously reported genes were included to construct the co-citation network (as shown in Fig. 4a) and previous studies regarding the top 10 of these genes are shown in Table 3. The enrichment analysis showed that these 27 genes were enriched in terms of cell activation, the innate immune response, and the immune system (Fig. 4b).

Hub Genes Identified by the Present Study in the Literature
3.5. Marker genes and transcription factors related to primary biliary cholangitis analyses
Three previously reported marker genes associated with PBC that are listed in the CTD, including CCL5, interleukin 7 receptor (IL7R), and TNF receptor superfamily member 1A (TNFRSF1A), were identified among the DEGs in this study. The relative expression levels of these three genes in the liver tissues of PBC and control patients are shown in Figure 5a. The transcription regulatory network of these marker genes is shown in Figure 5b. There are five transcription factors with an NES >5, including interferon regulatory factor 8 (IRF8, NES = 7.701), B Cell CLL/Lymphoma 3 (BCL3, NES = 7.061), TATA-box binding protein (TBP, NES = 6.878), ETS transcription factor (ELK1, NES = 6.625), and Basonuclin 1 (BNC1, NES = 5.744).

4. Discussion
In this study, a total of 77 DEGs (47 upregulated and 33 downregulated genes) were identified in the liver tissues of PBC patients compared with controls within the GSE79850 array dataset. The analysis showed that CCL5 had a high degree of interaction in the PPI network and was a marker gene in PBC. Moreover, upregulated DEGs were significantly enriched in the Reactome pathways of interferon gamma signaling, and in various associated terms of the GO-BP category with more significant p-values. In addition, CCL5 was a specific type of upregulated DEG that was enriched in the immune system processes of the GO-BP category. CCL5 has chemotactic effects on T cells, eosinophils, and basophils, and it plays an active role in the recruitment of leukocytes to inflammatory sites. It has been shown that CCL5 is associated with many autoimmune diseases, such as Sjögren syndrome (Hjelmervik et al., 2005), and rheumatoid arthritis (Shadidi et al., 2003). Nischalke et al. (2004) detected upregulation of CCL5 in liver tissue, whereas Zhang et al. (2014) performed a quantitative real-time (qRT)-PCR analysis of CCL5 expression and confirmed a downregulation of expression in peripheral blood mononuclear cells. In this study, the relative expression of CCL5 was upregulated in the liver tissues of patients with PBC compared with control patients. This inconsistency between peripheral blood and liver tissue possibly indicates that CCL5 chemokines accumulate during the process of inflammation in the liver. It also provides a basis for further study of the immune mechanism of PBC.
Moreover, TNFRSF1A also had a high degree of interaction in the PPI network and was a marker gene associated with PBC in this study. It plays a part in cell survival, apoptosis, and inflammatory processes. It also plays a role in autoimmune diseases, and mutations in the TNFRSF1A gene may be associated with multiple sclerosis (Kulakova et al., 2016). Single-nucleotide polymorphism of TNFRSF1A (rs1800693) is associated with PBC (Mells et al., 2011; Dong et al., 2015) in both the United Kingdom and Chinese populations. In this study, TNFRSF1A is involved in the TNF signaling pathway, in which downregulated genes were significantly enriched in the KEGG pathways. This gene encodes one of two receptors for TNFα, and compared with wild-type mice, the degree of liver fibrosis after administering a potent hepatotoxin was attenuated in c−/− mice (Kitamura et al., 2002). Therefore, TNFRSF1A may be a key gene associated with PBC.
IL7R was identified as another PBC marker gene in this study. IL7R (rs860413) has been confirmed as a candidate gene by the U.K. PBC Consortium (Mells et al., 2011). The rs6890853 single-nucleotide polymorphism located in the IL7R gene showed significant associations with PBC in the Japanese population (Nakamura et al., 2012). However, no association was observed for IL7R (rs6897932) in a Han Chinese PBC cohort (Dong et al., 2015). IL7R mutation is a type of heterogeneous genetic disorder that causes Omenn syndrome, characterized by reduced T cell mutations, immune disorders, and autoimmune and graft-versus-host disease (Liston et al., 2008). Therefore, IL7R is another key gene associated with PBC and a molecular mechanism analysis is a starting point to study the pathogenesis of PBC.
In addition, the first four pathways of upregulated DEGs identified in this study were significantly enriched in viral and parasitic infection pathways in the KEGG pathways. A molecular simulation mechanism was demonstrated, which is associated with a pathogen-triggered autoimmune reaction mechanism. The mechanism shows that the pathogen epitope (i.e., peptides, carbohydrates or DNA sequences) shares a homology with the pathogen itself to varying degrees, and in response to pathogens and their hosts results in a mixed antibody- and cell-mediated immune response (Van de Water et al., 2001). To date, specific microbes that have been reported as potentially related to PBC have been mainly bacteria, but they also include viruses, parasites, and fungi (Selmi et al., 2010). Therefore, in this study, the upregulated DEGs may indicate that those genes associated with PBC were cross-reactive with microbial infection.
CCL5, IL7R, and TNFRSF1A were all enriched in the term “immune response” in the GO-BP category in this study. Therefore, we speculate that these three genes may be involved in PBC by way of the immune response pathway. The main immunological topics focus on the loss of immune tolerance, resulting in T cell-mediated injury, an imbalance in the regulation of immune cells, and defects in the immune response to foreign antigens. Subsequently, minimal fibrosis, bile duct injury, and portal vein inflammation are caused. Therefore, to better understand the pathogenesis of PBC, it is necessary to study the key genes and pathways just mentioned.
In conclusion, the CCL5, IL7R, and TNFRSF1A genes; the immune response pathway; as well as molecular mimicry may have crucial roles in PBC. These genes and pathways may be potential new targets for treating PBC. However, further mechanistic studies of these genes and pathways are required.
Footnotes
Acknowledgment
The authors would like to acknowledge Dr. Zhenyu Yin for his critical reading and editing.
Author Disclosure Statement
The authors declare they have no competing financial interests.