
Abstract
This study focused on identifying bladder cancer (BC)-associated genes, transcription factors (TFs), and microRNAs (miRNAs). Two microarray data sets GSE37815 and GSE40355 were utilized to screen common differentially expressed genes (DEGs) associated with BC. Then, functional enrichment analysis was performed for elucidating the involved functions of DEGs. Subsequently, the protein–protein interaction (PPI) network and submodule of PPI network were analyzed. Finally, the regulation relationships of TF–DEGs and miRNA–DEGs were obtained to construct miRNA–target–TF regulatory network. DEGs were identified across BC and normal bladder tissues samples. Functional enrichment analysis results showed that most upregulated DEGs were closely associated with the Gene Ontology function of “mitotic spindle assembly checkpoint” and pathway of “Cell cycle,” whereas most downregulated DEGs were significantly associated with “Complement and coagulation cascades” pathway (e.g., A2M and F13A1) and “Ras signaling pathway” (e.g., GNG11). DEGs such as F13A1 and A2M were highlighted in the PPI network and Submodule 1. In addition, three centromere-associated CENPK, CENPF, and CENPO were enriched in Submodule 2. Moreover, miR-519d had high degree in the regulatory network and CENPO was predicted to be one target of miR-519d. The upregulated CENPK, CENPF, and CENPO, and downregulated A2M, F13A1, and GNG11 might contribute to the progression of BC. In addition, the downregulated miR-519d might lead to the development of BC by upregulating the expression of CENPO. However, future investigation of those findings should be needed.
1. Introduction
Bladder cancer (BC) is a common malignancy of the urinary system, with 70% of BCs diagnosed as superficial tumor without life threat, but 30% diagnosed as muscle-invasive type with a high risk of death (Kaufman et al., 2009). The main symptoms for patients with BC are visible hematuria, pain, urgency, and frequent urination (Jensen et al., 2013). It is estimated that there are ∼805,000 new cases diagnosed as BC and 329,000 cases died from BC in 2015 in China, and the ratio of incidence and mortality rates for male and female are both about 3.3:1 (Chen et al., 2016). So far, the cure rate for invasive BC is only 50% (Raghavan and Sandler, 2015); therefore, a comprehensive investigation of the underlying molecular mechanisms of BC is urgently required, which may improve the current approaches for BC diagnosis and treatment.
BC is closely associated with genetic and epigenetic alterations, in which chromosomal aberrations, aberrant genes, and microRNAs (miRNAs) expression are common types (Volanis et al., 2010). Zhang et al. (2017) have revealed that the upregulated AEG-1 may increase Ark activity and Bcl-2 expression to promote BC cells proliferation and migration. Overexpression of Derlin-1 contributes to chemoresistance and invasion through ERK/MMP and PI3K/AKT/Bcl-2 signaling pathways in BC (Dong et al., 2017). In addition, miRNAs play critical roles in BC development and progression through regulating cell cycle/apoptosis-related genes (Enokida et al., 2016). Moreover, the downregulated miR-613 may promote BC cells proliferation by regulating SphK1 (Yu et al., 2017). miR-493 as a tumor suppressor may decrease cell motility and migration in BC cells by downregulating RhoC and FZD4 (Ueno et al. 2012). Although the mentioned studies have reported that several aberrant genes and miRNAs expression are responsible for BC progression, the molecular mechanisms of BC have not yet been fully elucidated.
In recent years, high-throughput sequencing and bioinformatics analysis approaches provide a novel direction for overall exploring the underlying molecular mechanisms of BC. Kim et al. (2013) have used microarray analysis to investigate DNA methylation and gene expression patterns in BC samples, whereas Hurdubetiu and Coatu (2013) have used microarray analysis to conduct integrative analysis of miRNA and mRNA expression in BC samples. However, in both studies, the data of differentially expressed genes (DEGs) were not intensively studied (Hurdubetiu and Coatu, 2013). In this study, two microarray data sets GSE37815 (Kim et al., 2013) and GSE40355 (Hurdubetiu and Coatu, 2013) were utilized to screen common DEGs associated with BC. Then, functional enrichment analysis was performed for elucidating the involved functions of DEGs. Subsequently, the protein–protein interaction (PPI) network and submodule of PPI network were analyzed. Finally, the regulation relationships of transcription factor (TF)–DEGs and miRNA–DEGs were obtained to construct miRNA–target–TF regulatory network. This article aimed at focusing on BC-associated DEGs, and functions analysis and upstream regulator prediction of those DEGs, which may provide potential markers for BC diagnosis and treatment.
2. Methods
2.1. Gene expression data
Two data sets GSE37815 and GSE40355 associated with BC were downloaded from GEO (Gene Expression Omnibus, www.ncbi.nlm.nih.gov/geo) (Barrett et al., 2005). The GSE37815 contained 24 samples, which comprised 18 nonmuscle-invasive BCs and 6 normal bladder tissue samples. The gene expression levels were detected on platform of GPL6102 Illumina human-6 v2.0 expression beadchip. In addition, another 24 samples (18 bladder urothelial carcinoma and 6 normal bladder tissue samples) available from GSE40355 data set were chosen, the samples of which were processed on the platform of GPL13497 Agilent-026652 Whole Human Genome Microarray 4x44K v2.
2.2. Data preprocessing and differentially expressed genes screening
At first, gene expression matrixes of GSE3781 and GSE40355 in txt format were obtained. Next the data in both data sets were divided into BC group and normal bladder group, and the linear models for microarray data software (LIMMA, version 3.22.7, http://bioconductor.org/packages/3.0/bioc/html/limma.html) was used to preprocess the original data (Smyth, 2005), which included background correction and normalization. Subsequently, the annotation files from Illumina and Agilent platforms were utilized for probes annotation. When different probes were mapped into a same gene symbol, the mean value of probes was acted as final expression value of this gene.
Following data preprocessing, DEGs analysis between two groups for each data set was conducted by Empirical Bayes method in LIMMA software. Then, p-value <0.05 and |log2 fold change (FC)| ≥ 1 were used as thresholds for identifying DEGs, and the overlapped DEGs from aforementioned data sets were identified for subsequent analyses.
2.3. Functional enrichment analysis
Database for annotation, visualization, and integrated discovery (DAVID, version 6.8, https://david-d.ncifcrf.gov) is an open database for extracting biological features related to large gene lists and grouping the biological features into different categories (Huang et al., 2008). In this study, Kyoto Encyclopedia of Genes and Genomes (KEGG) pathway (Kanehisa and Goto, 2000) and Gene Ontology (GO) (Ashburner et al., 2000) functional analyses for the mentioned upregulated and downregulated DEGs were performed using DAVID tool, respectively. p < 0.05 and count ≥2 were set as cutoff criterion for identifying significant pathways and GO terms.
2.4. Construction of protein–protein interaction network
The search tool for the retrieval of interacting genes (STRING, version 10.5 http://string-db.org) database can offer an integrated information for the known and predicted interactions between proteins (Szklarczyk et al., 2015). The PPI pairs between proteins encoded by DEGs were obtained using STRING with PPI score >0.9. Then, the cytoscape software (version 3.5.1, www.cytoscape.org) was used to construct PPI network (Shannon et al., 2003). Subsequently, the CytoNCA plugin (version 2.1.6, http://apps.cytoscape.org/apps/cytonca) was used to analyze nodes topological properties in PPI network (Tang et al., 2015) and the nodes were ranked by their degree, betweenness, and closeness values, respectively. The common nodes in top 30 high-degree, betweenness, and closeness values were considered as hub nodes.
2.5. Submodule mining of protein–protein interaction network
As is known, one gene exerts its function through collaborative interaction with others. Proteins in one module that have same or similar functions may collectively play their regulative roles in a biological process. Thus, submodule analysis is a useful method for revealing proteins with similar functions. In this study, MCODE plugin (version 1.4.2, http://apps.cytoscape.org/apps/mcode) in cytoscape software was used to search significant clustering modules with a threshold value of >5 (Bandettini et al., 2012).
2.6. Construction of miRNA–target–transcription factor regulatory network
Web-based gene set enrichment analysis toolkit (WebGestalt) is a powerful tool for upstream regulators prediction of genes (Zhang et al., 2005). In our study, TFs and miRNAs that regulated DEGs were predicted using WebGestalt, and the regulation relationships of TF–target and miRNA–target were obtained. The parameters were set as “Minimum Number of Genes for a Category–5,” “Number of Permutations–top10,” “Maximum Number of Genes for a Category–2000,” and “Number of Categories with Leading-Edge Genes–1000.” Finally, the TF–target and miRNA–target pairs were integrated, and miRNA–TF–target network was constructed by Cytoscape software.
3. Results
3.1. Differentially expressed genes screening
In GSE37815 data set, there was a set of 48,701 probes, of which 24,614 genes were annotated. Based on the threshold p-value <0.05 and |log2 FC| ≥ 1, a group of 2023 DEGs across BC tissue and normal bladder tissue samples was selected, including 631 upregulated genes and 1392 downregulated genes. In addition, there were 34,183 probes in GSE40355 data set, and 21,754 genes were obtained through annotation. With the cutoff criterion, a total of 1899 DEGs that comprised 625 upregulated DEGs and 1274 downregulated DEGs between BC tissue and normal bladder tissue samples were identified. In both data sets, the number of downregulated DEGs was twofold higher than the number of upregulated DEGs. Notably, a total of 86 upregulated DEGs and 406 downregulated DEGs were overlapped in both data sets.
3.2. Functional enrichment analysis
Through using DAVID tool, upregulated DEGs were enriched in 29 GO terms, whereas downregulated DEGs were associated with 161 GO terms. Notably, the upregulated DEGs were closely associated with the GO functions of “mitotic spindle assembly checkpoint” (BUB1 and BUB1B) and “chromosome, telomeric region” (e.g., BLM and CHEK2) (Table 1), whereas the downregulated DEGs were significantly related to “positive regulation of cell proliferation” and “extracellular space” (Table 2). In addition, the upregulated DEGs were enriched in 5 KEGG pathways, whereas the downregulated DEGs were related to 39 KEGG pathways. Most of the upregulated DEGs were significantly associated with pathways such as “Cell cycle” (e.g., CCNB1, BUB1, TTK, and BUB1B) and “p53 signaling pathway,” whereas most downregualted DEGs were mainly related to pathways such as “PI3K-Akt signaling pathway,” “Complement and coagulation cascades (e.g., A2M and F13A1),” and “Ras signaling pathway” (e.g., GNG11, GNG12, and RGL1) (Table 3).
The Top Five Gene Ontology Enrichment Term (Biological Process, Molecular Function, and Cellular Component) for Upregulated Genes
GO, Gene Ontology.
The Top Five Gene Ontology Enrichment Terms (Biological Process, Molecular Function, and Cellular Component) for Downregulated Genes
The Top 10 Kyoto Encyclopedia of Genes and Genomes Enrichment Results for Upregulated and Downregulated Genes
3.3. Analysis of protein–protein interaction network
A PPI network was constructed to explore the interaction relationship between the proteins edited by corresponding DEGs. Totally, the PPI network comprised 182 nodes (37 upregulated and 145 downregulated) and 309 PPI pairs (Fig. 1). The top 30 nodes ranked by their degree, betweenness, and closeness values were obtained, respectively. As a result, there were 14 overlapped DEGs (e.g., CCNB1, F13A1 and A2M) with high degree, betweenness and closeness (Table 4).
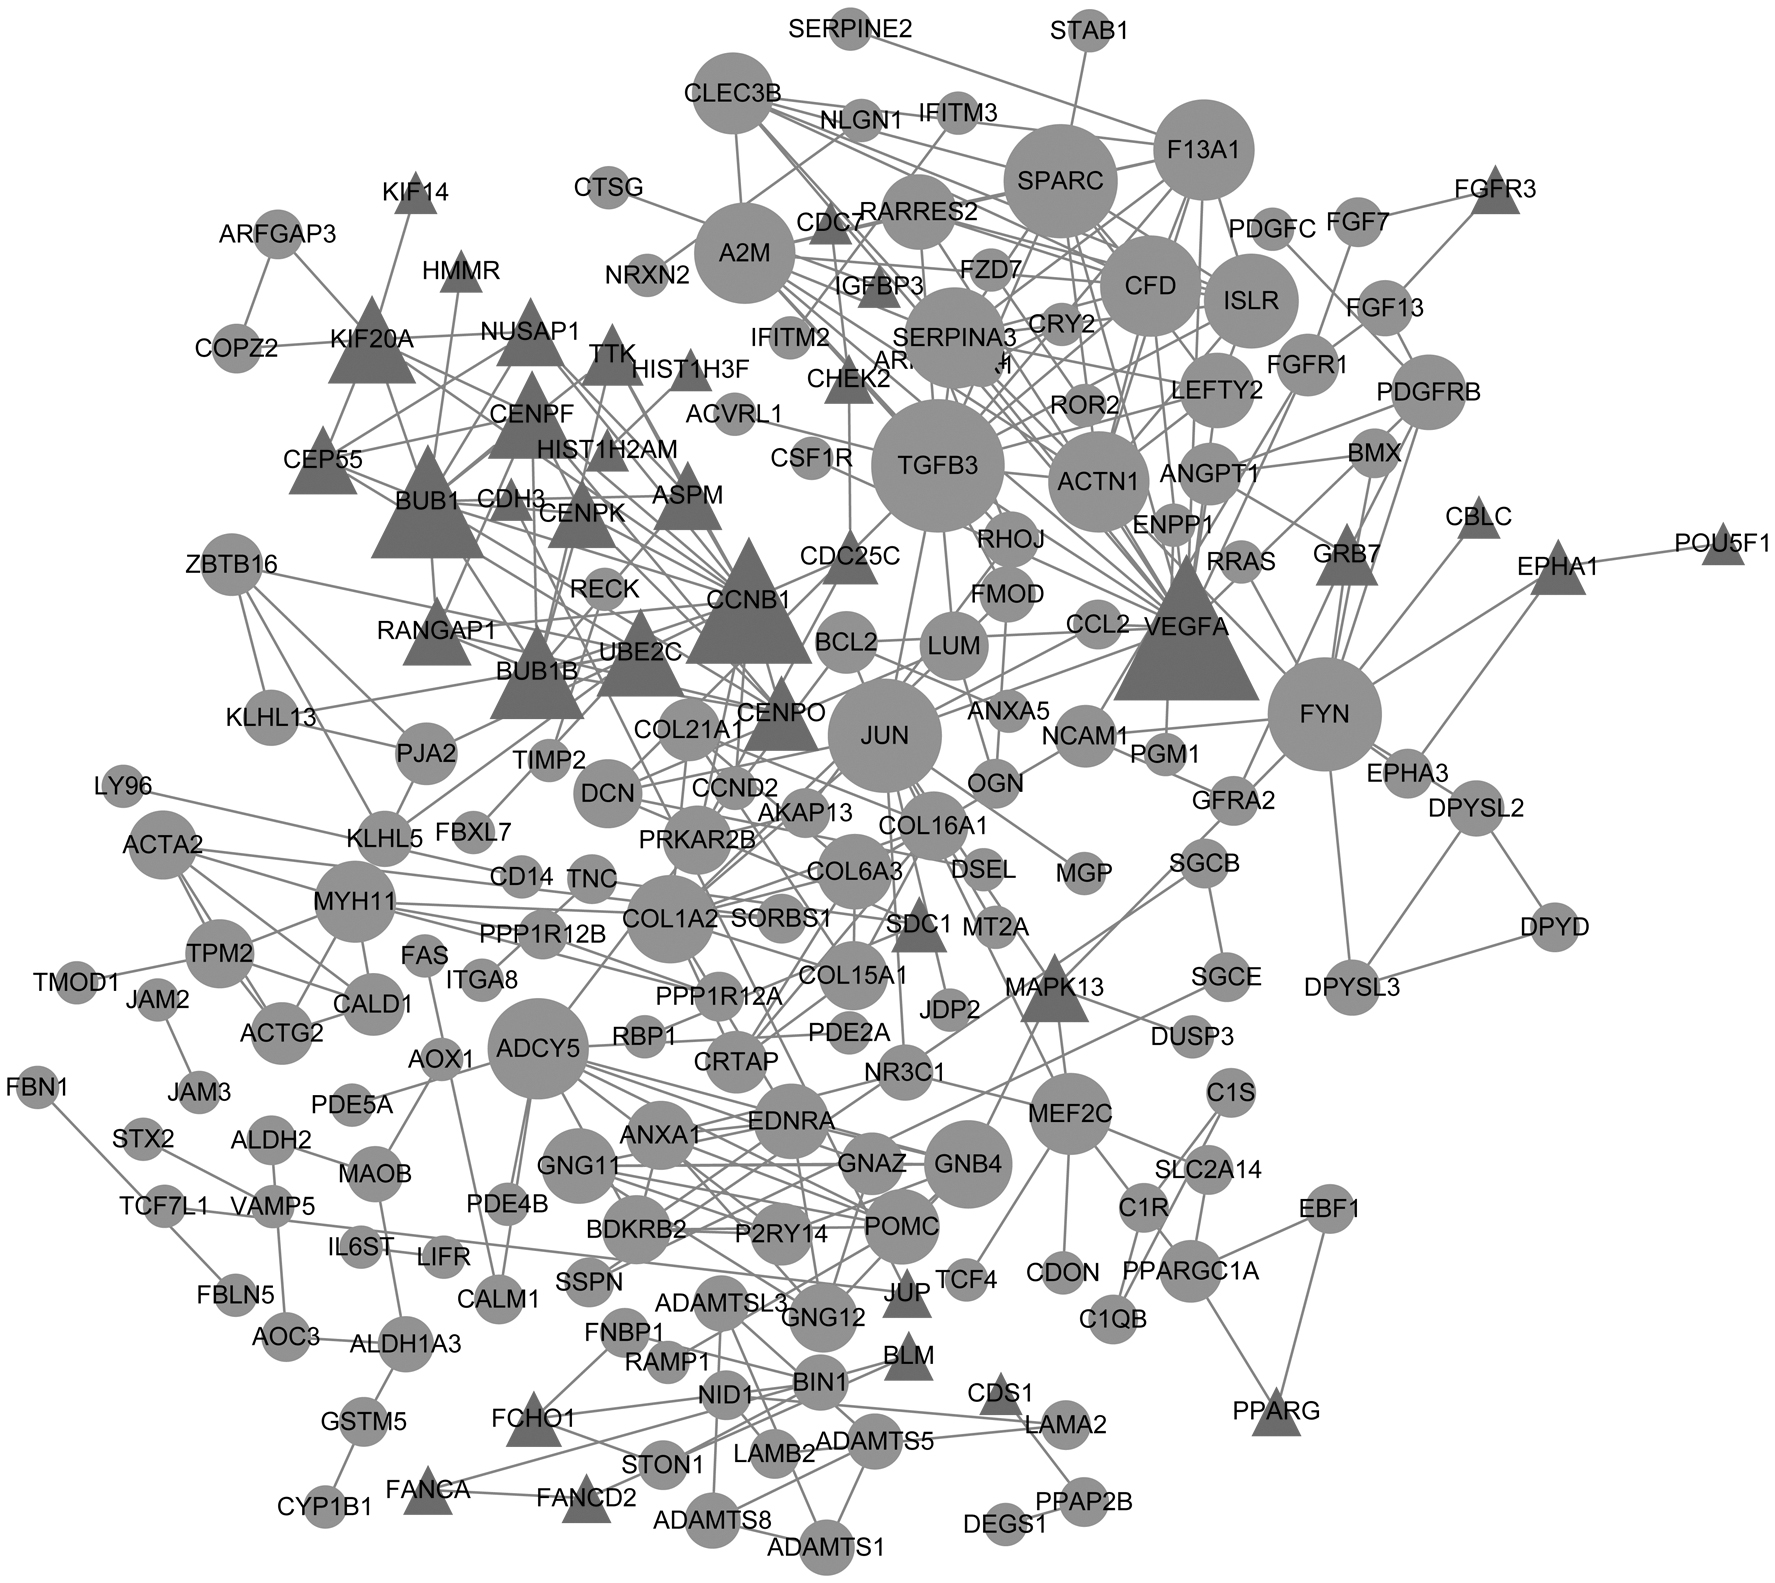
Protein–protein interaction network of DEGs. Triangles represent the upregulated genes and circles represent the downregulated genes. The node size represents connectivity degree, and degree of a node corresponds to the number of interactions by the protein. DEGs, differentially expressed genes.
The Overlapped Genes Obtained from Top 30 Nodes in Protein–Protein Interaction Network Listed by Degree, Betweenness, and Closeness, Respectively
3.4. Submodule mining of protein–protein interaction network
With the predefined criterion, three submodules were obtained. In module 1, there were 10 nodes and 41 interaction pairs, and most of them were downregulated DEGs (e.g., A2M and F13A1). Among module 2, it contained 9 nodes and 27 interaction pairs, in which most of them were associated with “Cell cycle” (e.g., CCNB1, BUB1, TTK, and BUB1B) and centromere-associated genes CENPK, CENPF, and CENPO. In addition, module 3 comprised 6 nodes and 14 interaction pairs, and most of them belonged to collagen type 1 family such as COL1A2 and COL21A1 (Fig. 2).
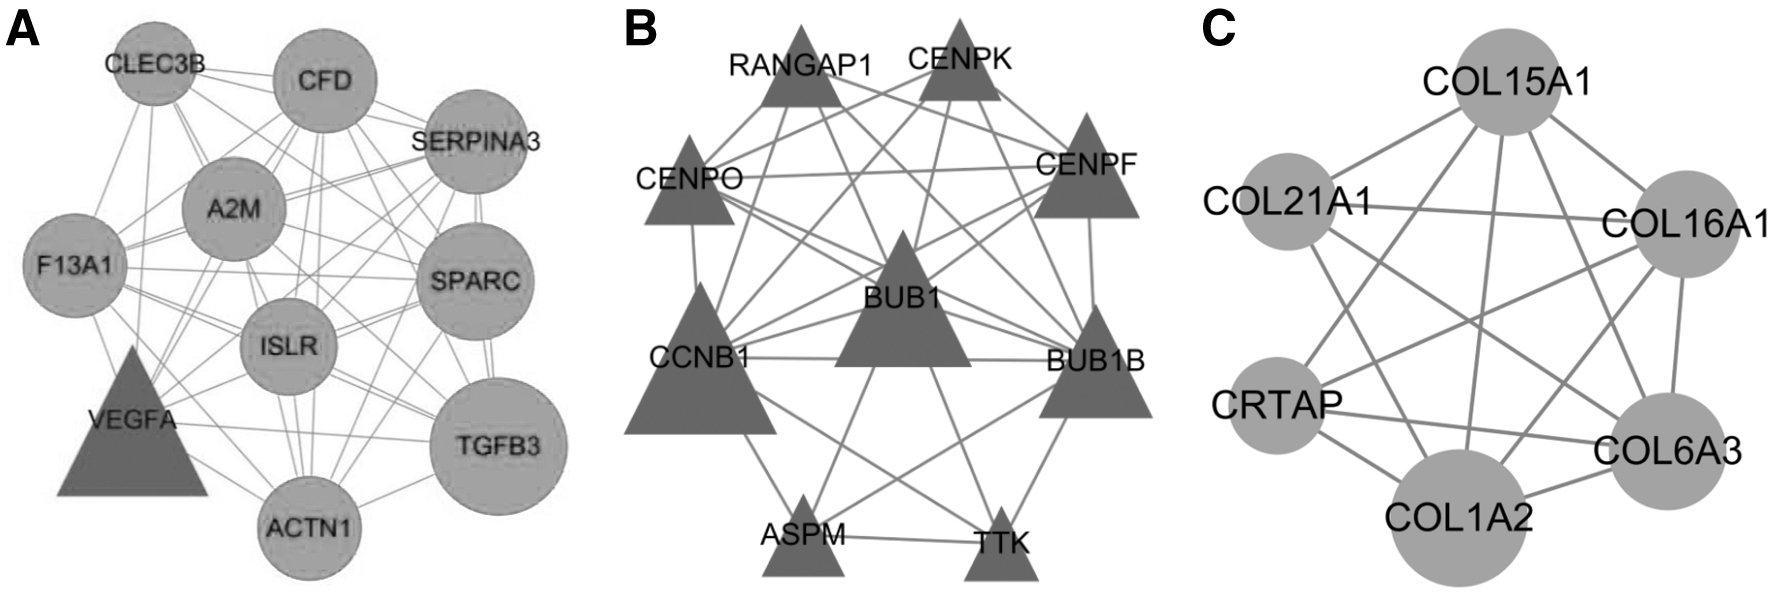
Submodule analysis of PPI network. Triangles represent the upregulated genes and circles represent the downregulated genes. The node size represents connectivity degree, and degree of a node corresponds to the number of interactions by the protein. PPI, protein–protein interaction.
3.5. Integrated network analysis
With preset conditions, a total of 23 miRNAs and 8 TF-targeted DEGs were obtained by use of the WebGestalt tool. After integrating the mentioned nodes and regulation relationships, the TF–miRNA–target network contained 263 nodes and 849 regulation relationships (including 494 miRNAs–DEGs and 355 miRNAs–DEGs) (Fig. 3), in which the TFs such as NFAT_Q4 and AP4, and miRNAs such as miR-519d and miR-20b were the top 10 nodes with high degree (Table 5).
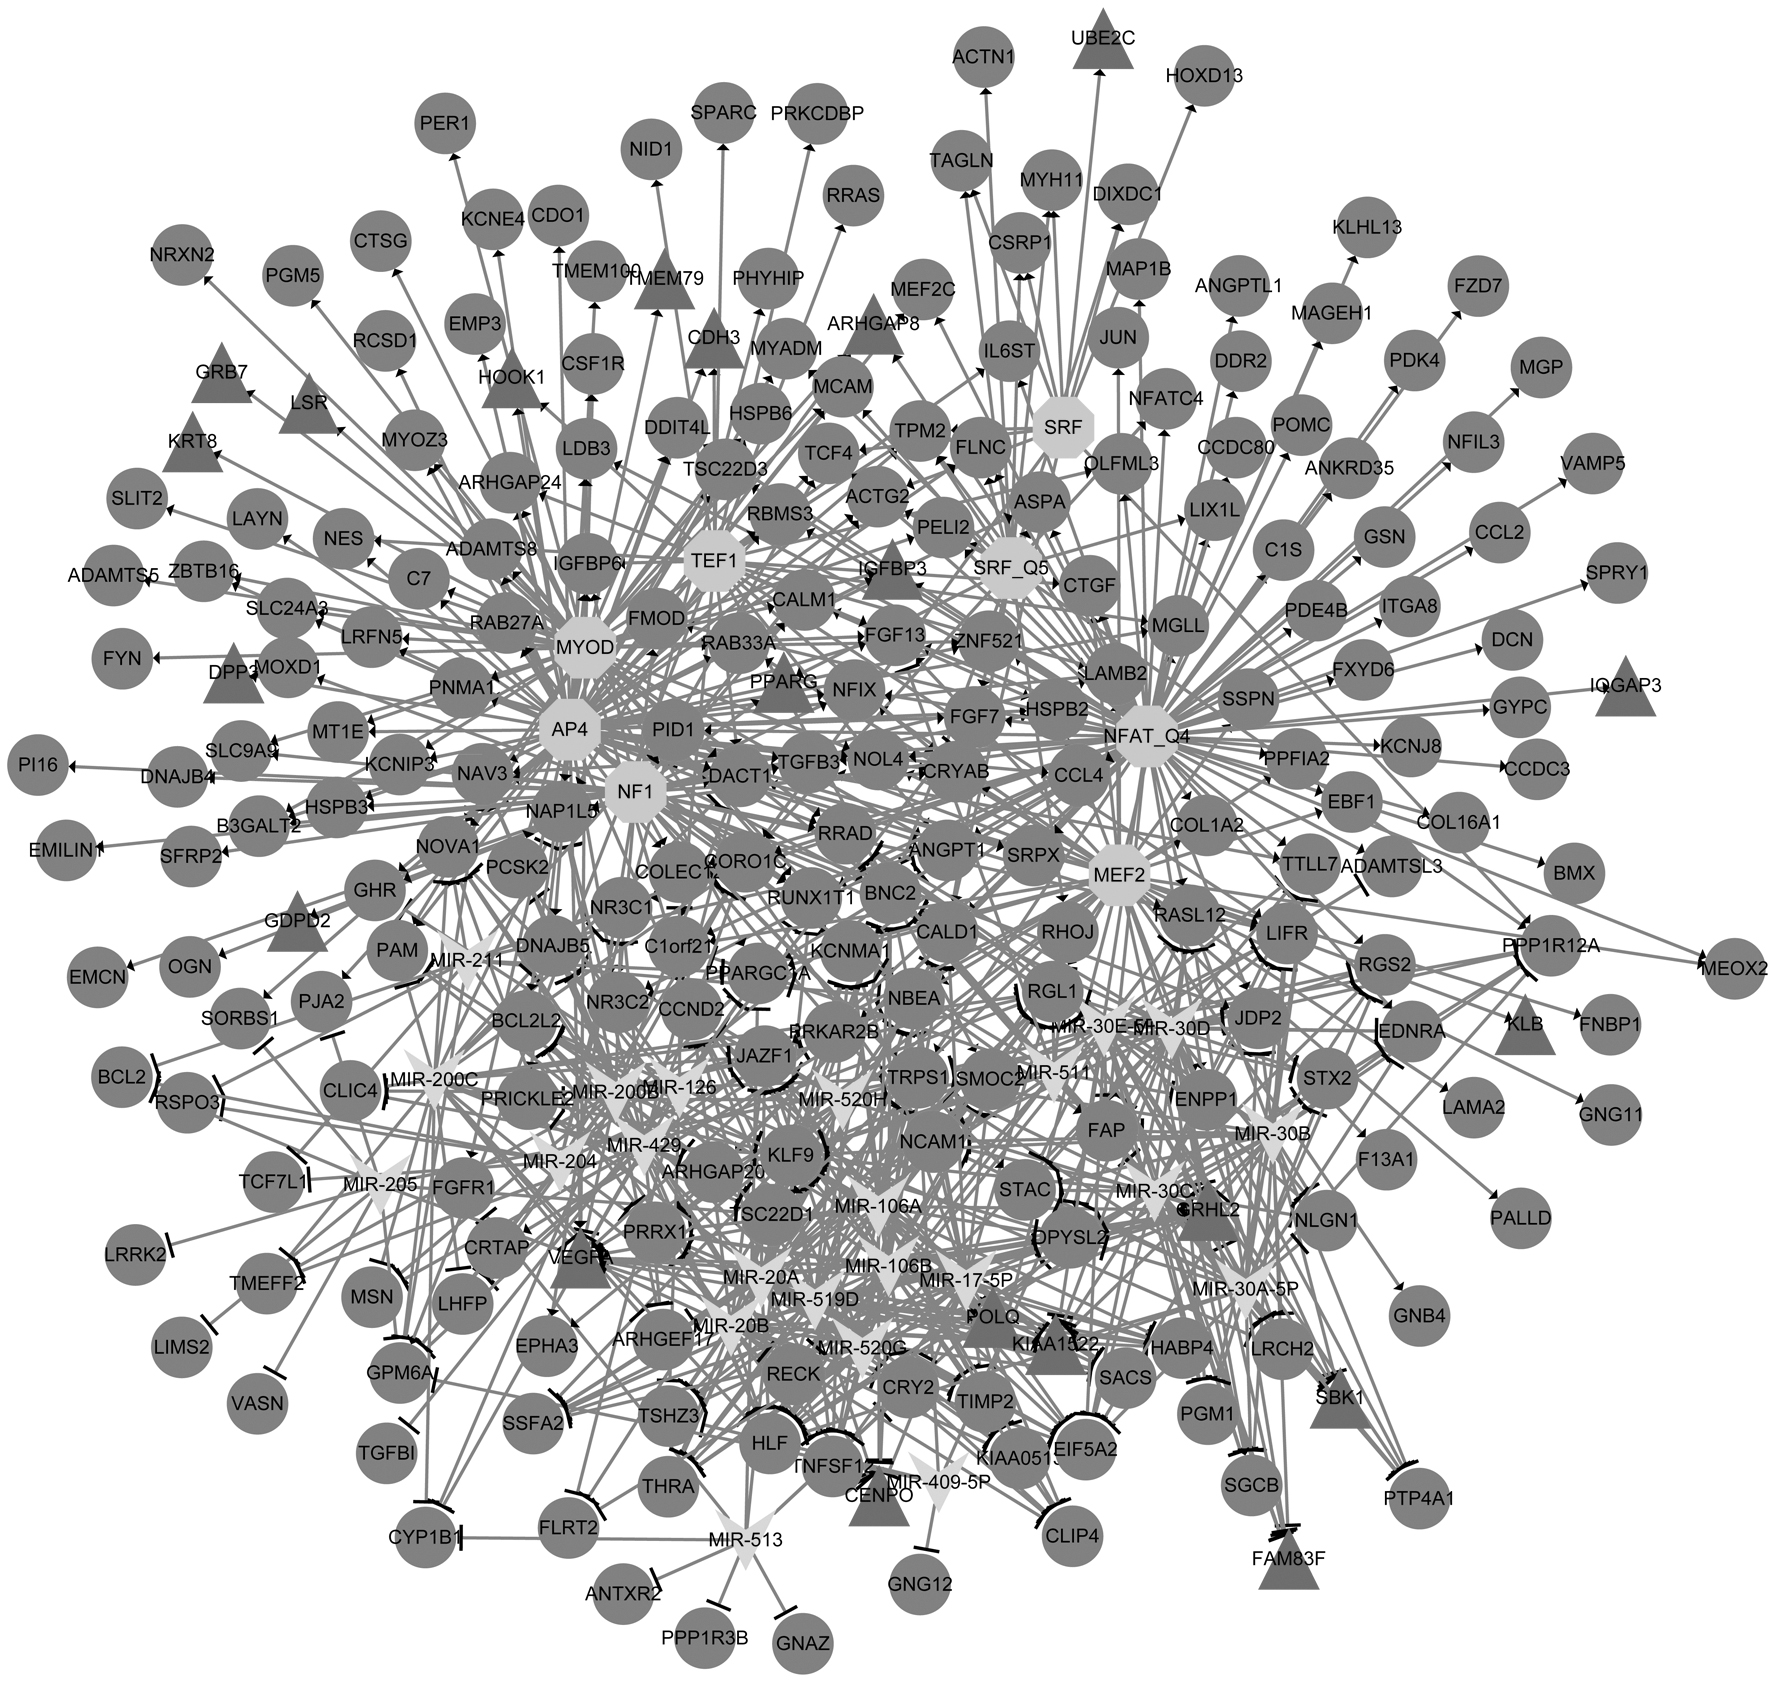
miRNA–TF–target regulatory networks. Triangles represent the upregulated genes, whereas circles represent the downregulated genes. The inverted triangles represent miRNAs, octagons represent TFs. Arrows represent the direction of regulation. miRNA, microRNA; TFs, transcription factors.
The Top 10 Nodes in miRNA–Target–TF Regulatory Network Listed by Their Degrees
miRNA, microRNA; TF, transcription factor.
4. Discussion
In this study, a group of 86 common upregulated DEGs and 406 common downregulated DEGs identified from GSE37815 and GSE40355 data set across BC and normal bladder tissues samples was acquired. Functional enrichment analysis results showed that most upregulated DEGs were closely associated with the GO function of “mitotic spindle assembly checkpoint” and pathway of “Cell cycle,” whereas most downregulated DEGs were significantly associated with “Complement and coagulation cascades” pathway (e.g., A2M and F13A1) and “Ras signaling pathway” (e.g., GNG11). DEGs such as F13A1 and A2M were highlighted in the PPI network and submodule 1. In submodule 2, three centromere-associated CENPK, CENPF, and CENPO were obtained. In addition, miR-519d had high degree in the regulatory network and CENPO was predicted to be one target of miR-519d.
Through submodule analysis of PPI network, nine upregulated DEGs (e.g., CCNB1, BUB1, BUB1B, TTK, ASPM, CENPO, RANGAP1, CENPK, and CENPF) associated with cell cycle and mitotic spindle assembly were predicted to interact with each other in module 2. Especially, three centromere-associated DEGs CENPK, CENPF, and CENPO were also obtained, and they all encode the components of centromere-kinetochore complex. Reportedly, CENPK plays a crucial role on the correct kinetochore function and mitotic progression, whereas CENPO can prevent premature separation after spindle damage (Verdaasdonk and Bloom, 2011). In addition, CENPF is related to chromosome segregation during mitosis (Dai et al., 2013). In recent years, numerous studies have reported that the members of centromere protein family are closely related to the development of different types of cancer (Lee et al., 2015; Zhuo et al., 2015; Sheng et al., 2017). Lee et al. (2015) have found that CENPK is upregulated in ovarian cancer tissue and associated with poor prognosis of ovarian cancer. Zhuo et al. (2015) have indicated that the overexpressed CENPF is correlated with the progression and poor prognosis of prostate cancer. However, the influence of CENPK, CENPF, and CENPO on the development of BC has not been described. Therefore, we supposed that the upregulated CENPK, CENPF, and CENPO might contribute to the progression of BC by regulating cell cycle and mitotic spindle assembly of BC cells.
In miRNA–target–TF network, miR-519d was highlighted and predicted to be involved in the tumorigenesis of BC through regulating downstream targets. It has been reported that the downregulated miR-519d facilitates cell proliferation of ovarian cancer (Pang et al., 2014). Similarly, Dai et al. (2014) have demonstrated that miR-519d as a tumor suppressor, its downregulated expression may promote to cell growth of BC cell 5637. Notably, we predicted CENPO was one target of miR-519d. We supposed that the downregulated miR-519d might lead to the development of BC by upregulating the expression of CENPO. However, little mechanism of miR-519d that functions on CENPO has been reported, and future investigation of miR-519d on the centromere function is needed.
In addition, the downregulated genes were significantly enriched in complement and coagulation cascades signaling pathway. What is more, two hub genes A2M and F13A1 in PPI network were predicted to involve in complement and coagulation cascades signaling pathway. A2M (alpha-2-macroglobulin), as protease inhibitor and cytokine transporter, can inhibit a broad spectrum of extracellular proteases such as trypsin, thrombin, and collagenase (Galliano et al., 2006). Mengdi et al. have pointed that the expression of A2M in ovarian tumor sensitivity tissue and platinum-resistant tumor tissue is both low (Mengdi et al., 2015).
Moreover, the A2M levels in prostate cancer with bone metastases are remarkably downregulated than in nonbone metastases (Kanoh et al., 2001). F13A1 encodes a subunit of coagulation factor XIII, which is activated in blood coagulation cascade and responsible for fibrin stabilization (Zhang et al., 2015). Reportedly, differentially expressed F13A1 is found in the liver, bone, and lymph node metastases of prostate cancer tissue (Morrissey et al., 2008). Interestingly, it has been suggested that F13A1, as a responsive gene, is downregulated expression in ESRRB-transfected prostate cancer cells (Yuan et al., 2015). Another study has indicated that ESRRB is significantly expressed in BC cell lines and BC tissue (Amini et al., 2014). Collectively, we speculated that the altered expression of A2M and F13A1 might be associated with the progression of BC through regulating complement and coagulation cascades signaling pathway.
It is well known that Ras signaling pathway is essential for cell proliferation and migration, whose dysregulation may lead to the development of cancers (Drosten et al., 2010). In this study, we predicted that most downregulated DEGs were significantly associated with Ras signaling pathway, in which GNG11 is implicated in Ras signaling pathway. GNG11 (G protein subunit gamma 11) belongs to subunit family of heteromeric G-protein, which play a crucial role on GTPase activity by replacing GDP by GTP. The GTPase-activating protein can bind Ras proteins to regulate Ras-induced signaling pathway (Schaber et al., 1989). Previous studies have described that GNG11 has functions of induction cellular senescence in human fibroblasts and suppression cell growth of SUSM-1 cells (Hossain et al., 2006; Takauji et al., 2017). In addition, GNG11 is identified as DEGs between triple-negative breast cancer subtypes (Lehmann et al., 2011), and acts as tumor suppressor in lung cancer (Hsu et al., 2017). Therefore, we supposed that the downregulated GNG11 might contribute to the onset of BC by regulating Ras signaling pathway.
5. Conclusion
In this study, we suggested that the centromere-associated DEGs such as CENPK, CENPF, and CENPO, and DEGs such as A2M and F13A1 involved in complement and coagulation cascades signaling pathway might contribute to the progression of BC. Moreover, CENPO was a target of miR-519d. Furthermore, the downregulated GNG11 might be implicated in the onset of BC by regulating Ras signaling pathway. However, future investigation of those supposes is needed.
Footnotes
Author Disclosure Statement
The authors declare they have no competing financial interests.
Funding Information
This study was supported by Sichuan Science and Technology (Grant No. 2018JY0156) and Youth Fund of Sichuan Academy of Agricultural Sciences (Grant No. 2018QNJJ-21).