
Abstract
The literature and the Internet provide different sources, in which medical community as well as patients can browse through medical algorithms. These algorithms are dispersed and use different formats of presentation. We present visualized diagnosis (ViDis), a web platform aimed to construction and sharing of graphical representations of medical algorithms in a single place and in a unified format. ViDis is accessible as a web application, which can run on an arbitrary platform with a modern web browser. The platform's user friendly interfaces allow the users with different backgrounds to construct, share, and browse through medical algorithms. Visualization of the algorithms can be created using a flowchart diagram notation that is commonly applied in the design of computer software and is very intuitive to use and understand. Algorithms can be viewed in two different formats, that is, in the format of flowchart diagrams or in the format of sequential steps that guide the user from the beginning to the end of a medical procedure in dependence on his or her decisions made in each step of the process. ViDis enables registered users to create, edit, and share visualized medical algorithms and guest users to view these visualizations. To the best of our knowledge, this is the first platform for efficient sharing of medical algorithms with the community. We believe that ViDis provides an excellent platform for sharing medical knowledge and information among diagnosticians, clinicians, researchers, and patients.
1. Introduction
Visualization increases the interpretability of the data and is vital in biology and medicine (Kaufman et al., 2014). Diagnostic and other medical algorithms aid clinical decision-making and can be used to explain or understand complex processes that are followed in diagnostics, treatment, and prevention of diseases. The literature and the Internet provide various sources, in which interested users can find and browse through the visualizations of such algorithms. These algorithms are, however, dispersed and use different formats of presentation. Different platforms for sharing medical algorithms have already been reported.
The web site of American Academy of Family Physicians provides an extensive list of medical algorithms (American Academy of Family Physicians, 2019). This list links the user to the specific scientific articles, in which the selected algorithm was reported and described. The web site, however, does not offer a unified format of representation of these algorithms. Moreover, the user still needs to search through the scientific articles, which are not always available under open access policy.
The Medical Algorithm Project (Johnson et al., 2002) and its current web site (The Medical Algorithms Company, 2019) provide different medical algorithms in textual descriptions as well as implementations of selected medical algorithms as web calculators. These have already progressed to a commercial product. Medical calculators are easy to use but hide the logic behind the decision process that yields the final diagnosis and/or result. Available platforms do not offer medical algorithms in a unified visual format, which would make the medical decisions much more informative and understandable.
Web-based visualization of algorithms in general, which can also be applied to medical algorithms, is supported by the tool draw.io (JGraph Ltd., 2019). This is, however, a general-purpose tool, which is only focused on the visualization of static algorithms and does not provide the functionalities for the dissemination of knowledge with the medical community. Moreover, the tool does not provide functionalities, such as annotations and curation of algorithms and assigning metadata to medical algorithms, which would serve beneficial in the process of their creation and sharing.
Existent tools in general do not allow the users to contribute their own algorithms. Moreover, all algorithms are presented in a form that is suitable for experts, that is, clinicians, diagnosticians, or researchers, and are not intended for the use by patients.
We introduce visual diagnosis (ViDis) tool that provides a web-based platform for straightforward construction and sharing of diagnostic as well as other medical algorithms. ViDis was designed to support its users with the process of sharing the medical knowledge with the medical and scientific community, as well as with the patients. The tool is inspired by different platforms for sharing computational models of biological systems, such as BioModels (Li et al., 2010; Chelliah et al., 2015) and BiGG models (Schellenberger et al., 2010; King et al., 2016). In these platforms, a user can browse through different models with the application of different filters. Moreover, users can contribute their own models. BioModels database also allows the models to be labeled as curated, which means that they have been validated by a verified expert.
Similarly, ViDis presents a publicly available platform for sharing knowledge in the fields of medical diagnostics, treatment, and prevention of diseases. Since it provides an easy-to-use graphical interface, its potential users range from diagnosticians, clinicians, and researchers to patients. ViDis allows its users to visualize medical algorithms using simplified flowchart diagram notation that is commonly applied in the design of computer software and is very intuitive to use and understand. The same algorithms can be alternatively visualized in a sequential format, which leads the user from the initial step to the final diagnosis or decision. This format is more suitable for less complex algorithms and for patients' use. Users can create and contribute algorithm visualizations and share them with other registered users using the platform's interface that provides all the required functionalities for construction and dissemination. Users can as well create medical algorithms only for personal use, which means that these will be visible only to their creators. Specific types of users, that is, curators, present a group of users who can mark different algorithms as curated. Anyone can contribute medical algorithms, but the users may select to display only curated algorithms, that is, those that were validated by authorized experts. Curators can also update and correct different public algorithms to keep them updated with the progress in the field. All modifications are documented within the database behind the platform.
2. Methods
ViDis is based completely on open-source multiplatform web development tools and packages. The implementation of the visualization segment is based on an open-source JavaScript library Raphael.js (Baranovskiy, 2019). Application follows standard model, view, and controller (MVC) architecture that presents a modern pattern of user interfaces. Structure of elements is defined by hyper text markup language (HTML) and design, for example, placement of elements, colors, and fonts is built using cascading style sheets (CSS) in combination with Bootstrap. Font Awesome CSS library is used to display some of the icons next to a text.
On the client side, JavaScript, along with Asynchronous JavaScript and XML (AJAX) and the jQuery library, takes care of user interactions, for example, dragging an element from toolbar to canvas, loading and displaying dynamic content. Notify.js JavaScript library is used to display pop up messages to the user when an operation is executed successfully or unsuccessfully, that is, loading or saving an algorithm. Elements that are used for the creation of algorithms and the canvas itself are drawn in scalable vector graphics format, which allows users to see smooth images even if the picture is zoomed in. On the server side, we used Personal Home Page (PHP) tools to do all the programming, such as serving specific pages only to the logged users and so on. Before saving an algorithm to MySQL database, it is converted to JavaScript object notation (JSON) format on the frontend part of the application and then transmitted to the backend part. JSON is a file format for transmitting files and has a structure consisting of attribute–value pairs. Most of the computation is, however, performed on the server side. ViDis thus works on an arbitrary hardware platform, such as personal computer, tablet, or smart mobile phone, with a modern web browser.
3. Results
3.1. Construction of visualizations
The construction of visualized algorithms is performed in the simplified flowchart diagram notation. This notation presumes two types on nodes, that is, processes, which represent certain actions that need to be performed, and decisions, which represent conditional operations that are stated in the form of yes or no questions (Fig. 1).

Simplified flowchart diagram notation used in ViDis.
The user can construct the visualized algorithms in a drag-and-drop manner. A user selects different building blocks from the control panel, which he or she can put on the drawing canvas. Visualizations can be constructed hierarchically, which means the user selects the parts of the flowchart diagram he or she wants to display at the time. This allows the user to make even more complex algorithms clear and understanding.
The user can assign different metadata to the constructed algorithm, such as the name of the disease related with the constructed algorithm. A very important parameter is, as well, the intended use of the algorithm. If the algorithm is intended for the use by patients as well as experts, the user can indicate this here. In this case, the algorithm will be displayed among the patients' algorithms section and it will be possible to display it in a sequential form. After the creation of a publicly available visualization, its author may issue a curation query. This query will inform the curators that the new algorithm that needs a curation has been created.
3.2. Display of visualized algorithms
Users can browse through the publicly available algorithms in the database using combinations of different filters on the algorithms' metadata. These include name of the disease, focus of the algorithm (i.e., diagnostic, treatment, and other, such as, e.g., relapse prevention), and curation of the algorithm. After the user has selected an algorithm, this can be displayed in two different formats. The flowchart diagram format uses the same display as used in the creation process, however, without the possibilities of any modifications (Fig. 2A). The sequential format displays the algorithm in the form of sequential steps that lead the user from the beginning to the end of the selected process. In each decisive step, the user needs to answer a yes or no question, which allows him or her to progress through the algorithm (Fig. 2B). We believe that this form is more suitable for patients, since they guide them throughout the whole medical procedure. This form, however, does not illustrate the whole medical procedure, that is, alternate decisions are omitted from the visualization. It is also less suitable for the visualization of more complex medical algorithms.
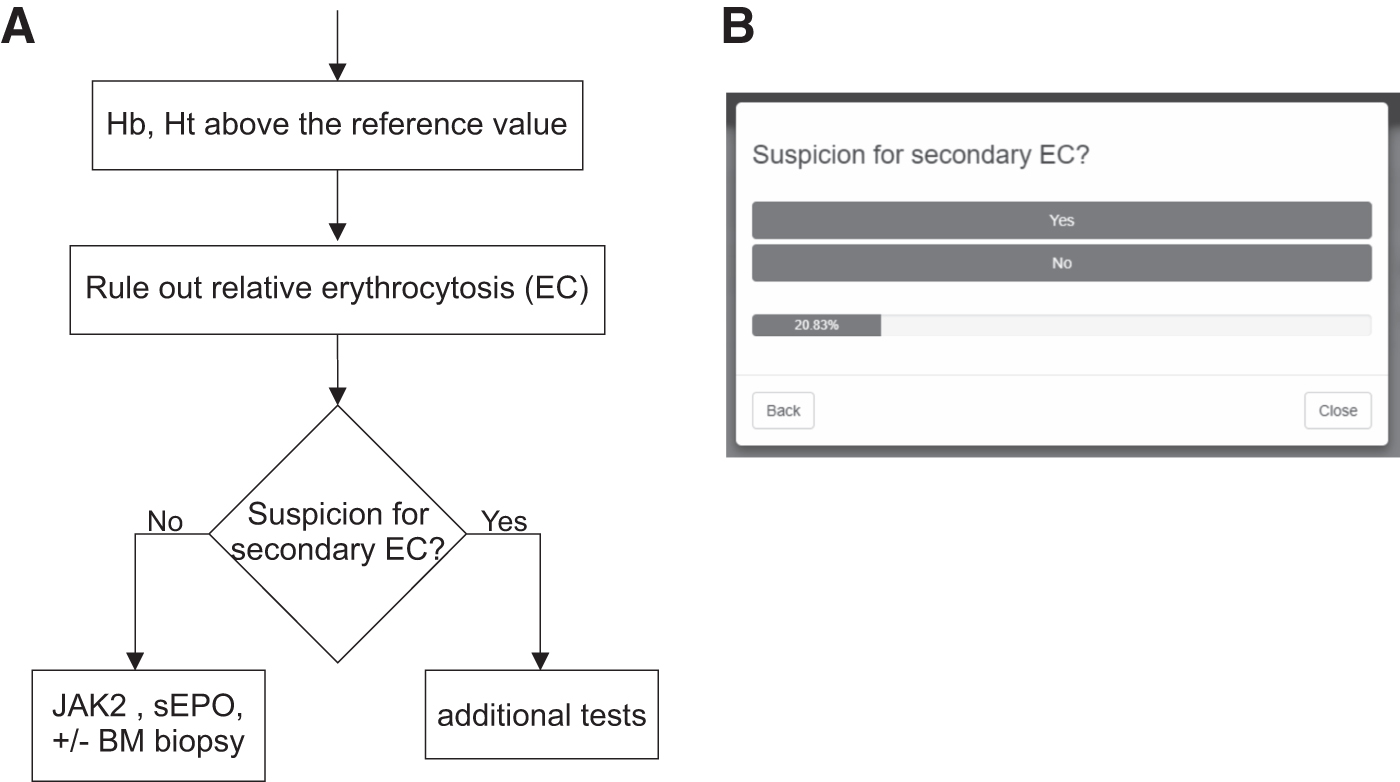
Two different types of visualization of the same algorithm.
3.3. Samples of typical usage
3.3.1. Registration and login
The user must first complete a two-step registration process on the registration page (note that browsing through the existent algorithms does not require the registration). Here, the first part consists of providing information such as name, surname, e-mail address, and password. All of the input fields in the registration form are compulsory. Upon submitting the form, the application verifies that all of the input fields were filled in correctly. The user is notified whether the information was accepted or whether some changes have to be made. In the first case, the application enters the second step of the registration process, where it fills the information into one of the three corresponding tables in the database. Upon filling the database tables, the application generates a unique confirmation key and automatically sends an e-mail, containing a confirmation link, to the user-provided e-mail address. When the user clicks on the link, the application activates the user account and the user can log into the application using the e-mail address and password on the login page.
3.3.2. Construction of visualization
The logged-in user can access the visualization-editor page where the algorithms can be constructed. The page is composed of three main components. The left side toolbar component, the main center drawing canvas component, and the right side settings component. The toolbar component holds the drawing elements and buttons for manipulating with the drawing elements. There are two main drawing elements: the process node and the decision node. The process node represents a state, process, or certain content in a specific part of an algorithm. It contains a short text description, which is visible inside the element, and a long text description, which is visible as a pop-up modal window. The process node also contains a small plus symbol, which is used to hide outgoing connections. The decision node represents a section of the algorithm wherein the algorithm's flow separates into several possible outcomes, all dependent on certain input parameters. The decision node also contains the short text description, visible inside the element on the canvas.
The toolbar's three buttons are used to manipulate the drawing elements. The first button from the top down is the add connection button. When clicked, it activates the ability to connect two drawing elements on the canvas with a connection, this is done by first clicking on the connection's outbound element and then clicking on the connection's inbound elements. Since the connections are directed, the connection's inbound element's side will have an arrow pointing to it. There is a short text description visible in the middle of the connection. The second button is the delete connection button. It is used to delete an existing connection between two elements, this is done by first clicking on the delete connection button and then clicking on the connection the user wants to delete. The third button is the delete vertex button and it is used to delete the drawing elements. There is also a fourth toolbar button named save. It is used for manipulating the algorithm's metadata (Section 3.3.3).
The central drawing canvas is the main component wherein the algorithms are constructed. The canvas dimensions are 3000 by 3000 pixels. It supports translations in all directions by using the on-screen scroll tabs or by using just the mouse wheel to move up and down and the combination of Shift + mouse wheel to move left and right. The canvas can also be zoomed in by holding the Ctrl button on the keyboard and scrolling the mouse wheel. The background of the canvas is a grid, made by using CSS, which scales and translates with the canvas. The element is brought onto the canvas by clicking and holding one of the two drawing elements in the toolbar, dragging the element over the canvas area with the mouse and dropping the element in a specific location by releasing the mouse button. Moving the elements around the canvas is done by repeating the process of dragging the elements and dropping them at the desired locations. The existing connections between elements will follow the dragged elements automatically and will readjust to their new locations.
The right side settings component holds information about elements present on the main canvas area. The information displayed here is the element ID, short text description, and long text description. The short and long text description input fields are editable and the changes are saved and displayed in the selected canvas element. Underneath follows a download PNG button, which downloads a picture with contents of canvas in PNG format, that is, elements with text and connections. There is also a help button that provides guidance with some additional explanations.
3.3.3. Metadata assignment
Upon clicking the save button in the toolbar component, a pop-up modal window appears. This window contains a form, used to describe the algorithm. The mandatory input fields are algorithm name, intended for, and access inputs. The first sets the algorithm's name, while the second stores the type of representation for the end user. The possible options for this input are doctors and patients. The access input determines whether the algorithm is intended for personal use or whether it should be publicly available. Other nonmandatory fields are the algorithm description and algorithm type inputs. The first stores an optional description of the algorithm and the second stores the type (or types) of the algorithm, used later on for filtering out the algorithms. The possible selections are diagnostic, treatment, and other. It is possible to select several types at the same time.
3.3.4. Curation query
After the algorithm has been created, its owner can send a query for the so called curation. In this case, all the users with the curation privileges will be notified that a new algorithm is waiting for its validation. After the review, curators may set the curated parameter of the observed algorithm to true or alternatively reject the request and contact its owner to make additional corrections.
3.3.5. Browsing through the algorithms
The filtering mechanism is built from several interconnected components that each contributes to the final output of the filter. It is a three-part hierarchical filter structured as a pipe; the output of the first filter is the input of the second and so on. The first part is a filter for algorithm names, the second part is a filter for the type of end user representation (intended for), the third part is a filter for the algorithm types, and the fourth part is a filter for the algorithm curation status. The algorithm name search filter is at the top level and it is not case sensitive. It outputs all the algorithms that contain the given keyword in the algorithm name. If the input field is empty, all the algorithms are outputted. The intended for filter is on the second level. It has three selectable options: all, patients, and doctors. The filter outputs the algorithms that metadata correspond to the selected value. The options are exclusive. The all option outputs all the algorithms, regardless of their metadata information. The third level algorithm type filter has three options, all of which are selected at first. The options are diagnostic, treatment, and other. The options are not exclusive, meaning that all the algorithms will be outputted, if all the options are selected, and no algorithms will be outputted, if none of the options are selected. The curated parameter filter allows users to browse only the algorithms that have been validated and thereby approved by curators.
3.3.6. Displaying the algorithms
Algorithms can be displayed in two different manners.
Flowchart diagram format: the algorithms are loaded onto the canvas area and the elements are visible just as they were when the algorithm was created and saved.
Sequential format: the algorithms are displayed through a pop-up modal window, where each element of the algorithm is displayed one by one. The modal window contains the short and long text descriptions of the current element and all of the element's outgoing connections, which are represented as decision buttons. When selecting one of the buttons, the modal window updates with the information from the element the selected decision is leading to. In the background, the algorithm is represented as a tree-like structure that behaves as a dialogue.
3.3.7. Browsing through the patient-specific algorithms
ViDis provides a separate web site that is intended for patients. Here, only algorithms labeled as patient specific and at the same time labeled as curated are displayed. From this site, users can filter and browse through different algorithms in the same manner as described in Section 3.3.5.
4. Conclusions
We believe that the accessibility and simplicity of the ViDis platform will allow the whole range of its target users to exchange and share vital information in the field of medical diagnostics, disease prevention, and treatment. ViDis presents an excellent tool for disseminating knowledge among clinicians, diagnosticians, and researchers as well as for raising awareness among patients. In this context, the tool has a large potential to allow more effective use of physicians time spent with their patients. Using the platform, patients will be able to increase the awareness about potential symptoms and their progression, progression of their diseases, or potential adverse effects of prescribed drugs.
ViDis has already been successfully applied to the process of construction of novel medical algorithms related to two blood disorders: the chronic myeloid leukemia (CML) and familial erythrocytosis (FE). CML is a chronic disease with variety of treatment options, which needs to be regularly monitored and treatment accordingly adjusted. FE is a rare disorder that often remains undiagnosed due to complex diagnostic algorithm. FE algorithm has been constructed in collaboration with clinicians and is already available for use by medical doctors and professionals.
We believe that ViDis will find a wide audience of its use within the near future. ViDis will allow these users to share advances in the field of medical diagnostics and treatment with the rest of the medical and research community as well as with patients all over the world.
Footnotes
Acknowledgments
We thank Kristina Modic and Milena Remic for their contribution in establishment of algorithms for CML.
Author Disclosure Statement
The authors declare they have no competing financial interests.
Funding Information
This study was partially supported by the project genetic diagnosis of blood disorders cofinanced by the Republic of Slovenia and the European Union under the European Social Fund, by the scientific-research program Pervasive Computing (P2-0359) financed by the Slovenian Research Agency in the years from 2013 to 2023, and by the basic research projects CholesteROR in metabolic liver diseases (J1-9176) and genetic basis of erythrocytosis in Slovenia (L3-9279) financed by the Slovenian Research Agency in the years from 2018 to 2021.