
Abstract
VirE2 from Agrobacterium tumefaciens is a single-stranded (ss) DNA-binding protein involved in delivery of ssT-DNA (single-stranded transfer DNA) from the agrobacterial Ti plasmid into the eukaryotic cell nucleus. The crystallized part of VirE2 was studied by X-ray diffraction, and the noncrystallized parts of the C- (40 amino acid residues [aars]) and N- (111 aars) termini of the protein, which are presumably disordered, were evaluated by computational methods. We did a molecular dynamics simulation of VirE2 without VirE1 and observed no large changes in domain orientation. The interaction of VirE2 with ssDNA and formation of ssDNA–VirE2 complexes in silico were studied. We also used computer-aided methods to design model complexes consisting from two- and four-subunit VirE2 proteins. We examined the implication of disordered sites in formation of two- and four-subunit VirE2 complexes. Formation of VirE2 dimers and tetramers within ssDNA–VirE2 complexes was demonstrated by computational methods. Using the Platinum program, we found that hydrophilic amino acids were predominant on the surface of the four-subunit VirE2 complex.
1. Introduction
Soil bacteria of the genus Agrobacterium can transfer single-stranded transfer DNA (ssT-DNA) in complex with the VirE2 and VirD2 proteins into the plant cell nucleus and can incorporate it into host cell chromosomes (Alvarez-Martinez and Christie, 2009; Gelvin, 2009). The expression of transferred genes in the host cell is already used widely in agricultural biotechnology to produce transgenic plants. It changes the host cell's properties, opening the prospect for biomedical applications in gene therapy of animal cells because T-DNA transfer into animal cells has already been shown (Kunik et al., 2001).
T-DNA translocation relies on a type IV secretion system and presumably occurs during close membrane contact mediated by a protein structure or channel (Lessl and Lanka, 1994; Jakubowski et al., 2009). In agrobacterial cells, the T-DNA-binding sites of VirE2, located in the C-domain (Dombek and Ream, 1997), are specifically blocked by the VirE1 chaperone protein, which prevents formation of aggregates of VirE2 and helps to keep it in the form required for transport (Sundberg et al., 1996; Sundberg and Ream, 1999; Abu-Arish et al., 2004; Frenkiel-Krispin et al., 2007; Dym et al., 2008). The ssT-DNA–VirD2 and VirE2–VirE1 complexes are transferred into the plant cell cytosol separately (where VirE2 gets attached to ssT-DNA–VirD2) and form a T-complex (Sundberg et al., 1996; Mysore et al., 1998). As a result, the T-complex cannot be formed in a bacterial cell; this takes place in the plant cell cytoplasm (Fullner, 1998; Gelvin, 2009).
VirE2 can interact in vitro not only with T-DNA but also with other ssDNAs (Volokhina and Chumakov, 2007). An earlier transmission electron microscopy (TEM) study indicated that the ssDNA–VirE2 complex has a solenoidal (telephone coil) organization (Citovsky et al., 1997). A three-dimensional reconstruction of this complex by TEM and single-particle image processing revealed a hollow helical structure that had an outer diameter of 15.7 nm, a helical rise of 51.5 nm, and 4.25 VirE2 proteins per turn (Abu-Arish et al., 2004).
The VirE2 protein, in addition to being able to bind ssDNA and protect it from host cell endonucleases, probably also performs some other functions. This follows from its ability to interact with plant cytoplasmic proteins (Gelvin, 2009) and with an artificial lipid membrane as a pore former, increasing the membrane's electrical conductivity (Dumas et al., 2001; Chumakov et al., 2010). However, it is still unknown how ssT-DNA–VirD2–VirE2 is transferred through the host cell membrane and in what way VirE2 interacts with ssT-DNA–VirD2 after dissociation of the VirE2–VirE1 complex. The goal of this work was to investigate the multicomplexes and in vitro and in silico interactions of VirE2 with ssDNA.
2. Methods
2.1. Computational methods
For designing structures consisting of two and four subunits, the GRAMM-X program (Protein Docking WebServer v.1.2.0, http://vakser.bioinformatics.ku.edu/resources/gramm/grammx) was used.
For constructing a complete 3D model of VirE2, taking into account the missing sections at N- and C-termini of the protein, the I-TASSER program was used (https://zhanglab.ccmb.med.umich.edu/I-TASSER).
The Swiss-PdbViewer program (https://spdbv.vital-it.ch) was used for visualization and for computation of the surface area between protein subunits. VMD (https://www.ks.uiuc.edu/Research/vmd) was used for visualization and molecular dynamics (MD) simulation analysis. A full model of VirE2, with the N- and C-termini missing in the X-ray data, was used as the initial structure. The structure was prepared for MD with the help of the MDWeb server (http://mmb.irbbarcelona.org/MDWeb/index.php; Hospital et al., 2012). All energy/MD calculations were done using the CHARMM force field in the NPT ensemble, with the CPT algorithm implemented in the CHARMM program. Simulation was done on a Xeon E5-2697V3x2/128GB DDR4/Nvidia Tesla K80 platform. MD simulation of VirE2's structure was done with the NAMD 2.10 program (www.ks.uiuc.edu/Research/namd) using the CHARMM-27 force field (Nelson et al., 1996). Calculations were done with periodic boundary conditions at a constant temperature of 300 K and constant pressure of 1.01325 bar (NPT ensemble). The simulation time was 1 nsecond. Contact Finder (http://bioinf.modares.ac.ir/software/nccfinder/index.html) was used for contact spot analysis.
The intrinsic disorder regions in VirE2 were evaluated with three protein intrinsic disorder prediction programs: PONDR (www.pondr.com), PrDOS (http://prdos.hgc.jp/cgi-bin/top.cgi), and DisEMBL (http://dis.embl.de). PrDOS, PONDR, and DisEMBL are web servers that predict disordered regions in a protein according to its amino acid sequence. PrDOS is a system consisting of two modules: a predictor based on information about the local amino acid sequence and a predictor based on template proteins. The server combines the results of two predictors and returns a prediction of two states (order/disorder) and the probability of disorder for each remainder. PONDR is a direct-link, neural network predictor that uses sequence attributes taken in sequences of 9–21 amino acids. These attributes, for example, the fractional composition of certain amino acids or sequence complexity, are averaged over these parameters, and the values are used to train the neural network during construction of the prediction. The same values are used as input for prediction. DisEMBL is a disorder-predicting method based on artificial neural networks. The prediction program uses the secondary structure, high-temperature factors, and missing coordinates in the X-ray structural model.
3. Results and Discussion
3.1. MD simulation of VirE2 protein
The crystallized part of VirE2 was studied by X-ray diffraction (Dym et al., 2008). The noncrystallized parts of the C- (40 amino acid residues [aars]) and N- [111 aars]) termini of the protein, which are presumably disordered, were evaluated by computational methods (Volokhina et al., 2011). At the N-terminus of the VirE2 3D structure (PDB ID:3BTP), among the absent (in the model based on X-ray data) 111 aars, the PROFsec program predicted a 14-aar helix whose length was estimated with the Swiss-PdbViewer program to be ∼1.5 nm. No specific structures were predicted at the C-terminus (Volokhina et al., 2011). Using PONDR, PrDOS, and DisEMBL, we evaluated the intrinsic disorder regions in VirE2 (Fig. 1). As can be seen from Figure 1, disordered structures prevailed at the N- and C-terminal ends of VirE2.
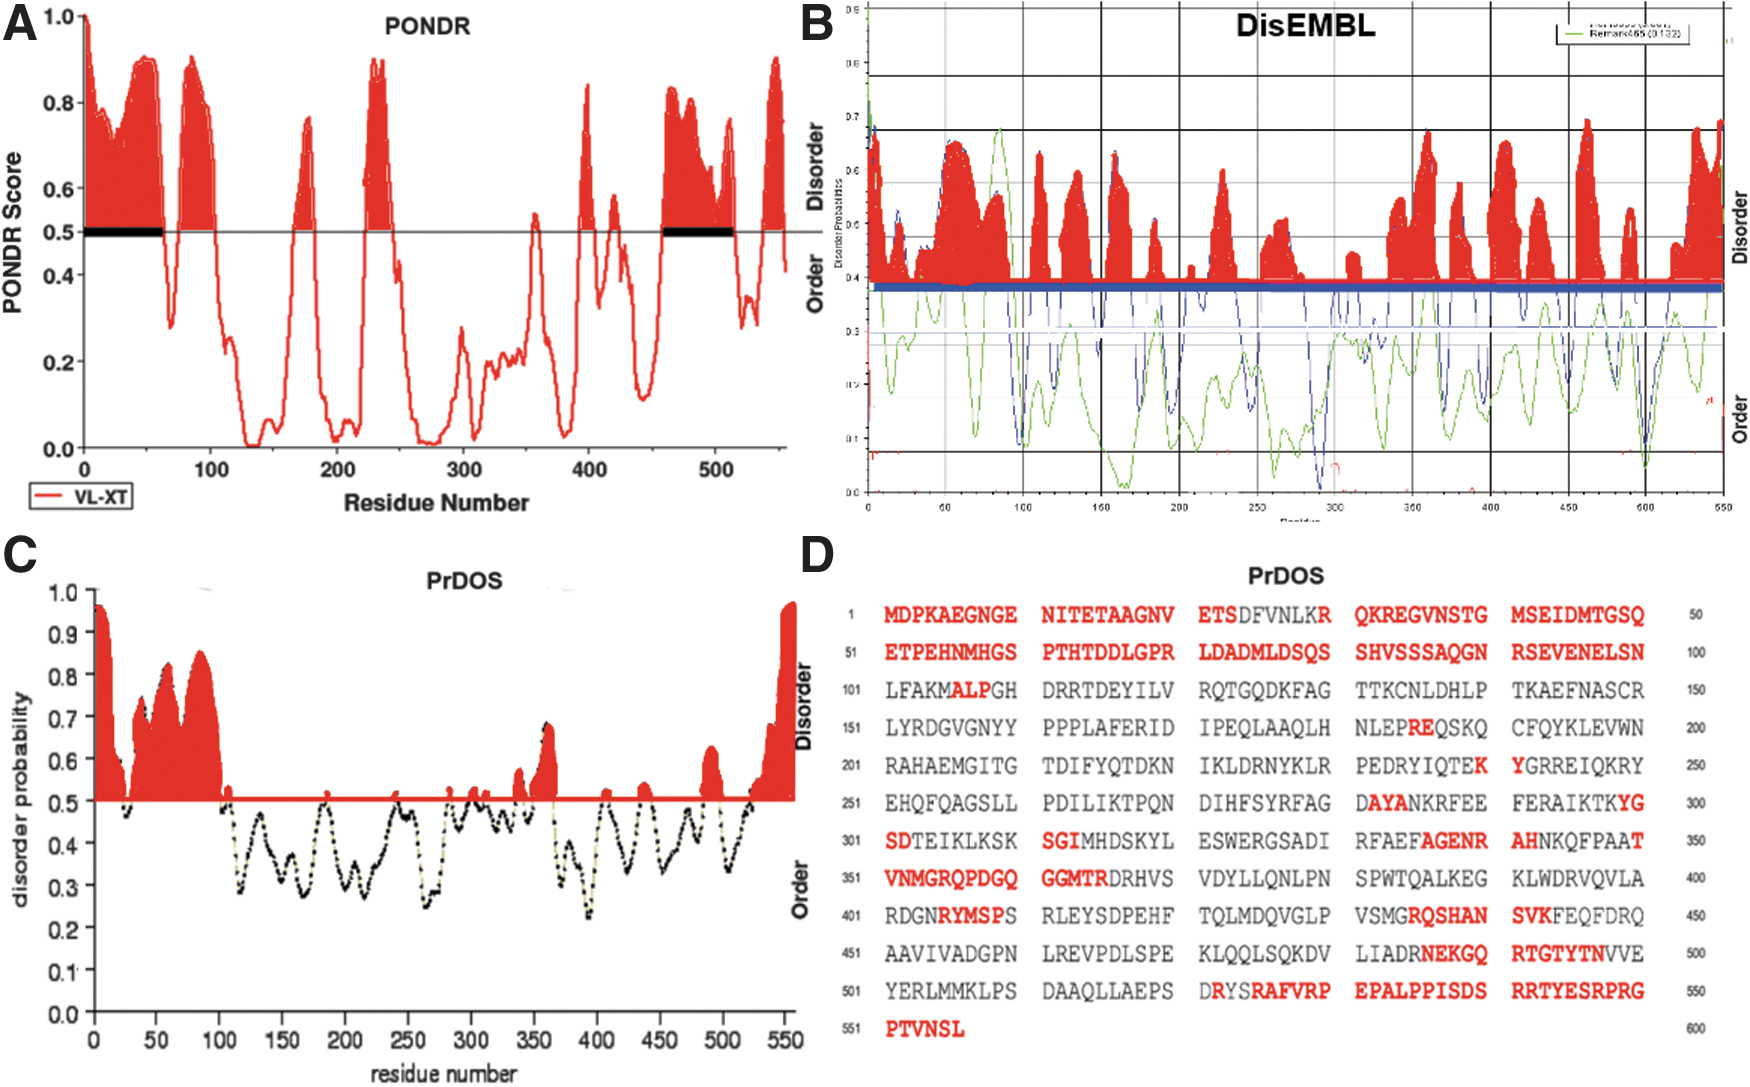
Disorder region prediction for VirE2 by using
The peaks corresponding to certain amino acids (abscissa axis) located above the separation line (order/disorder) were disordered, and the amino acids located below the order/disorder line were ordered (Fig. 1A–C). Many 3D protein structures are incomplete owing to the disorder or flexibility of individual protein regions that do not have electron density. In our case, the programs predicted disorder in areas that did not have electron density in the X-ray diffraction model of VirE2. These regions correspond to the uncrystallized structures in the 3D model (3btp) of VirE2 (Dym et al., 2008), which have no electron density.
In the X-ray 3D VirE2 model (PDB ID: 3BTP) at the N-terminus among the missing (Dym et al., 2008) 111 aars, PROFsec predicted one helix of 14 aars. Its length was ∼1.5 nm, as estimated with Swiss-PdbViewer. At the C-terminus, no specific structures were predicted (Volokhina et al., 2011). The complete 3D model of VirE2 was obtained with I-TASSER (Fig. 2). The program predicted three α-helixes at the N-terminus of VirE2 and one α-helix at its C-terminus.
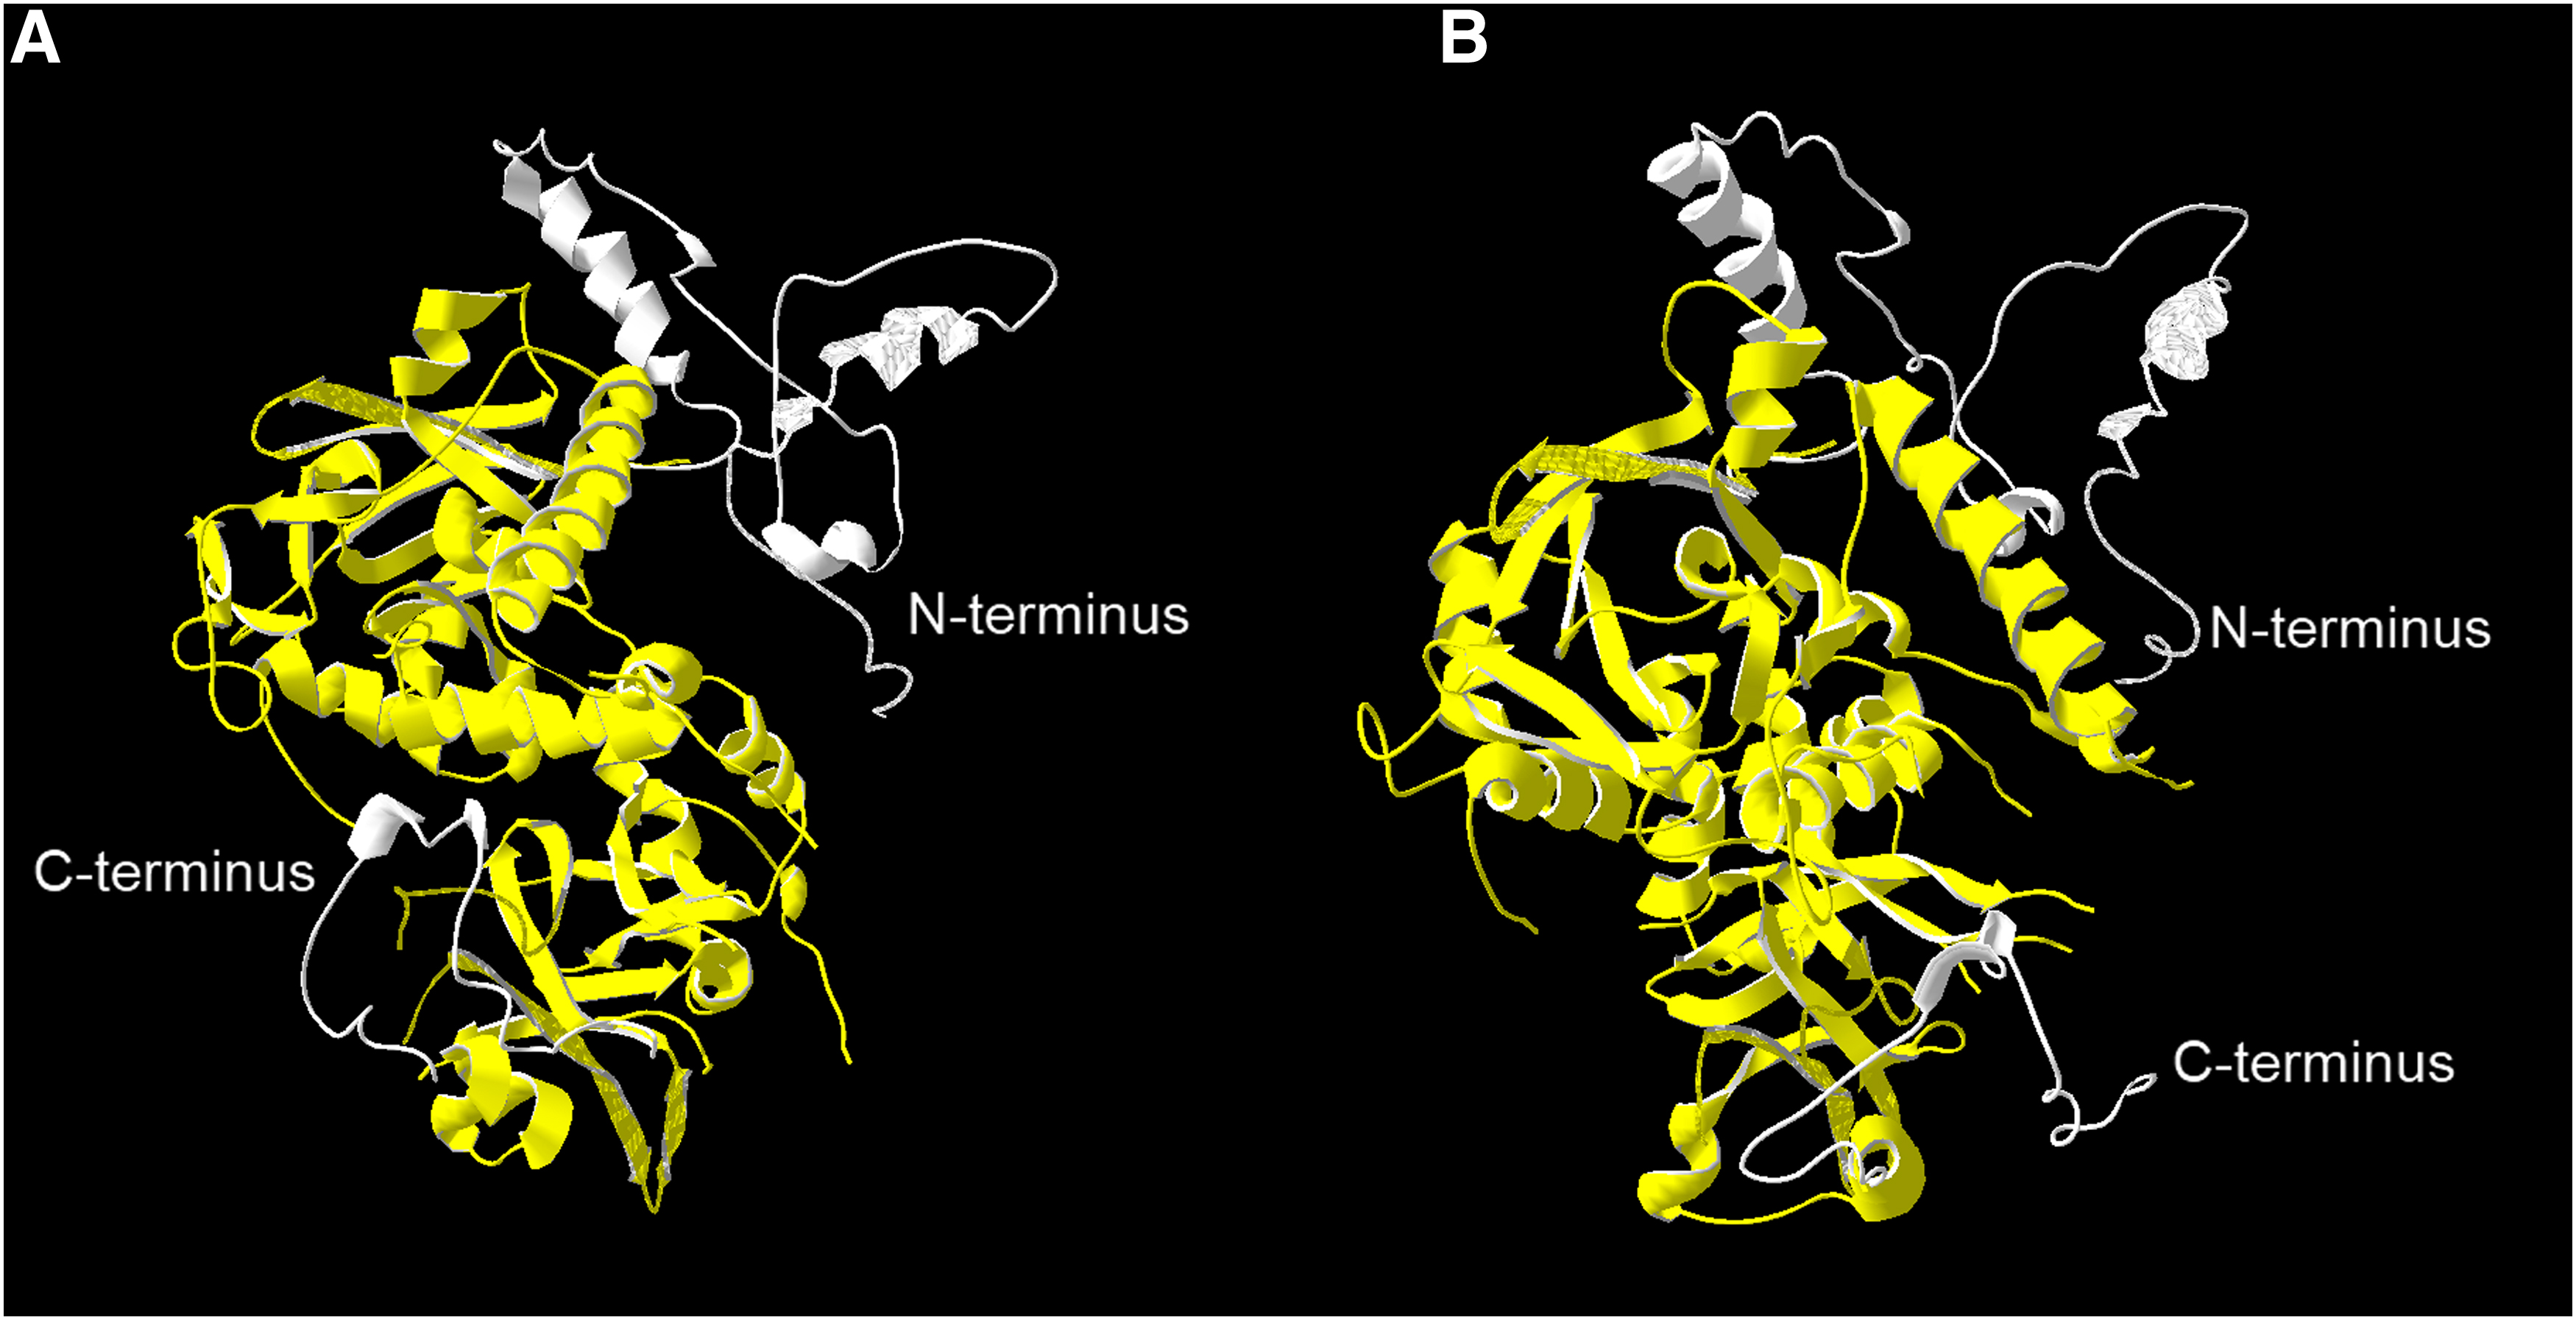
Complete 3D model of VirE2 on the basis of an X-ray structural model of VirE2 (3btp), taking into account the missing sections at the N- and C-termini. The model was built with I-TASSER. Yellow color, VirE2 (3btp) model; white color, completed missing sections in the VirE2 structure.
I-TASSER (as Zhang-Server) has been consistently ranked as the top method for protein structure and function prediction (https://en.wikipedia.org/wiki/I-TASSER).
We did an MD simulation to assess the stability of the complete 3D VirE2 model based on the X-ray structural model with missing N- and C-termini. The change in conformation of VirE2's structure was characterized by root mean square deviation (RMSD) of C-alpha atoms. The changes in conformation of VirE2 for simulation times of 0 and 1 nsecond are shown in Figure 3A. Figure 3B shows values of the RMSD between the original model and VirE2 models for different times of simulation. Figure 3B shows that after a simulation time of 800 pseconds, the RMSD reached a plateau. This indicates that the model for VirE2 reaches equilibrium, a stable state, at simulation times beyond 800 pseconds. In this period, we did not observe any large changes in domain orientation (Fig. 3A).
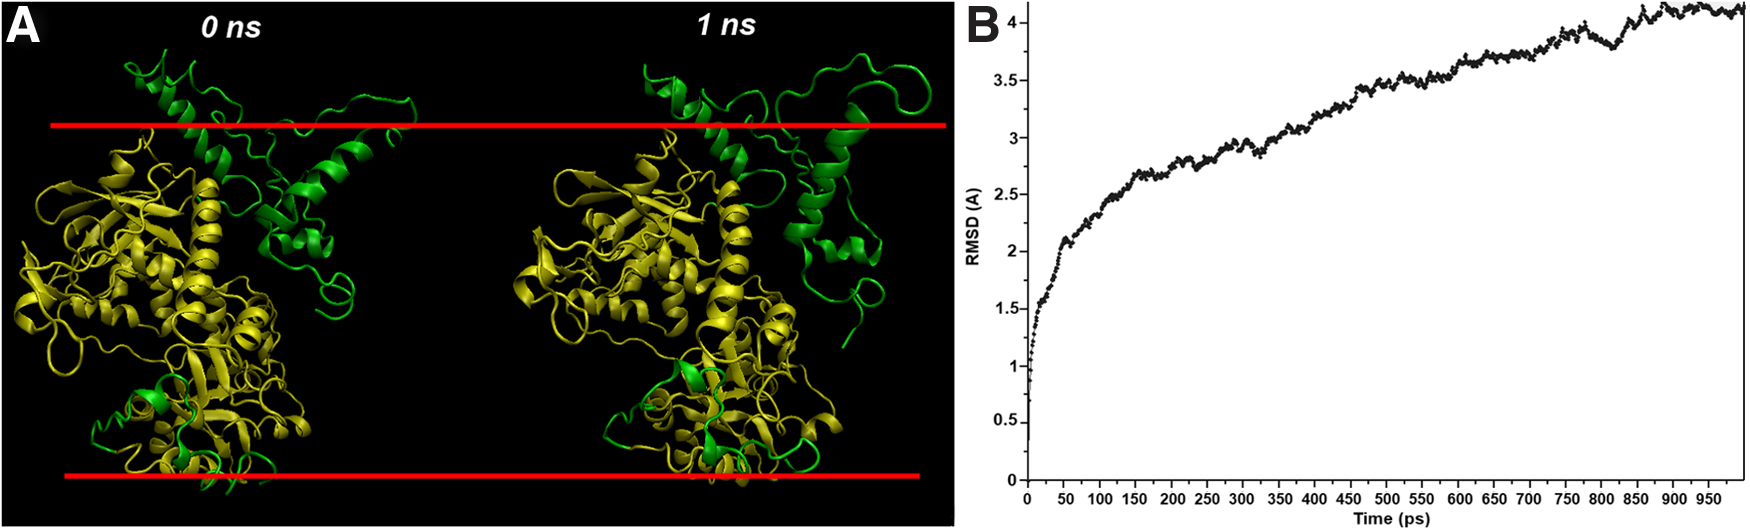
Molecular dynamics simulation of the complete 3D VirE2 model based on the X-ray structural model (amber) with missing N- and C-termini (green).
Figure 4 shows the dynamics of the missing N- (A) and C- (B) termini.

RMSD per simulation time for VirE2 with missing N-termini
In the absence of VirE1, VirE2 is prone to aggregation because VirE1 forms a complex with VirE2 in an agrobacterial cell owing to interaction of the latter at binding sites that simultaneously serve for contact with ssT-DNA upon T-complex formation in the plant cell cytoplasm (Abu-Arish et al., 2004; Frenkiel-Krispin et al., 2007; Dym et al., 2008).
As found by DLS, half (51%) of the particles in an in vitro solution of VirE2 have a hydrodynamic diameter of 12 nm and 47% of the particles are aggregates with a mean size of 115 nm (Volokhina et al., 2011). The size of a single VirE2 was measured by 3D reconstruction techniques based on electron microscopy data (Abu-Arish et al., 2004) and by our computer reconstruction based on X-ray analysis data (Volokhina et al., 2011). Because it was significantly smaller than the VirE2 size measured by DLS (12–18 nm), the question arises whether the VirE2 protein exists in solution as a single molecule or as a complex of two or more proteins.
The hydrodynamic diameter of a nonspherical particle is the diameter of a sphere that has the same rate of translational diffusion as the particle does. It was previously established that the size of VirE2 with missing N- and C-termini does not exceed the cell size of 8 × 6 × 5 nm (Volokhina et al., 2011). The N-terminus of the protein modeled by us has dimensions of 5.5 × 3.8 × 3.1 nm (111 aars), and the C-terminus has dimensions of 2.5 × 3.2 × 1.5 nm (40 aars). If the shape of a particle changes in a way that affects the diffusion rate, then the hydrodynamic size also changes.
For example, small changes in the length of a rod-shaped particle will directly affect the size, whereas changes in the diameter of the rod, which are unlikely to affect the diffusion rate, will be difficult to detect (Arzenšek, 2010). The conformation of proteins usually depends on the nature of the dispersing medium. Factors that affect the hydrodynamic size of a protein are the molecular weight of the molecule, conformation of the molecule, and also the state of the protein (native or folded). On average, proteins and aggregates are spherical. Spherical proteins have smaller hydrodynamic radii than do elongated proteins (Arzenšek, 2010).
Because VirE2 may have a nonspherical shape, its hydrodynamic radius will approximately be as shown in Figure 5 (size of 9.7 nm, measured between Val36 and Met505). When measuring the size of a protein by DLS, both the shape of the protein and its hydration are taken into account (Narhi, 2013). The water shell around proteins can be about 1–1.5 nm on the protein surface or 2–3 nm between adjacent proteins, as shown by terahertz spectroscopy (Bye et al., 2014) and MD (Lábas et al., 2017). Therefore, all of the above may indicate that 12 nm, as measured by DLS, may well correspond to a single protein with regard to its hydration.
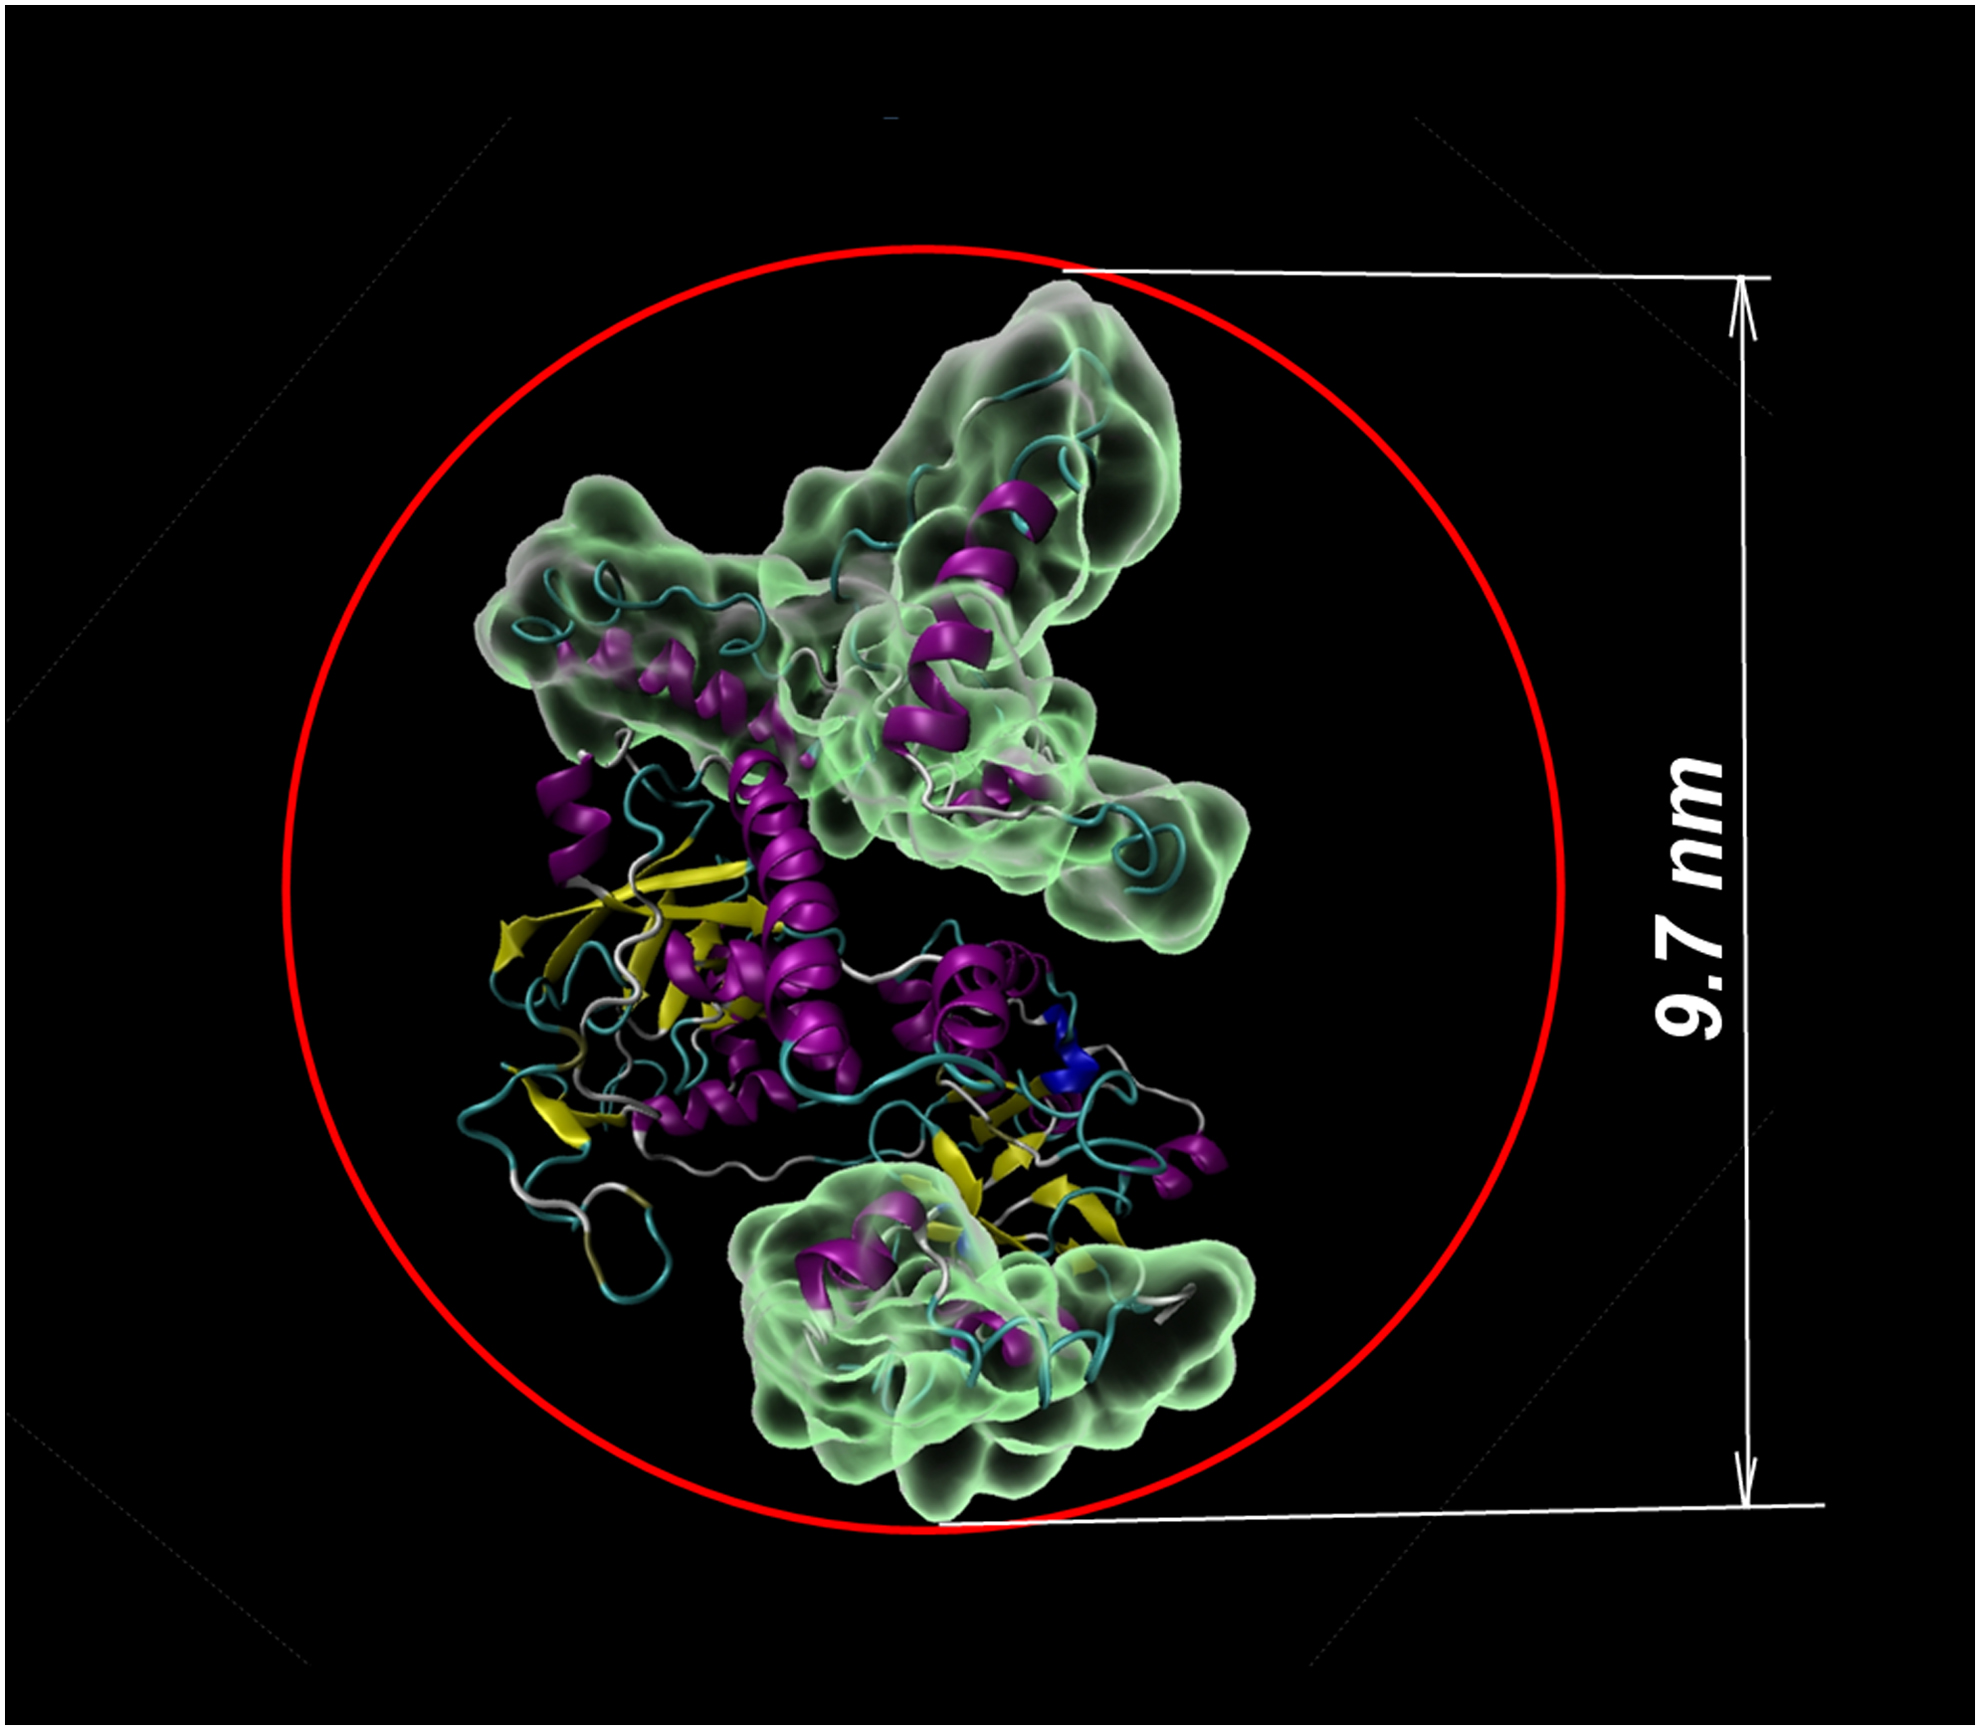
Probable hydrodynamic radius of VirE2 (size of 9.7 nm, measured between Val36 and Met505).
3.2. Computer evaluation of the two-subunit VirE2 complex
We examined the implication of disordered sites in formation of two-subunit VirE2 complexes. According to GRAMM-X estimations, we modeled the VirE2 complex with a missing terminus consisting of two subunits with two contact spots (Fig. 6). As can be seen from the figure, the proteins in the complex are located symmetrically relative to each other. The N-terminus (green) of the blue protein, which is absent in the X-ray model, interacts with the red protein, and the N-terminus (yellow) of the red protein interacts with the blue protein. By using the Swiss-PdbViewer Detect Contact Surface module, the contact area between the subunits of VirE2 was estimated to be 696 Å2 (348 Å2 for the contact spot marked with an arrow on top of Fig. 6 and 348 Å2 for the contact patch marked with an arrow at the bottom of Fig. 6).

With ContactFinder, we estimated the residues that were involved in the contact spot between the two subunits of the complex (Supplementary Table S1). The table lists amino acids of the red protein (Fig. 6) located at the contact point with the N-terminus (green) of the blue protein (Fig. 6). Because the complexes are symmetrical with respect to each other, similar amino acids interact at the lower point of contact.
Considering the tabulated data and analysis of visualization of the contact spot, we conclude that the missing N-terminus in the X-ray model of VirE2 can be directly involved in formation of a complex between two subunits of the VirE2 protein.
3.3. Computer evaluation of the four-subunit VirE2 complex
Formation of a VirE2 tetramer within the ssDNA–VirE2 complex was demonstrated by TEM (Abu-Arish et al., 2004). It was speculated that VirE2 proteins can form a four-subunit complex (Duckely and Hohn, 2003; Volokhina et al., 2011; Bharat et al., 2013). A complex of four subunits was built with the GRAMM-X program on the basis of X-ray data for the VirE2–VirE1 complex (Dym et al., 2008) with missing N- and C-termini for each individual subunit. The four-subunit complex is a closed-type ring-like roll and its dimensions are shown in Figure 7.

With the ContactFinder program, we estimated the residues involved in the four contact spots of the complex (Supplementary Table S2). By using the Swiss-PdbViewer Detect Contact Surface module, the contact area between the subunits of the VirE2 protein was estimated: between protein 1 and protein 2 (Fig. 7), 305 Å2; between protein 2 and protein 3 (Fig. 7), 434 Å2; between protein 3 and protein 4 (Fig. 7), 305 Å2; and between protein 1 and protein 4 (Fig. 7), 434 Å2. The summary contact area for the four contact spots was 1478 Å2.
In the presence of ssDNA, ring-like objects also appeared on TEM grids. A two-dimensional alignment of such objects confirmed that they were, in fact, tetrameric rings (Abu-Arish et al., 2009). From figure and Supplementary Table S2, we may conclude that the missing regions in the X-ray data are part of the contact spot for the fully modeled four VirE2 complexes.
Footnotes
Author Disclosure Statement
The authors declare that they have no competing financial interests.
Funding Information
This work was supported by a grant from the President of the Russian Federation for state support of young Russian scientists—PhDs (no. MK-2187.2019.4), and the Program of Fundamental Scientific Research of State Academies for the years 2017–2019 (registration no. 01201359048).
References
Supplementary Material
Please find the following supplemental material available below.
For Open Access articles published under a Creative Commons License, all supplemental material carries the same license as the article it is associated with.
For non-Open Access articles published, all supplemental material carries a non-exclusive license, and permission requests for re-use of supplemental material or any part of supplemental material shall be sent directly to the copyright owner as specified in the copyright notice associated with the article.