




Abstract
This study aimed to identify key functional modules and genes in functional module involved in hepatocellular carcinoma (HCC) development. The microarray data set GSE54236 was obtained from Gene Expression Omnibus (GEO) database. Differentially expressed genes (DEGs) between HCC, and normal samples were identified by Limma. DAVID was used to identify the gene ontology terms these genes enriched. The co-expression network was constructed based on Pearson correlation coefficient between gene expression values, and the functional modules these DEGs obviously enriched in were recognized through GraphWeb. Then, based on the genes related to the development of HCC, the DEGs interacting with HCC-associated genes were spotted. Finally, survival analysis and real-time quantitative polymerase chain reaction were performed. Totally, 427 upregulated (e.g., cell division cycle associated 5 [CDCA5], kinesin family member 4A [KIF4A], TPX2 microtubule nucleation factor [TPX2]) and 313 downregulated (e.g., metallothionein 1E [MT1E]) DEGs were identified in HCC. Besides, CDCA5, KIF4A, and TPX2 had interacting relationship and played important roles in HCC development by interrelating with HCC-related gene, forkhead box M1 (FOXM1). Furthermore, CDCA5, KIF4A, TPX2, and FOXM1 obviously enriched in cell cycle-related functional module, whereas MT1E enriched in mineral absorption module in Kyoto Encyclopedia of Genes and Genomes. CDCA5, KIF4A, and TPX2 expression were increased in HCC cells, and their high expressions were related to poor prognosis. Overexpression of CDCA5, KIF4A, TPX2, and FOXM1 coregulated cell cycle and thereby promoted the development of HCC. The finding provided potential targets for the study and treatment of HCC.
1. Introduction
Hepatocellular carcinoma (HCC), a common malignant tumor, leads to ∼700,000 deaths each year worldwide, making it the third major cause of cancer deaths (Ferlay et al., 2015). The major risk factors of HCC include alcohol-related cirrhosis, nonalcoholic steatohepatitis, infection with hepatitis B or C viruses, and smoking, whereas coffee may be the protective factor (Bruix et al., 2014). More than 90% of the patients with HCC develop into an established chronic liver disease, cirrhosis (Bruix and Sherman, 2011; Elserag et al., 2011; European Association for the Study of the Liver, 2012). Patients with HCC usually present with liver failure and cancer symptoms, unless detection of cancer at the early stage (Bruix et al., 2016). Hepatectomy, transplantation, and ablation are still the most effective treatment with 60%–80% survival for 5 years ( Livraghi et al., 2008; Roayaie et al., 2013). However, most of the patients are not suitable for surgical resection or liver transplantation treatment due to severe liver dysfunction or distant metastasis. Besides, due to obvious adverse reactions as well as existence of relative and absolute contraindications, the selectivity of existing chemotherapy drug is not high (Cheng et al., 2009; Lencioni, 2012; Forner et al., 2014). Therefore, currently, the focus of liver cancer treatment is to develop more effective new treatments.
Molecular targeting therapy, with a strong specific significant effect and less adverse reactions, has been favored by researchers. Some key genes such as p73, p53, Rb, anaphase-promoting complex (APC), p16, PTEN, IGE-2, BRCA2, SOCS-1, Smad2, Smad4, B-catenin, c-myc, and cyclin D1 are found to be mutated during HCC development ( Ito et al., 1999; Ido et al., 2001; Lebedeva et al., 2003). Besides, due to the existence of heterogeneity of gene mutation, the molecular pathogenesis of HCC is complex and diverse, making molecular targeting therapy difficult (Grisham, 2002). Furthermore, microarray technology has identified several molecular signatures such as genes related to molecular pathways, including oncogenes, cytoskeleton, the extracellular matrix, as well as signal transduction/translational regulatory genes, immune response-related genes, tumor suppressor genes, and apoptosis-related genes (IGF-R, EGFR, MAPK, WNT, TGFβ, and MET/HGF) (Iizuka et al., 2003; Ye et al., 2003; Lee et al., 2006; Hoshida et al., 2008; Woo et al., 2008; Kim et al., 2012). The hepatic five-gene signature, including neuropilin/tolloid-like 2 (NETO2), endothelial cell-specific molecule-1 (ESM1), nuclear receptor subfamily 4, group A, member 1 (NR4A1), delta-like ligand 4 (DLL4), and angiopoietin-2 (ANGPT2), can be used to predict HCC growth and consequent risk of mortality in individual patients (Villa et al., 2016). However, there was rarely a study to investigate drugs with multimolecular and multichannel targets.
In this study, the gene microarray data set numbered GSE54236 were downloaded and preprocessed. Then the differentially expressed genes (DEGs) between the tumor tissues and the nontumor liver samples as well as the gene ontology (GO) terms these genes enriched were identified. Subsequently, according to the Pearson correlation coefficient (PCC) between gene expression values, the co-expression network was constructed. Furthermore, the functional modules these DEGs obviously enriched in were recognized. Finally, based on the genes related to the development of HCC, the DEGs interacting with HCC-associated genes were spotted. Our results may be conducive to the construction of new markers for HCC recognition and new targets for HCC treatment.
2. Materials and Methods
2.1. Data sources
The gene microarray data set numbered GSE54236 (Villa et al., 2016) were obtained from the Gene Expression Omnibus (GEO) database of National Center for Biotechnology Information (www.ncbi.nlm.nih.gov/geo). There were 161 samples in this expression profiling, consisting of 81 tumor tissues and 80 nontumor liver samples. All the samples were obtained from patients with Child–Pugh class A liver cirrhosis. Annotation platform of this expression data was GPL6480 Agilent-014850 Whole Human Genome Microarray 4x44K G4112F (Probe Name version). Informed consent was received from all patients before the study.
2.2. Data preprocessing and normalization
The Limma package (Smyth and Smyth, 2013) was utilized to identify DEGs and the Bonferroni correction method (Benjamini and Hochberg, 1995) in multtest package was used to get the correction of false discovery rate (Benjamini, 2010). The thresholds of |log2 FC (fold change)| > 1 and p-value <0.05 were set to define DEGs.
2.3. Analysis of DEGs between different groups
The same gene may have different expression values in different disease states. Therefore, the expression value of DEGs in different groups were analyzed using T test, and p < 0.05 was considered as the significant threshold. The results were shown as scatter plots and cartridges, respectively.
2.4. Gene set enrichment analysis
To understand the specific biological effects of genes in risk modules in HCC, the DAVID software (Huang et al., 2009a, 2009b) was used to carry out gene set enrichment analysis of genes in the risk module to verify whether the DEGs in each functional unit of GO is randomly gathered (Subramanian et al., 2005). The p-value of each GO term was calculated based on the following algorithm:
2.5. Construction of co-expression network
We calculated the PCC (Mao et al., 2009) between the two genes based on the formula of correlation in EBcoexpress package (Dawson et al., 2012) in R. The formula is as follows:
2.6. Analysis of co-expression network module
GraphWeb (http://biit.cs.ut.ee/graphweb) is a public web server for biological network analysis and module discovery, providing methods to (1) identify a variety of functional modules to the network and (2) integrate heterogeneous and multispecies data for constructing directed and undirected, weighted and unweighted networks (Reimand et al., 2008). To get the functional modules of the DEGs involved in the co-expression network, the module mining tool GraphWeb was utilized to classify the modules.
2.7. Identification of module gene involved in liver cancer genes
The genes closely related to the development and progression of HCC were obtained from liver cancer gene database-OncoDB.HCC (oncogenomic database of hepatocellular carcinoma) and mapped to co-expressed networks and functional modules previously constructed for digging the DEGs associated with liver cancer genes.
2.7.1. Survival analysis
The survival data for liver cancer (LIHC) in The Cancer Genome Atlas (TCGA) were downloaded from the University of California Santa Cruz (UCSC, http://xena.ucsc.edu/) Genome Browser database. The genes were divided into high-expression and low-expression group based on expression median value, and Kaplan–Meier survival curves were plotted using survival package in R. p-Value <0.05 was selected to determine whether the genes were associated with survival of HCC.
2.8. Real-time quantitative PCR
Human normal liver cells (L-O2) and HCC cells (Huh6) were provided by Shanghai Iyunbio Co., Ltd (Shanghai, China). The first-strand cDNA was synthesized by miRNA First-Strand cDNA Synthesis Kit (EY001; Shanghai Iyunbio Co.). Power SYBR Green PCR Master (4367659; Thermo) was used to performed RT-PCR. The procedures for the real-time polymerase chain reaction (RT-PCR) were as follows: 50°C for 3 minutes, 95°C for 3 minutes, 95°C for 10 seconds, followed by 40 cycles of 95°C for 10 seconds and 60°C for 30 seconds. The comparative Ct method was utilized to quantify the expression of target mRNA, which was normalized to GAPDH expression. The primers used in RT-PCR are shown in Table 1.
The Primers Used in RT-PCR
RT-PCR, real-time polymerase chain reaction.
2.9. Statistical analysis
All data are expressed as mean ± standard error of the mean, and the differences between human normal liver cells and HCC cells were compared using Student's t-test. The SPSS 22.0 (SPSS, Inc., Chicago, IL) and GraphPad Prism 5 (GraphPad Software, San Diego, CA) were used for statistical analyses and mapping the results, respectively. A p-value of <0.05 was considered to represent a significant difference.
3. Results
3.1. DEGs in different kinds of samples
According to the aforementioned selection criteria, important DEGs in different samples were identified. Totally, 870 DEGs, including 427 upregulated and 313 downregulated DEGs, were identified in tumor liver samples compared with nontumor.
3.2. Comparison of DEGs between different groups
The DEGs in tumor samples were corresponded to the expression value of each gene, and compared the expression value in different groups. The results showed that the expression of DEGs in the two groups was deviated from the diagonal (Fig. 1A), indicating the dissimilar expression in different groups that was consistent with Figure 1B.
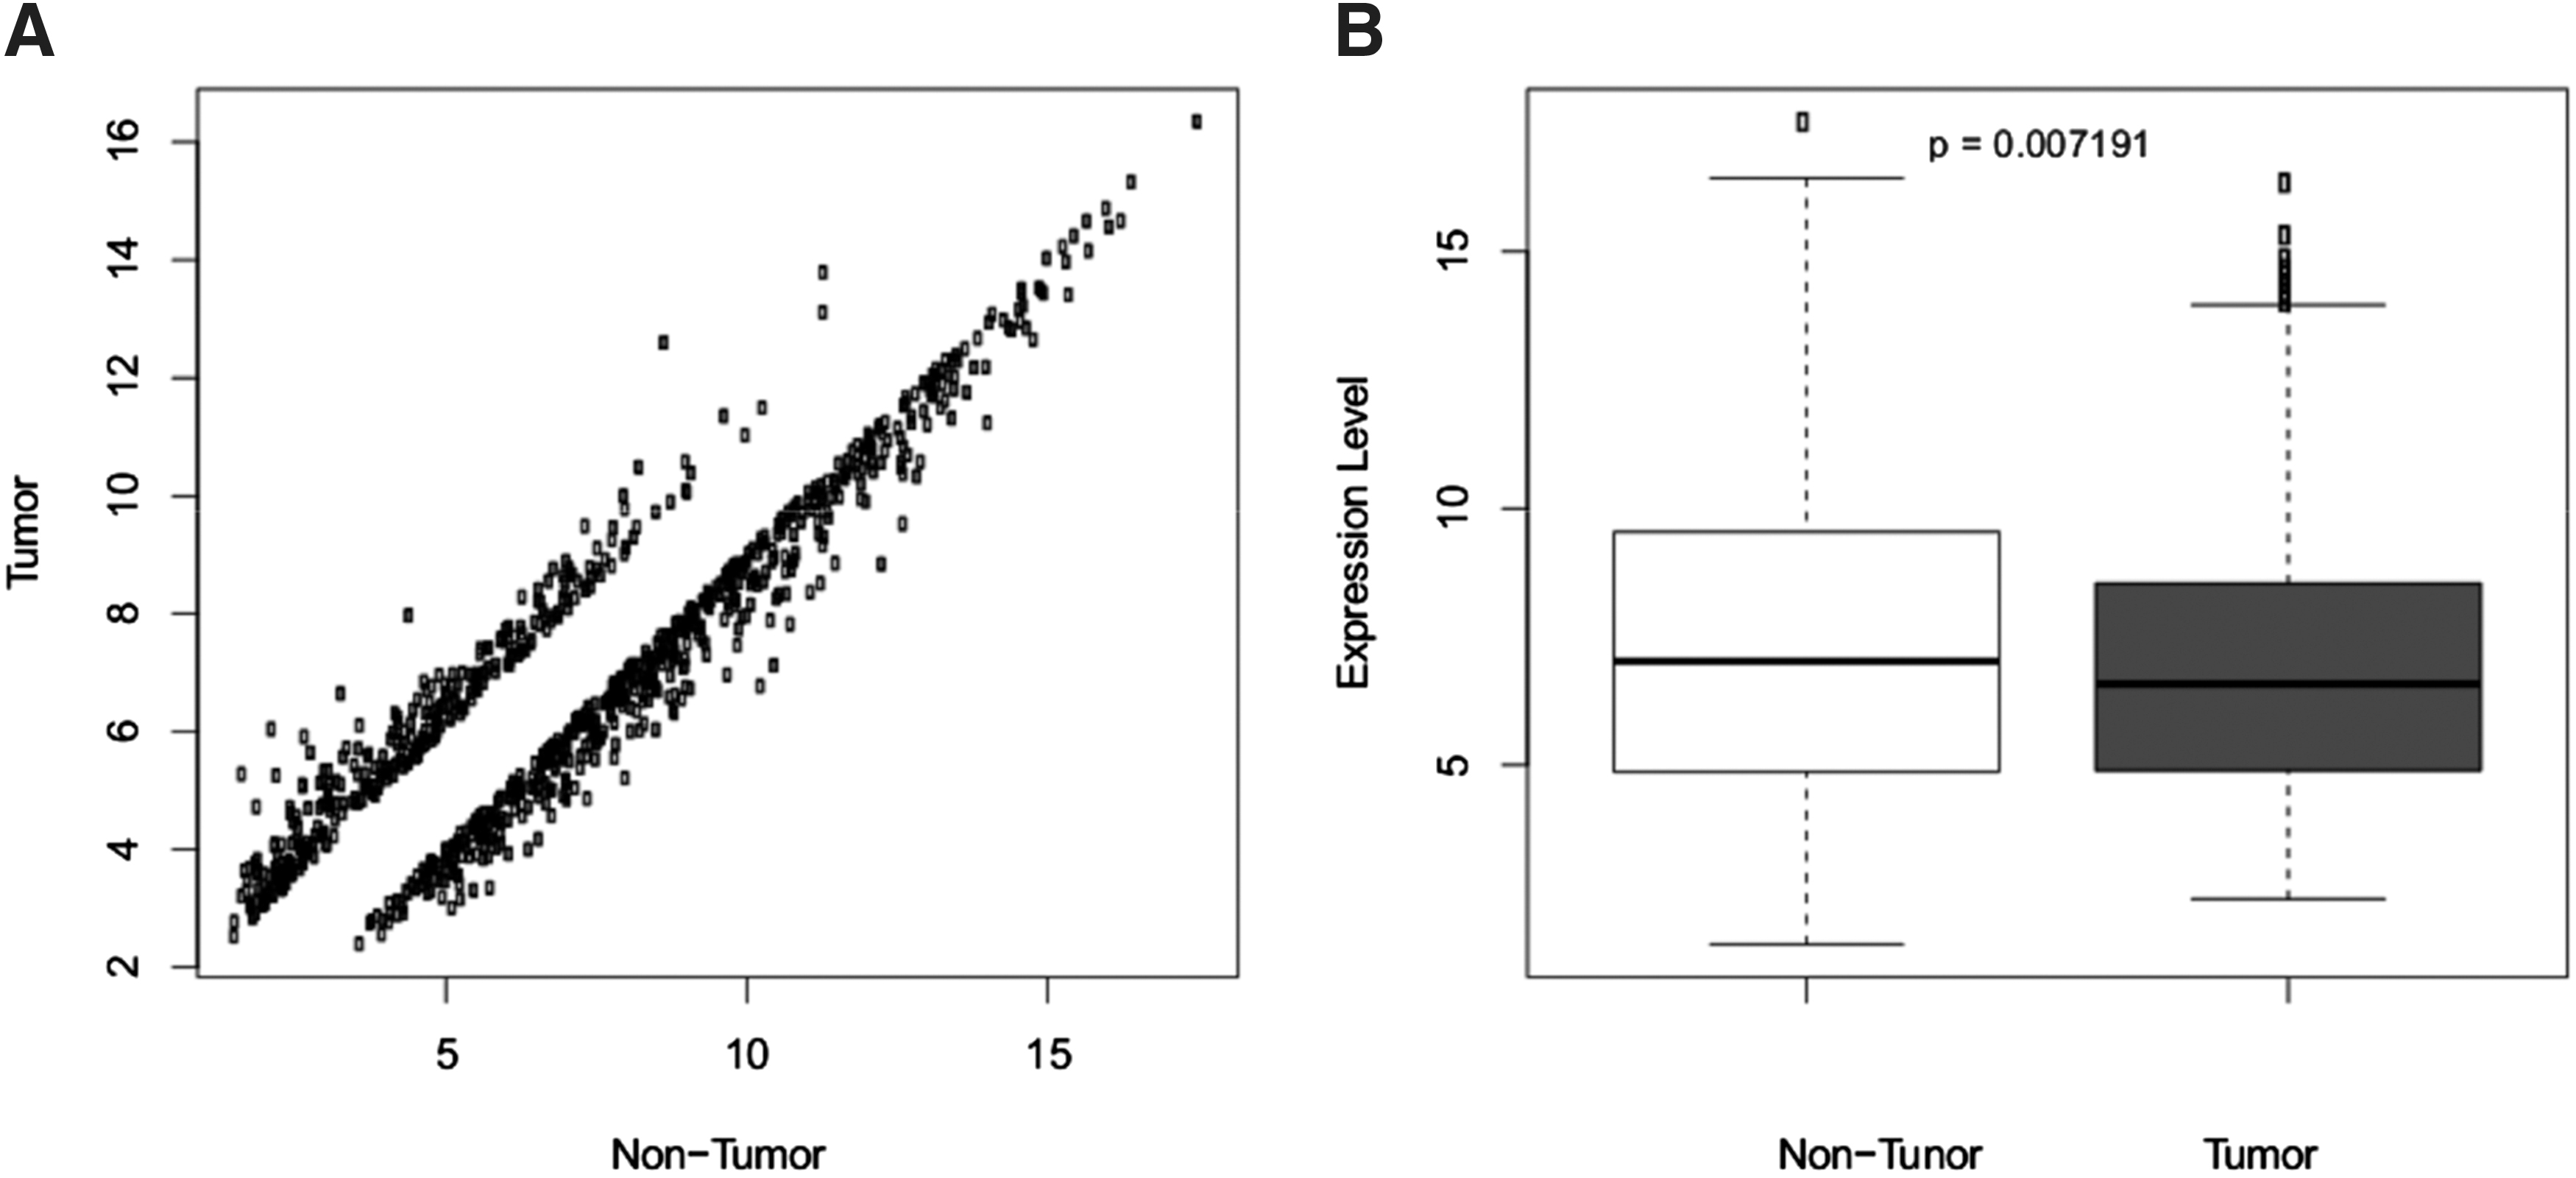
The expression of DEGs in tumor groups and nontumor groups.
3.3. Enriched functions and pathways by the DEGs
As a result, the 313 genes that were upregulated in tumors were mainly enriched in functions involved in cell cycle-related terms such as cell cycle phase (p = 1.24E-38, e.g., cell division cycle associated 5 [CDCA5], microtubule nucleation factor [TPX2]); M phase (p = 1.33E-38, e.g., CDCA5, TPX2; Table 2 and Supplementary Table S1). In contrast, the 427 downregulated genes were significantly enriched in the adhesion-related functions such as cell adhesion (p = 1.89E-05); biological adhesion (p = 1.94E-05), metabolic-related process (cellular amino acid derivative metabolic process [p = 1.59E-05]; organic acid catabolic process [p = 0.005054]), and immune-related categories (e.g., acute inflammatory response [p = 1.71E-04]; immune response [p = 0.004005]; Table 2 and Supplementary Table S1).
Functional Enrichment for the Differentially Expressed Genes (Top 10)
FDR, false discovery rate; GO, gene ontology.
3.4. Construction of co-expression network
Based on the formula, a co-expression network containing 46 nodes and 190 co-expression relationship pairs was established. Among them, CDCA5, kinesin family member 4A (KIF4A), and TPX2 were regulated by forkhead box M1 (FOXM1), a liver cancer-related gene. CDCA5 interacted with TPX2, baculoviral IAP repeat containing 5 (BIRC5) and kinesin family member 2C (KIF2C) with PCC >0.8. KIF4A also had coregulated relationships with KIF2, BIRC5, and TPX2. metallothionein 1E (MT1E) played important roles by interacting with MT1H and MT1F (Fig. 2 and Supplementary Table S2).
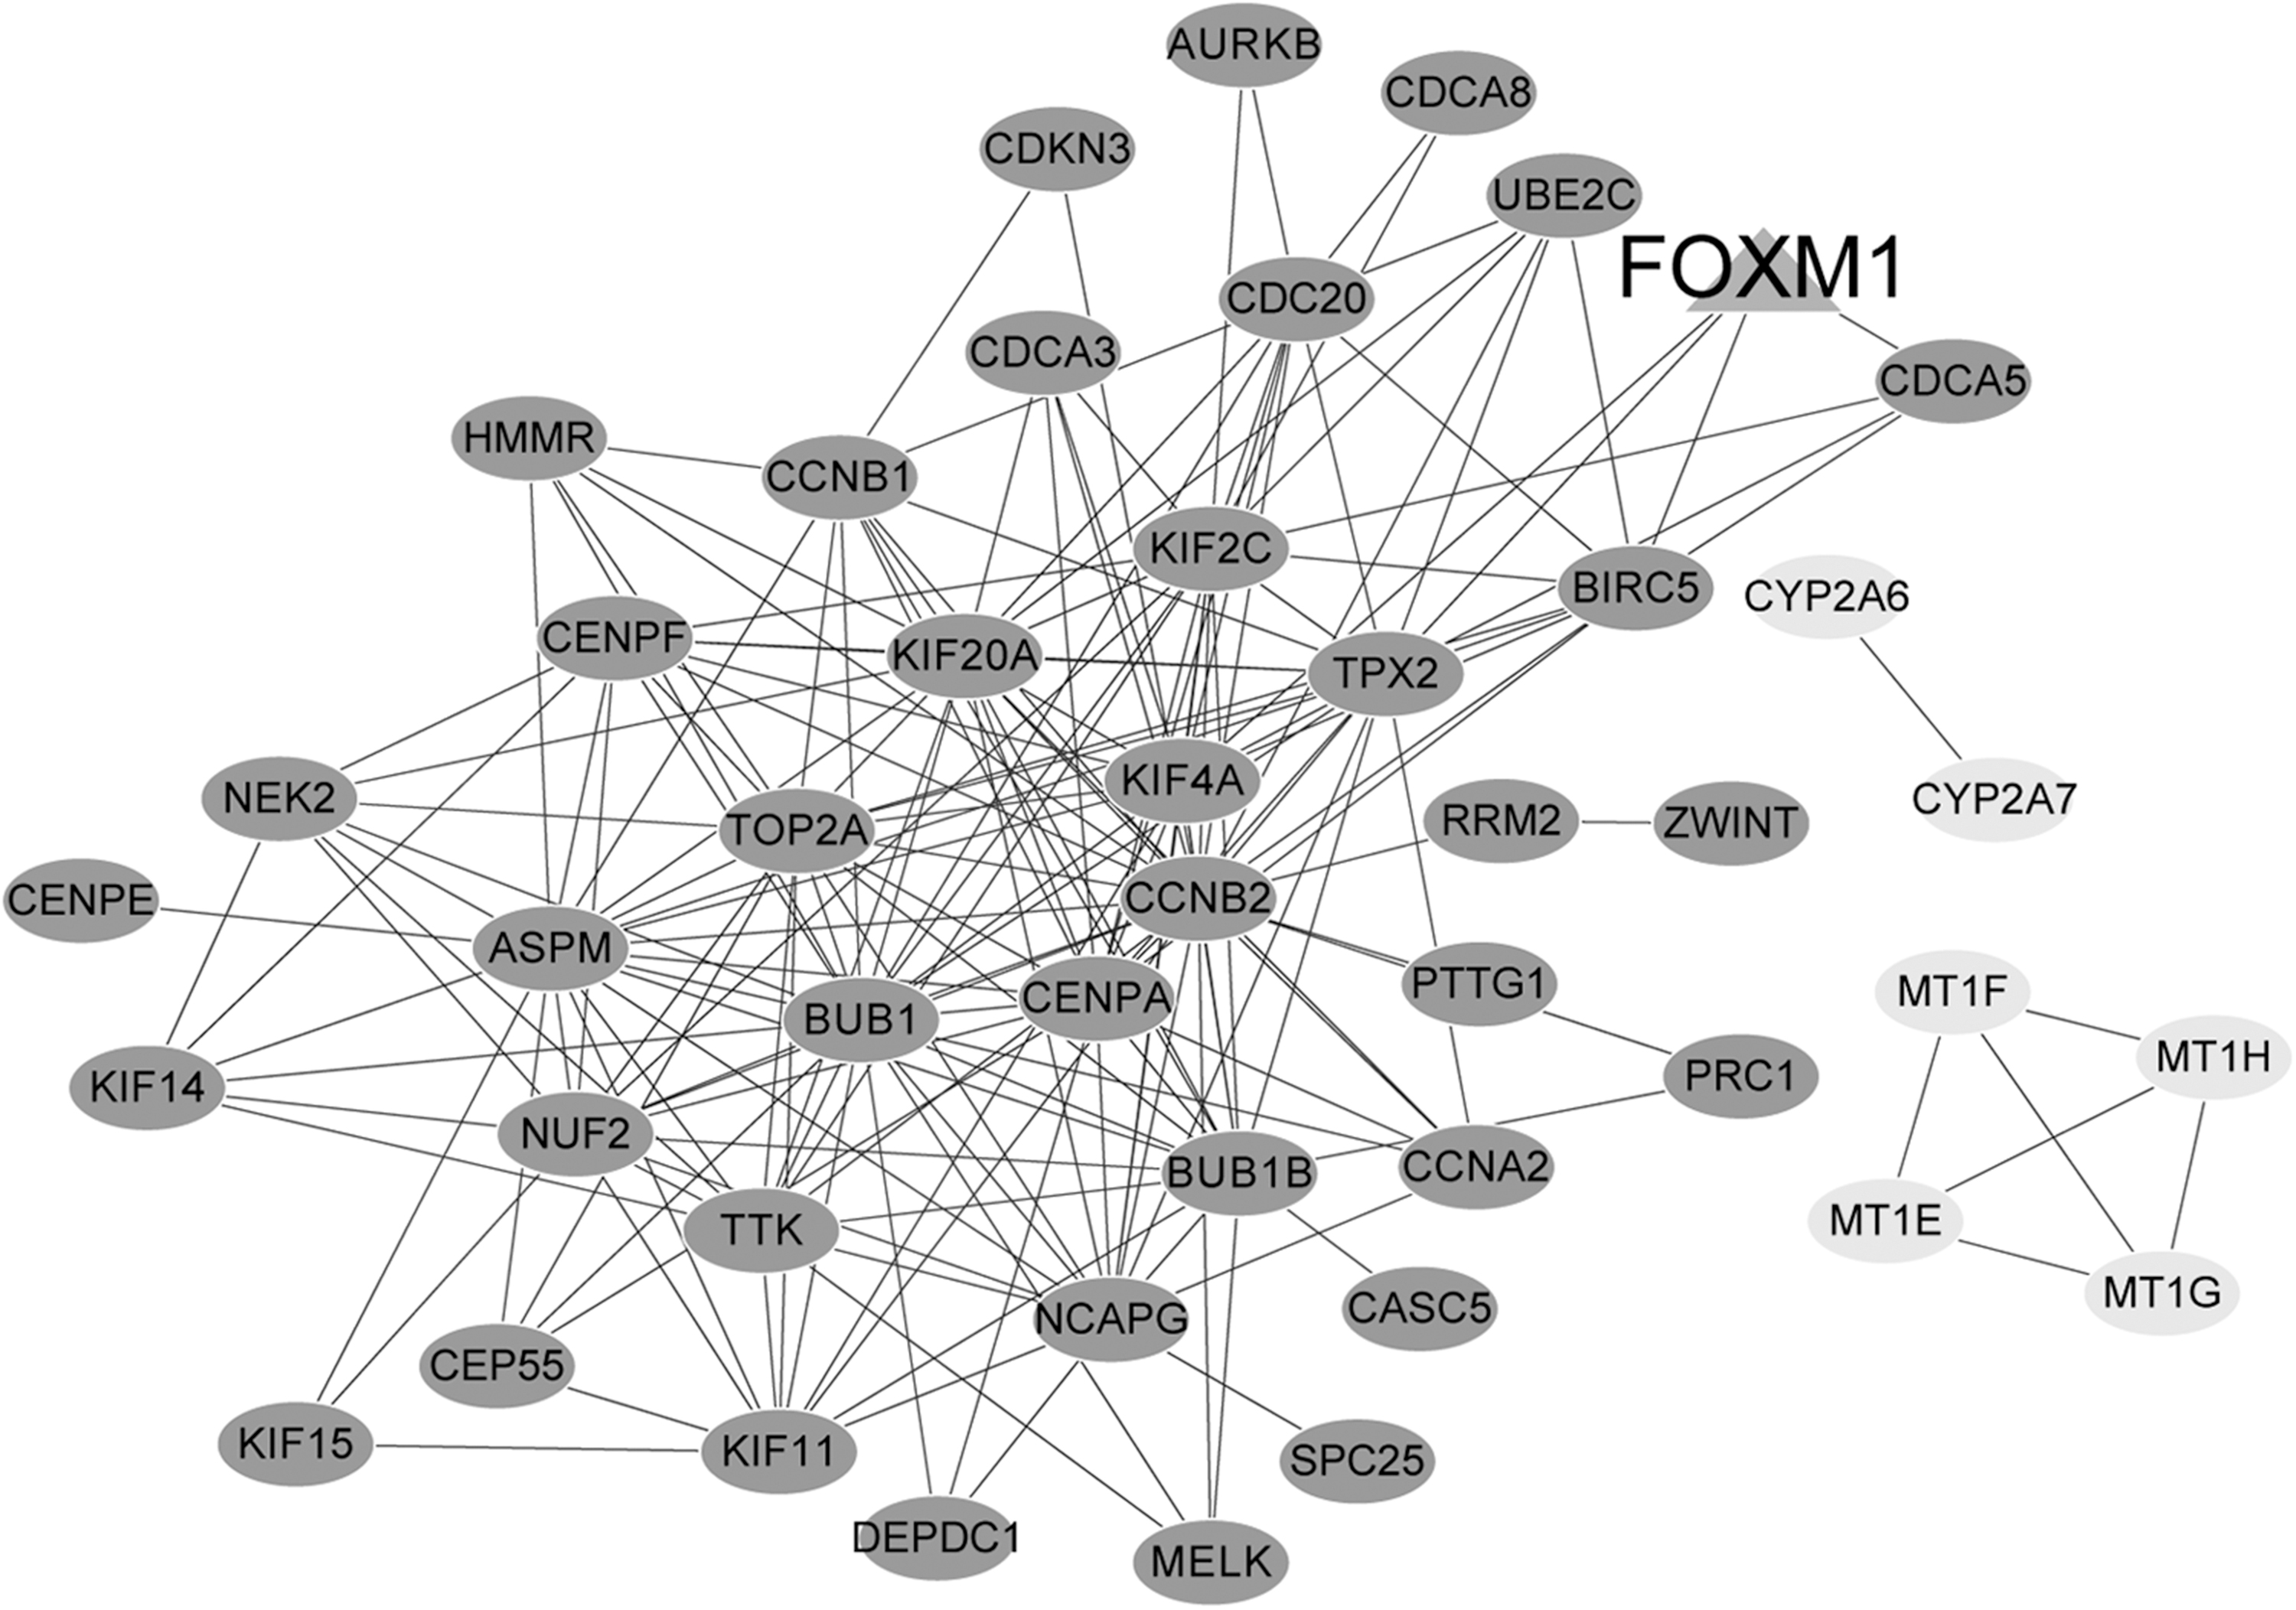
Co-expression network of DEGs. The dark grey nodes represent the upregulated genes, and the light grey nodes represent the downregulated genes. The triangular node is the gene associated with hepatocellular carcinoma in database.
3.5. Analysis of co-expression network module
A total of two modules were identified based on the screening conditions (Fig. 3). Module 1 contained 34 nodes (e.g., CDCA5, KIF4A and TPX2) and 177 interacted relationship pairs (Fig. 3A). Besides, the liver cancer-related gene, FOXM1, was included in module 1. Furthermore, all the genes in the module 1 were upregulated genes and were involved in cell cycle (p = 2.16E-09) and mitotic cell cycle (p = 2.19E-32; Table 3). Totally, four genes (e.g., MT1E) and six interacted relationship pairs were included in module 2 (Fig. 3B), and the genes in module 2 were mainly enriched in cellular response to zinc ion (p = 4.31E-11) in biological processes (BPs) and mineral absorption (p = 1.09E-07; Table 3).
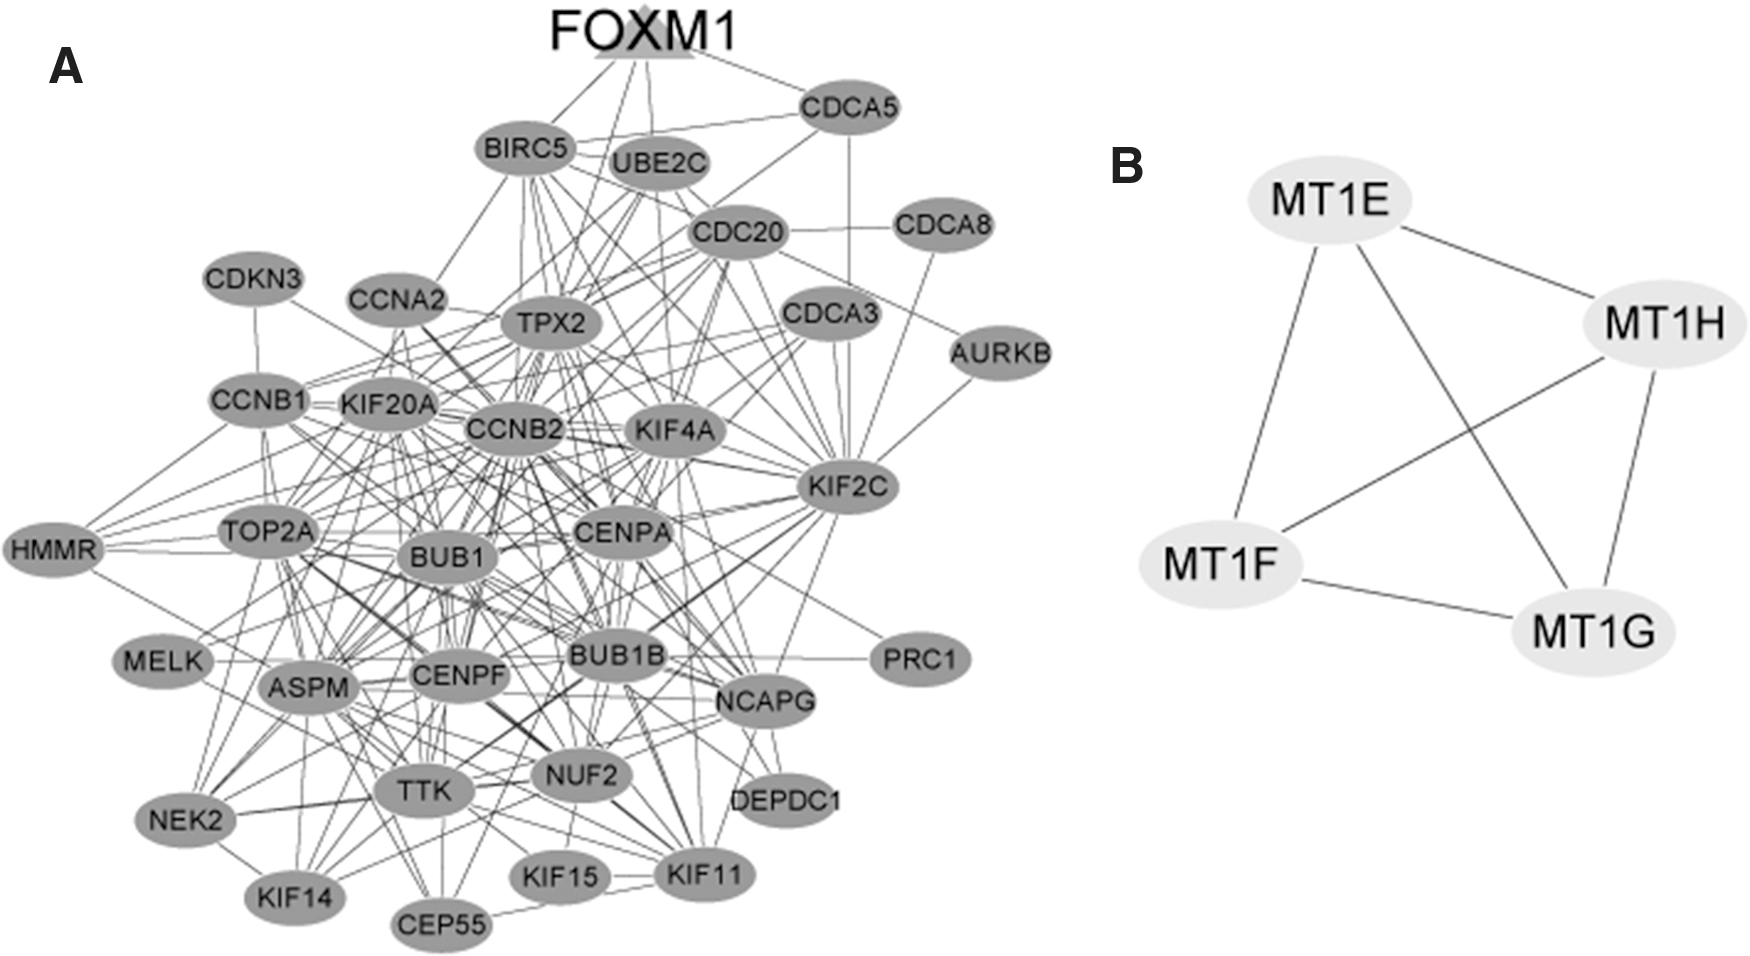
Module 1
Functional and Kyoto Encyclopedia of Genes and Genomes Pathway Enrichment of Module Genes
BP, biological process; KEGG, Kyoto Encyclopedia of Genes and Genomes.
3.6. CDCA5, KIF4A, TPX2, and MT1E expression
The RT-PCR results revealed that the expression level of CDCA5, KIF4A, and TPX2 were clearly enhanced in human HCC Huh6 cells compared with that in normal liver L-O2 cells, whereas the expression level of MT1E was notably reduced (Fig. 4).
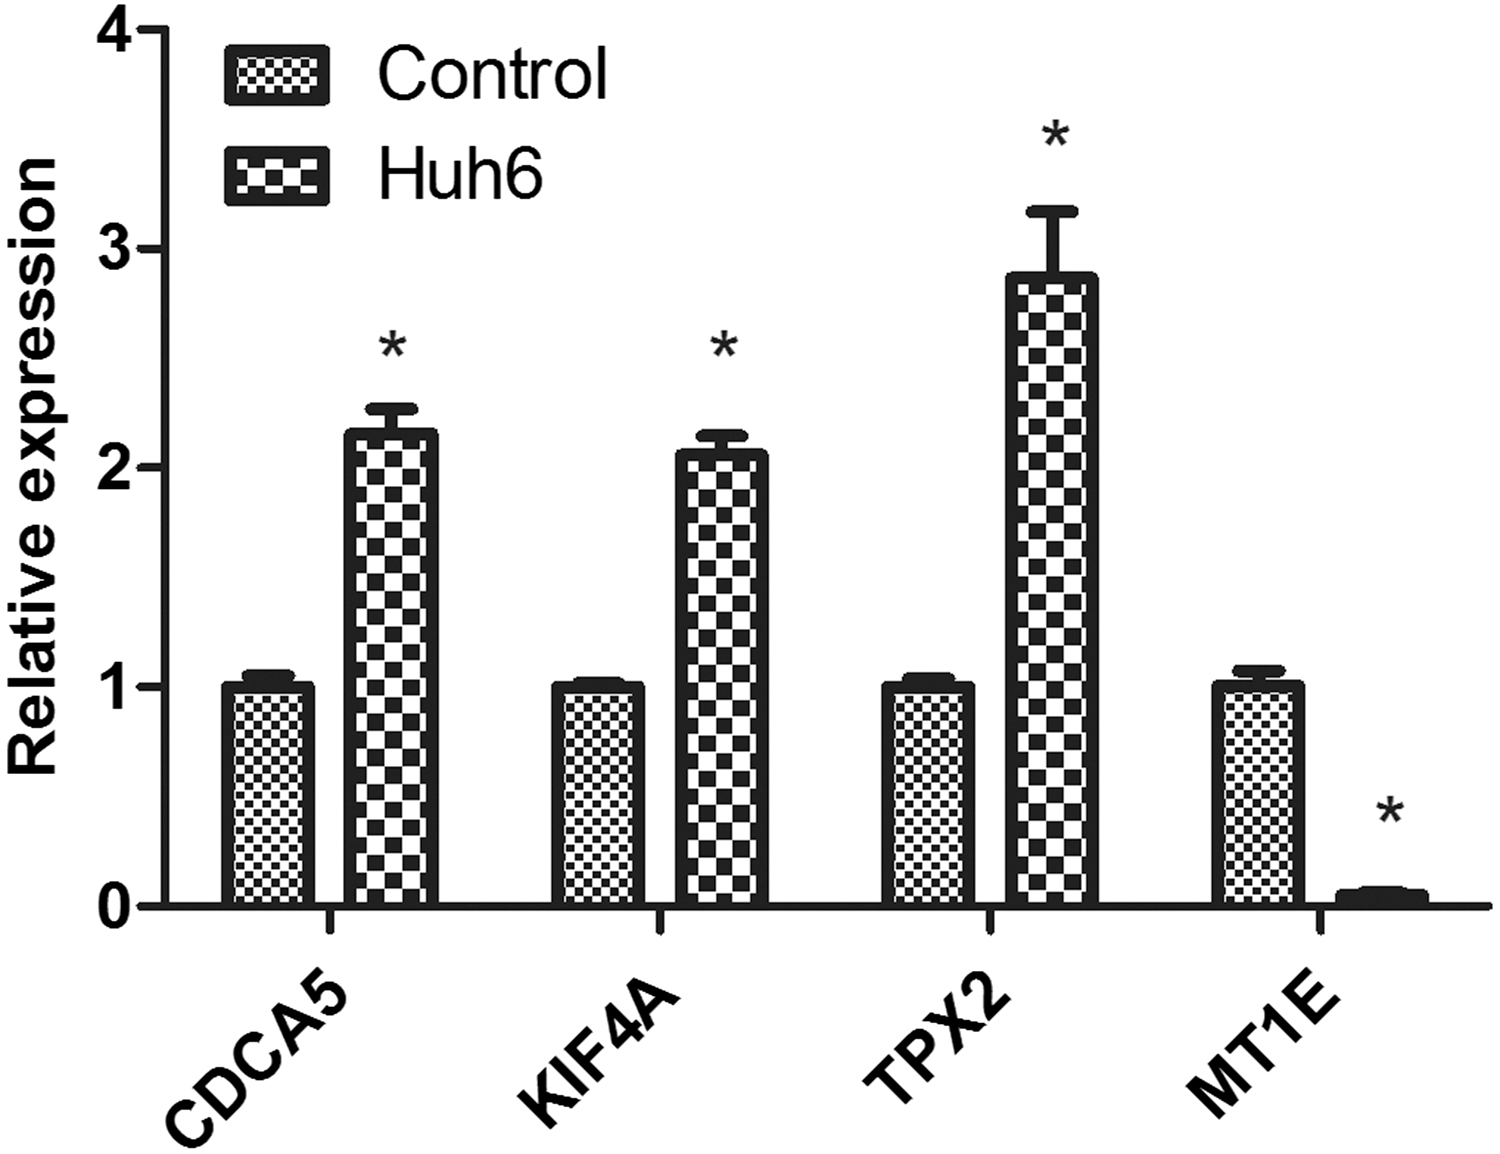
Expression levels of CDCA5, KIF4A, TPX2, and MT1E in normal liver cells (control) and hepatocellular carcinoma cells (Huh6) using RT-qPCR. *p < 0.05. CDCA5, cell division cycle associated 5; KIF4A, kinesin family member 4A; MT1E, metallothionein 1E; RT-qPCR, real-time quantitative polymerase chain reaction.
3.7. Survival analysis
The results of survival analysis showed that the high expression of CDCA5, KIF4A, and TPX2 were obviously related to poor prognosis and survival (Fig. 5), suggesting that CDCA5, KIF4A, and TPX2 might be indicators to predict prognosis in HCC.
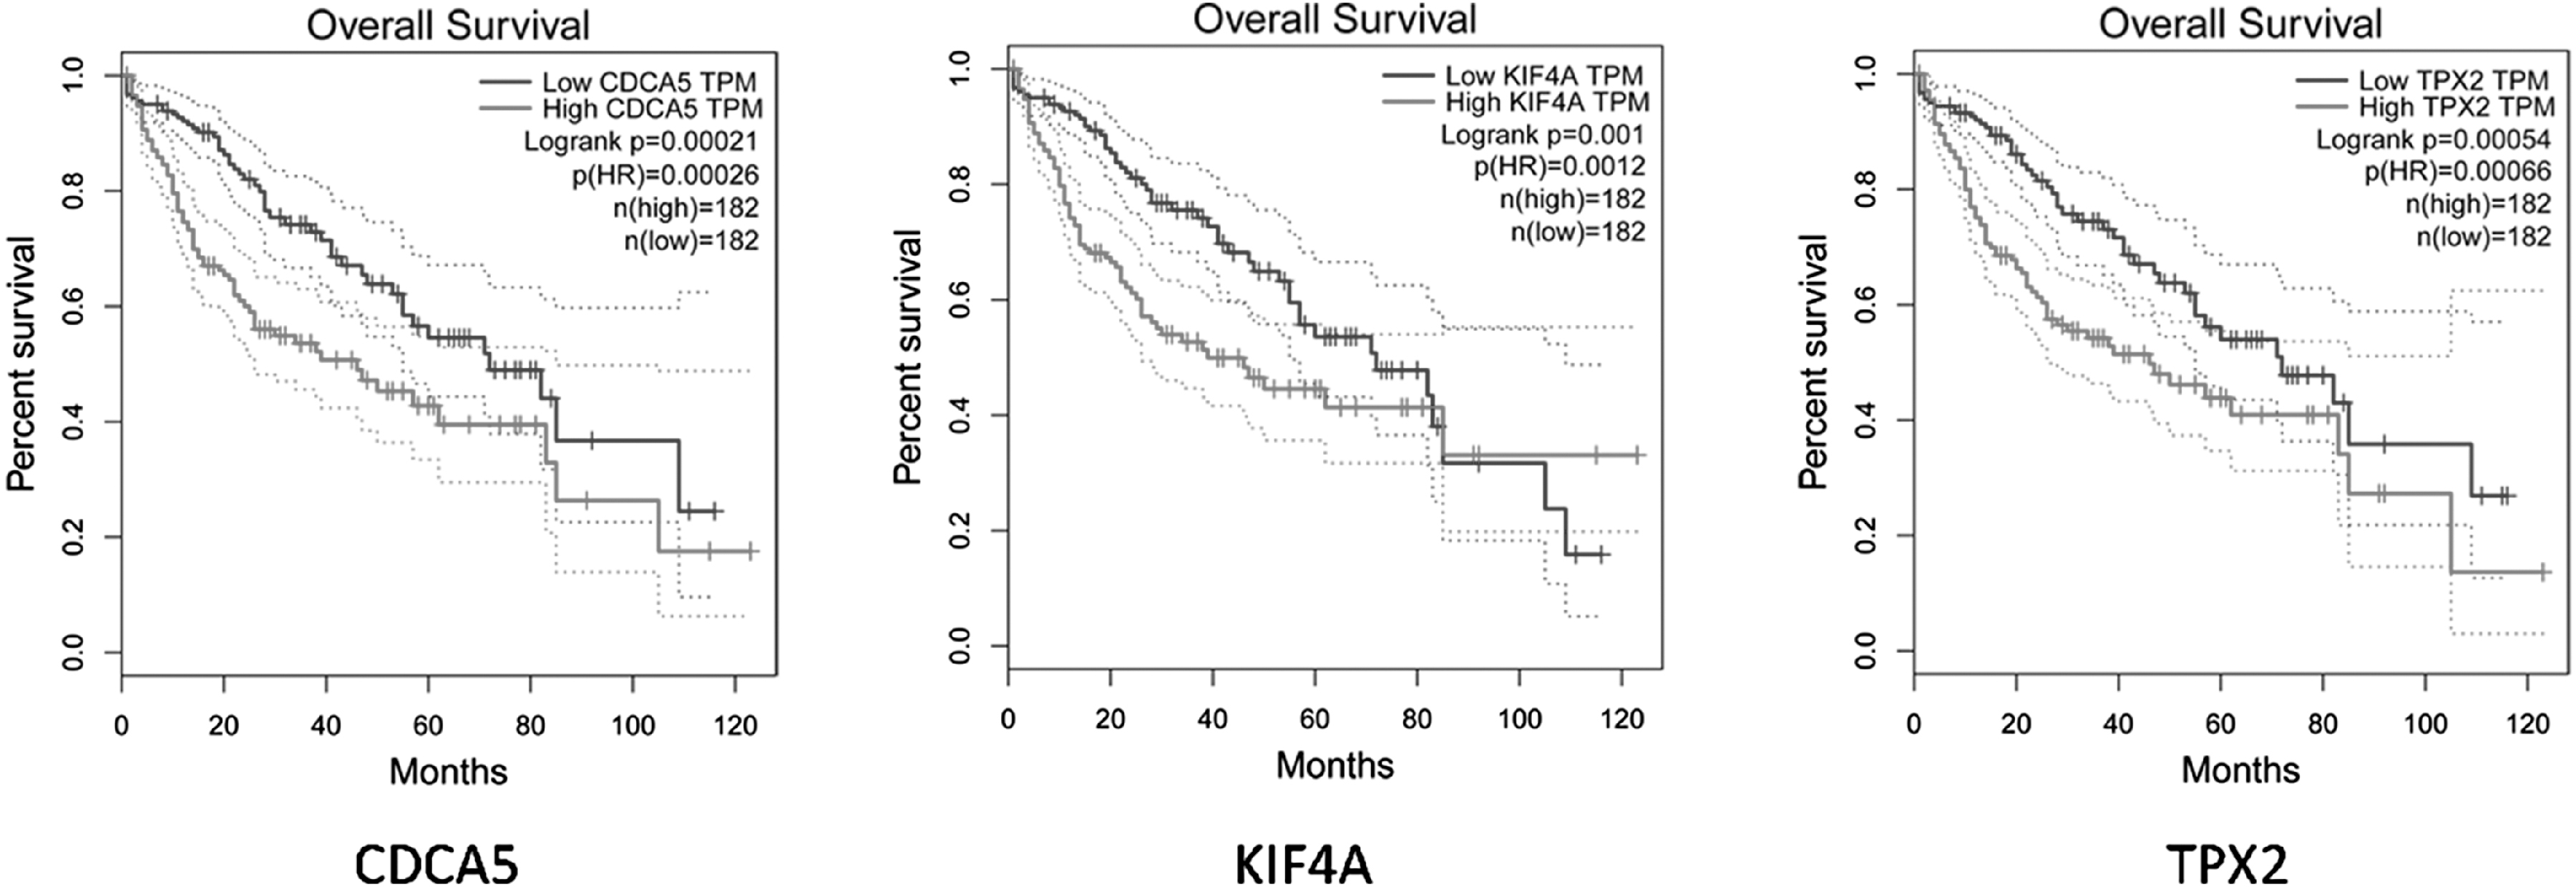
The results of survival analysis.
4. Discussion
This study aimed to identify key functional modules and genes in the functional module involved in HCC development, our finding may be conducive to the construction of new markers for HCC recognition and new targets for HCC treatment. Our results revealed that CDCA5, KIF4A, and TPX2 were obviously upregulated genes, which were consistent with previous research (Tanaka et al., 2010; Ho et al., 2015) and MT1E was downregulated gene in the tumor liver tissues compared with nontumor samples. Besides, they had interacting relationship and played important roles in HCC development by interrelating with HCC-related gene, FOXM1. Furthermore, CDCA5, KIF4A, TPX2, and FOXM1 obviously enriched in cell cycle-related functional module, whereas MT1E enriched in mineral absorption module in Kyoto Encyclopedia of Genes and Genomes.
The pathogenesis of HCC includes activation of proto-oncogene, inactivation of tumor suppressor gene, abnormal expression of related genes, abnormal cell proliferation, and apoptosis (Nguyen et al., 2010; Hoshida et al., 2012). CDCA5, a matrix for the APC, is a regulator of sister chromosome cohesion. CDCA5 promotes stable binding of sister chromatids at the time of mitosis to regulate cell mitosis, and maintain the stability and integrity of the genome. In addition, CDCA5 maintains the cohesion of S phase or G2 phase, indicating a key molecule in tumor development (Nguyen et al., 2010). CDCA5 is reported to be deregulated in many cancers as oral squamous cell carcinoma (Tokuzen et al., 2016), urothelial carcinomas (Chang et al., 2016), lung cancer (Nguyen et al., 2010), cervical cancer (Kuo et al., 2015), prostate cancer (Hsu et al., 2011), and HCC ( Tanaka et al., 2010; Ho et al., 2015).
Another cell cycle-related gene KIF4A was also found to be upregulated in the tumor tissues, and played important roles by interacting with CDCA5. KIF4A was revealed upregulated in most samples of HCC that is consistent with our results, and the overexpression can enhance migration and proliferation ability, indicating the oncogenic effects of KIF4A (Hou et al., 2017). Previous studies have proved that KIF4A is a potential prognosis factor of breast cancer (Wang et al., 2014) and lung cancer (Taniwaki et al., 2007). During the metaphase–anaphase transition, KIF4A plays a key role in cytokinesis and midzone formation (Zhu and Jiang, 2005). Besides, KIF4A involves in DNA damage response and repair response system in early response by regulating BRCA2/Rad51 pathways (Wu et al., 2008). Furthermore, it restricts central spindle size and microtubule dynamics can be inhibited by activating KIF4A (Tanaka et al., 2010). In addition, the expression of KIF4A in liver samples can be upregulated by hepatitis B virus (Zhu et al., 2015). Overall, KIF4A can be used as a diagnostic and prognostic marker of HCC.
Our finding also suggested that TPX2, acting as a cell cycle-related gene, was targeting with KIF4A and CDCA5 to effect the development of HCC. TPX2 protein is involved in the regulation of cell cycle adjusting cell mitosis (Kufer et al., 2002). TPX2 act as a microtubule-linked protein impacting the assembly of spindle in human cells. Previous studies have reported the overexpression of TPX2 promote tumor growth and metastasis in different types of human cancers such as esophageal squamous cell carcinoma (Hsu et al., 2014), pancreatic cancer (Warner et al., 2009), cervical cancer (Jiang et al., 2014), colon cancer (Ping et al., 2013), and HCC (Huang et al., 2014). Huang et al. (2014) also demonstrate that TPX2 can be used as a novel prognostic marker for prediction of 5-year disease-free survival (DFS) and overall survival of HCC patients as well as promotes tumorigenesis and metastasis. In patients of HCC and HCC cell, TPX2 expression is associated with mesenchymal transition, proliferation, and apoptosis (Liang et al., 2015). Notably, invasion of HCC cell is suppressed by TPX2 knockdown by inhibiting MMP2 and MMP9 expression and inactivating AKT signaling (Liu et al., 2014). In this study, CDCA5, KIF4A, and TPX2 had interacting relationship with HCC-associated gene FOXM1, and they were mainly enriched in cell cycle-related functional module, demonstrating the key role in the development of HCC.
However, this study had some limitations such as the regulating relationship between these genes was not verified by experiment and in the further study we will do more clinical experiment to verify these relationship.
In conclusion, our finding revealed that upregulation of CDCA5, KIF4A, TPX2, and FOXM1 coregulated cell cycle and thereby promoted the development of HCC. Furthermore, the drugs simultaneously targeting CDCA5, KIF4A, and TPX2 might be new programs for HCC treatment.
Footnotes

References
Supplementary Material
Please find the following supplemental material available below.
For Open Access articles published under a Creative Commons License, all supplemental material carries the same license as the article it is associated with.
For non-Open Access articles published, all supplemental material carries a non-exclusive license, and permission requests for re-use of supplemental material or any part of supplemental material shall be sent directly to the copyright owner as specified in the copyright notice associated with the article.
