
Abstract
Genome-scale metabolic models have been proven to be valuable for defining cancer or to indicate the severity of cancer. However, identifying effective metabolic drug target (DT) of the active small-molecule compound is difficult to unravel and needs to be investigated. In this study, we identify effective DT for breast cancer using proposed network analysis of enzyme-centric network in the metabolic model. Our network-based analysis revealed that high degree nodes (HDNs) of enzymes are key to progression/development of cancer. These HDNs show high interconnections inside the network. It has been found that these HDNs are crucial driver nodes for effectively targeting in breast cancer metabolic network. Furthermore, based on the correlation and principal component analysis, we have shown that certain proteins play a significant role in the network and can be used as an effective DT in cancer therapeutics. In addition, these proteins stimulate the active site of enzymes to activate the target metabolites. Overall, we have shown that a better understanding of the metabolic networks using statistical model could be valuable in DT identification for developing effective therapeutic approaches and personalized medicine.
1. Introduction
Cancer cells typically allow normal cells to survive and overproliferate as tumor cells (Vazquez et al., 2016) and to influence this process it always activates and enhances their metabolic pathways (DeBerardinis and Chandel, 2016; Vazquez et al., 2016). In cancer, the enzymes often inactivate mutations of protein encoding, which accumulate metabolites affecting signaling and cancer-related phenotypes (DeBerardinis and Chandel, 2016). For instance, the mutation in tumor cells very frequently increases signaling of the PI3K-AKT-mTOR network (DeBerardinis and Chandel, 2016) and allows tumor suppressor and oncogene activation. The alteration in the PI3K-AKT-mTOR network activates the driver set of cancers (Yuan and Cantley, 2008). Furthermore, the increase of expression level of multiple proteins in MYC pathways causes anabolic growth, serine metabolism, and mitochondrial metabolism and promotes tumorigenicity (Stine et al., 2015). In addition, p53 transcription factor, which is used as tumor suppressor, also regulates metabolism and oxidative stress (DeBerardinis and Chandel, 2016).
A recent analysis of expression data in many cancers illustrates activation of various metabolic pathways in cancer (Hu et al., 2013), and this further upregulates biosynthesis and certain nutrients such as glycine and glutamine (Jain et al., 2012; Son et al., 2013). These examples show that to comprehensively understand the regulation of metabolic networks, we have to understand the communication pattern of different interconnected metabolites and enzymes in various metabolic pathways (DeBerardinis and Chandel, 2016). A network based analysis of cancer metabolic pathways can allow identification of key features during the molecular alterations in cancer cell lines.
Complex diseases appear due to mutations and alterations in various proteins, genes, metabolites, and macromolecules. Specially, in various diseases, metabolites are in the center of association and interconnected through multiple disease related pathways, common intermediates, and multiple cofactors (Metallo and Vander Heiden, 2013), which alter one to multiple metabolites and lead to downstream effects on various coregulated pathways (Braun et al., 2008). Also fluxes within metabolic network increase the concentration of one metabolite and influence the several fluxes across multiple reactions and lead to distinct phenotypes and diseases (Burgard et al., 2004). Most of the connections to the different linked diseases are mediated by diverse connections in the metabolic network. Uncovering these disease-specific pathways is not only essential to define the complex molecular mechanism but also describes an interaction map of dysfunctional metabolic pathways, which contribute to disease (Braun et al., 2008). Thus, these examples depict that a network approach could be appealing toward disease analysis and provide significant new insights for in vivo therapeutic targets.
In addition, network approach can be very best fit to target a metabolic enzyme inside a/multi deregulated pathway specifically and also target entire disease modules instead of individual elements (Braun et al., 2008). Therefore, multitarget drug therapeutic approach inhibits multiple metabolic pathways and viable combinatorial target for therapies against oncogenes. Furthermore, this paves a new way to find a key target for cancer therapy through combinatorial approach (Kanhaiya et al., 2017). However, in cancer, the relationship between tumor-initiating metabolism and drug-target (DT) is still vague and needs to be investigated. It will define the strategy to target cancer-related metabolism in these cell lines and investigate more about the metabolic interaction between tumor and host. The metabolic reaction is cooperative during the overproliferation of cells within the tumor, so, therefore, it can be the best candidate for therapeutic target and tumor-specific metabolic activity (DeBerardinis and Chandel, 2016).
Network medicine approaches have revolutionized the human disease based research and have become vital tools to detect molecular mechanisms triggering the oncogenesis. It describes the interaction of biological entities causing the disease through network map. In addition, this can provide the key mechanistic insights about biochemical reactions, which are dysregulated during the biological systems during the different stages of disease (Vidal et al., 2011). Furthermore, it will allow even to look into single dysregulated metabolite at a time and distinguish the influencing biochemical factors in a far more informative way and follow these changes to design effective target intervention for disease stages (Basler et al., 2016; Kanhaiya et al., 2017). In disease some specific proteins are vital for the evolution of the disease, and main cause of cancer. In disease stage these proteins are called hubs (highly connected proteins) (Jonsson and Bates, 2006; Gonzalez and Kann, 2012) and form specific types of interactions and pathways. Importantly, these hub proteins resulted in various genetic alterations or variants and influence the connection in the metabolic networks (Stine et al., 2015). Therefore to DT these hub proteins can inhibit multiple disease causing proteins and can increase the chance of effective therapeutics (Kanhaiya et al., 2017). Some of these hub proteins are also known as Maximum Dominating Sets, which have at least one direct connection with all the nodes in the networks (Wuchty, 2014) and are influential for the dynamics of the networks.
In this article, we apply network and correlation analysis approach on breast cancer enzyme centric network (ECN) to find out effective DT proteins by mapping of cancer metabolic model. The key idea is to find the highly correlated DT proteins to respective high degree node (HDN) in network as these HDN proteins in cancer are crucial for the proliferation and occurrence of cancer. Our approach based on correlation analysis can be useful in finding of effective DT, which could be crucial to identify the driver reactions in cancer metabolism. Furthermore, our analysis based on ECN in breast cancer metabolic model shows that HDN proteins in the network are crucial for evolution of cancer and could be the effective DT in case of breast cancer. Generalizing the result for HDN approach, our correlation analysis shows that the HDN proteins have high correlation in cancer network, and certain DT proteins have strongly correlated with other HDN set of proteins in the network. We also discover that our found DT proteins are related to critical enzyme reactions, which can be used as effective DT enzyme reactions to inhibit driver reactions for oncogenesis in cancer. In addition, the functional properties of our top DT proteins illustrate that these proteins are functionally vital for the occurrence of cancer and can be used for rational DT and effective treatment in breast cancer.
2. Methods
2.1. Enzyme centric network construction for breast cancer
For our analysis, we used genome scale metabolic models (GEMs) of breast cancer. The data are retrieved from Human Metabolic Atlas website (Gatto et al., 2014). We select the breast cancer metabolic network reconstructed based on INIT algorithm (Agren et al., 2012). This is generally used for the generation of GEMs. The annotation of the presence or absence of protein targets in breast together with the high-resolution images is publicly available through the Human Protein Atlas (HPA) (www.proteinatlas.org). We used MATLAB COBRA toolbox (Schellenberger et al., 2011) to map the enzymes in the metabolic model. ECN is constructed by stoichiometric matrix (S), which is collected from importCbModel function from Cobra Toolbox (Heirendt et al., 2017). Here (S) = Metsi represents metabolites as rows, Ractj represents reactions as columns. MCN = parse Ractj with (−ve) to (+ve) vice versa, for Ractj = 1, 2, 3 … n and ECN = parse Metsi with (−ve) to (+ve) vice versa for Metsi = 1, 2, 3 … m. Directed enzyme-centric network construction is based on stoichiometric matrix. Stoichiometric matrix parsed and added an edge according to the sign change value. Furthermore, we used Cytoscape for the network visualization and topological analysis (Shannon et al., 2003). From the analysis we obtained directed ECN of 3976 nodes with 24,227 interactions.
2.2. Topological properties of the networks
The metabolic networks represented as directed network, in which metabolites and reactions are, respectively, denoted as nodes and edges or vice versa. For identifying the HDN set of nodes, the degree (k) of nodes in the networks are crucial, which are the number of connections or links to a node which has interaction with other nodes, and defines as deg(i), k(i) = |N(i)|. Where N(i) is the number of neighbors of node i. In any directed networks (i.e., metabolic and signaling networks) we have two different degrees, in-degree (kin), which denotes the incoming edges to node i, and the out-degree (kout), which denotes the outgoing edges from node i. The robustness of a network depends upon the connections between the nodes inside the network. Cluster coefficient Clu is defined as for node i, Clu = n/ki(ki − 1), where ki is the number of neighbors of i, and n denotes the number of connections/edges between these neighbors. The clustering coefficient ranges from 0 to 1, where 1 implies that the node v is in a complete subgraph, while 0 denotes that the node is part of a loosely connected cluster (a star-shaped cluster with i in the center). Betweenness centrality Btw is the fraction of shortest paths passing through node i between all pairs of nodes s and p, defined as:
2.3. High degree node approach on enzyme centric network
According to the previous study metabolic network satisfies power-law degree distribution and scale-free and small world properties (Junker and Schreiber, 2011; Asgari et al., 2013). Degree distribution of a network based on the fraction of P(k) nodes in the network having k connections to other nodes satisfies the relation P(k) k(γ), where γ is power-law parameter. HDNs are known as hubs, and thus, these hubs were considered as HDN in the network. HDN is selected based on the average out degree of the edges of the network from the following formula:
2.4. Drug target data
We obtained the DT proteins from DrugBank database (Wishart et al., 2017). It provides comprehensive information about drugs and their targets. It provides the information of chemical, pharmacological, and pharmaceutical specific drugs with their structure and pathways. For DT identifier we have obtained total 38 DT proteins in our network, which are available in DrugBank after the mapping.
2.5. Correlation network analysis
The correlation network analysis is based on pairwise correlation coefficients between two pairs of vectors of given data set (Kotze et al., 2013). In this study, nodes are proteins that refer to particular enzymes in the network, while the edges represent the correlation between the DT proteins to HDN proteins. For the construction of metabolic cancer network we collect high outdegree called (kout) enzymes and their associated genes from breast cancer metabolic network. We have used, Metabolic gEne RApid Visualizer (Shaul et al., 2015), to compare expression pattern in breast cancer cell. We used MERAV tool for generating the correlation network. We mapped the genes used in correlation network to human protein atlas (Thul and Lindskog, 2018) for further analysis. Correlation networks are constructed using GeneMANIA app through Cytoscape (Shannon et al., 2003). The hypothesis of the correlation is defined by the correlation ranges. This correlation strength is based on the rule: strong (positive [0.5–1.0], negative [−0.5 to −1.0]), Moderate (positive [0.3–0.5], negative [−0.3 to −0.5]), and Low (positive [0.1–0.3], negative [−0.1 to −0.3]). We have used Clustergrammer (Fernandez et al., 2017) web tool to generate and for visualization of correlation matrix heat map.
2.6. Principal component analysis
Principal component analysis (PCA) is a linear projection method that defines the variables of the projection space, called principal components (PCs), which are linear combinations of the original variables (Giuliani, 2017). PCs are linear combinations of the n variables, which define the system based on the formula: PC = ax1 + bx2 + cx3 + … + kxn, where X1 − Xn are experimental or observational variables that define the statistical units; the a, b, c,…k coefficients are estimated by least square optimization (Giuliani, 2017). As PCA is performed on correlation coefficients, the starting point for PCA is the data matrix constructed as a result of correlation analysis. The rows of the matrix are the DT samples, and the columns of the matrix are the correlation values of the cancer proteins. PCA represents a multivariable data table as a low-dimensional space.
3. Results
To identify DT we analyze breast cancer metabolic network using ECN (Section 2). The total number of enzymes and their interaction partners had 3976 nodes and 24,227 connections; here the nodes are the enzymes and the connections are the metabolites. Different properties of the ECN are summarized in Table 1. Similar to other biological networks, our ECN also follows the power-law distribution, which illustrates that a certain number of nodes dominate in the network and have hub-like properties and play a vital role inside the networks. Therefore, we define a set of these dominated nodes in the network as HDN and used it to identify available DT proteins, enzymes, and their reaction name, which could be useful to identify effective DT. The detailed approach is displayed in Figure 1.
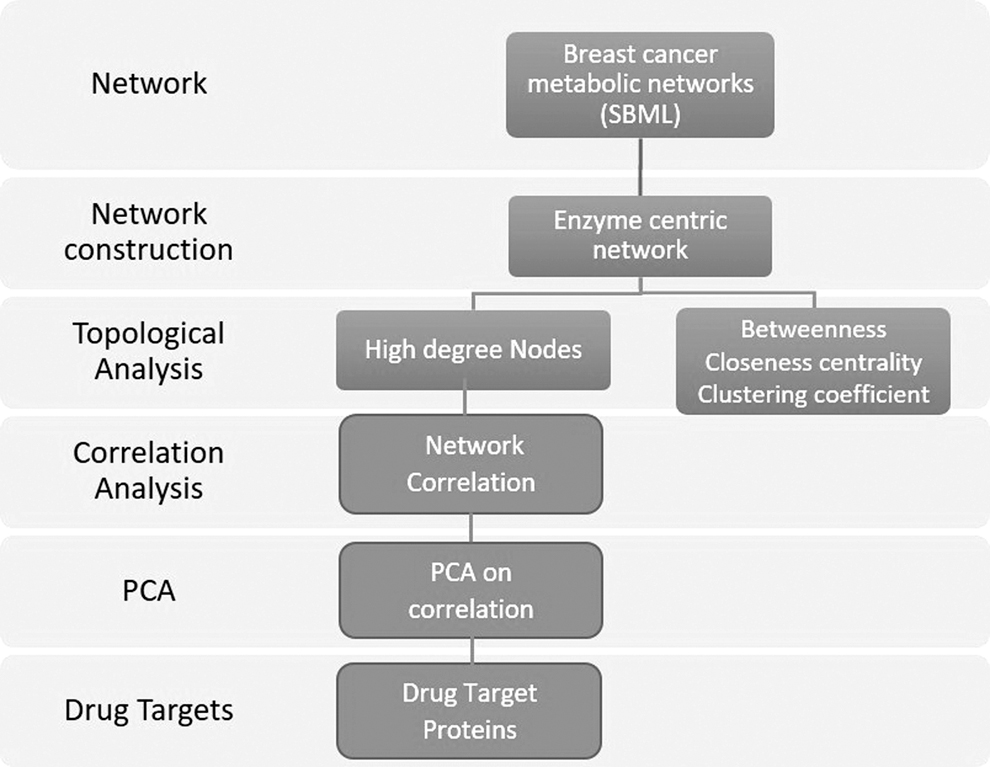
The general schema of controlling and identifying DT by our approach. First, we download the breast cancer metabolic network and generate the ECN. Based on ECN, we analyzed the topological properties of the network and define the HDN of nodes (proteins). Furthermore, we measure correlation analysis and PCA to determine the correlation between DT to target proteins. DT, drug target; ECN, enzyme centric network; HDN, high degree node; PCA, principal correlation analysis.
Network Properties of Enzyme-Centric Network
The columns represent the following information of enzyme centric cancer network: the total number of nodes in the network (Nodes), the number of connections (Edges), the average degree (Deg), the betweenness centrality (Btw), the clustering coefficient (Clu), and the closeness centrality (Clo).
ECN, enzyme centric network.
3.1. Finding high degree node in the enzyme centric networks
In a metabolic network, HDN is highly connected nodes and has the robust interactions inside the networks. Because of these characteristics, these nodes have the ability to affect all the other reactions inside the network. In the case of cancer, these reactions participate in various cell regulation processes such as signaling pathways, gene regulations, and multiple cancer related metabolism. So, using the breast cancer metabolic model, we generated ECN as described in Section 2. According to the network properties, we have selected 688 enzymes from the network as these enzymes have degree higher than the average degree of the network which is 6.09. We used these HDNs in the ECN for finding the top cancer associated proteins and mapped it to human protein atlas (Thul and Lindskog, 2018) for the further analysis. For example, reaction id HMR-0483 denotes the ensemble id ENSG00000115159. This ensemble id denotes the protein GPD2 and reaction name glycerol-3-phosphate dehydrogenase. Out of our HDN in ECN, we successfully mapped 205 proteins and also determined 38 DT proteins. The HDN set of nodes is summarized in Supplementary Table S1.
3.2. Correlation analysis of the network
Correlation analysis offers a way to investigate the statistically significant interactions in the network. In this study, nodes are proteins and edges represent interaction between two proteins based on pairwise correlation analysis. Difference in correlation exhibits the correlation between the proteins (e.g., DT proteins or HDN proteins). We did the correlation analysis between DT proteins and HDN proteins using web-based tool MERAV (Shaul et al., 2015). The type of the correlation is based on the correlation value of the data. In the metabolic cancer network, we observed that five DT proteins show maximum positive correlation with other HDN proteins inside the network. In various cancer networks, hubs are considered as a driver agent, which play essential role in evolution of cancer (Cheng et al., 2014). The interpretation of cancer network shows that strongly correlated proteins are neighbors in the network. Therefore, highly correlated DT proteins could be fast and effective DT in cancer.
Furthermore, these metabolic proteins help to identify the linked cancer pathways to our network. This further led us to selective killing of tumor cell and network mapping to identify novel DT. In addition, based on the correlated proteins in the network, we may create new subnetworks to target the cancer specific networks. In this study, we have defined the strong correlated proteins in the network, which have correlation p-value greater than 0.05. In addition, from a list of highly correlated proteins it may be possible to define the relationship between or among pathways and create a new subnetwork to target the cancer. In addition, the highly correlated pathway may be more biochemically relevant than the noncorrelated pathways and may crossover among them to affect the biochemical reactions and pathways.
Furthermore, we applied heatmap of the correlation network based on correlation matrix. Figure 2 shows the correlation between DT proteins to (HDN) proteins, which is drawn in the Clustergrammer (Fernandez et al., 2017). The color in the matrix shows the correlation between the proteins. We discovered top 5 DT proteins BMP1, ERBB2, PKM, CRAT, and AK5, which are strongly correlated to some of the HDNs. BMP1 is strongly correlated to PKM (0.70), LGMN, and PGM1 (0.55), ERBB2 is strongly correlated to AGPAT4 (0.66) and SOAT1 (0.60), AK5 is strongly correlated to CTSK (0.70) and SLC4A4 (0.70), PKM is strongly correlated with TMEM55A (0.54) and BMP1 (0.53), CRAT is strongly correlated with ALDH4A1 (0.63) and DOLK (0.51), and SCGB1D1 is strongly correlated with SLC22A4 (0.91). The correlation among the DT proteins to HDN proteins of the network is summarized in Table 2 and Figure 3. These correlations defined a function of the symmetry status of the protein functional properties, expression, and pathways. It also illustrates that these five DT proteins can be highly effective on their highly correlated HDN proteins, which may be the main driver in cancer. Functional properties of highly correlated HDN proteins are described in next part of result section.
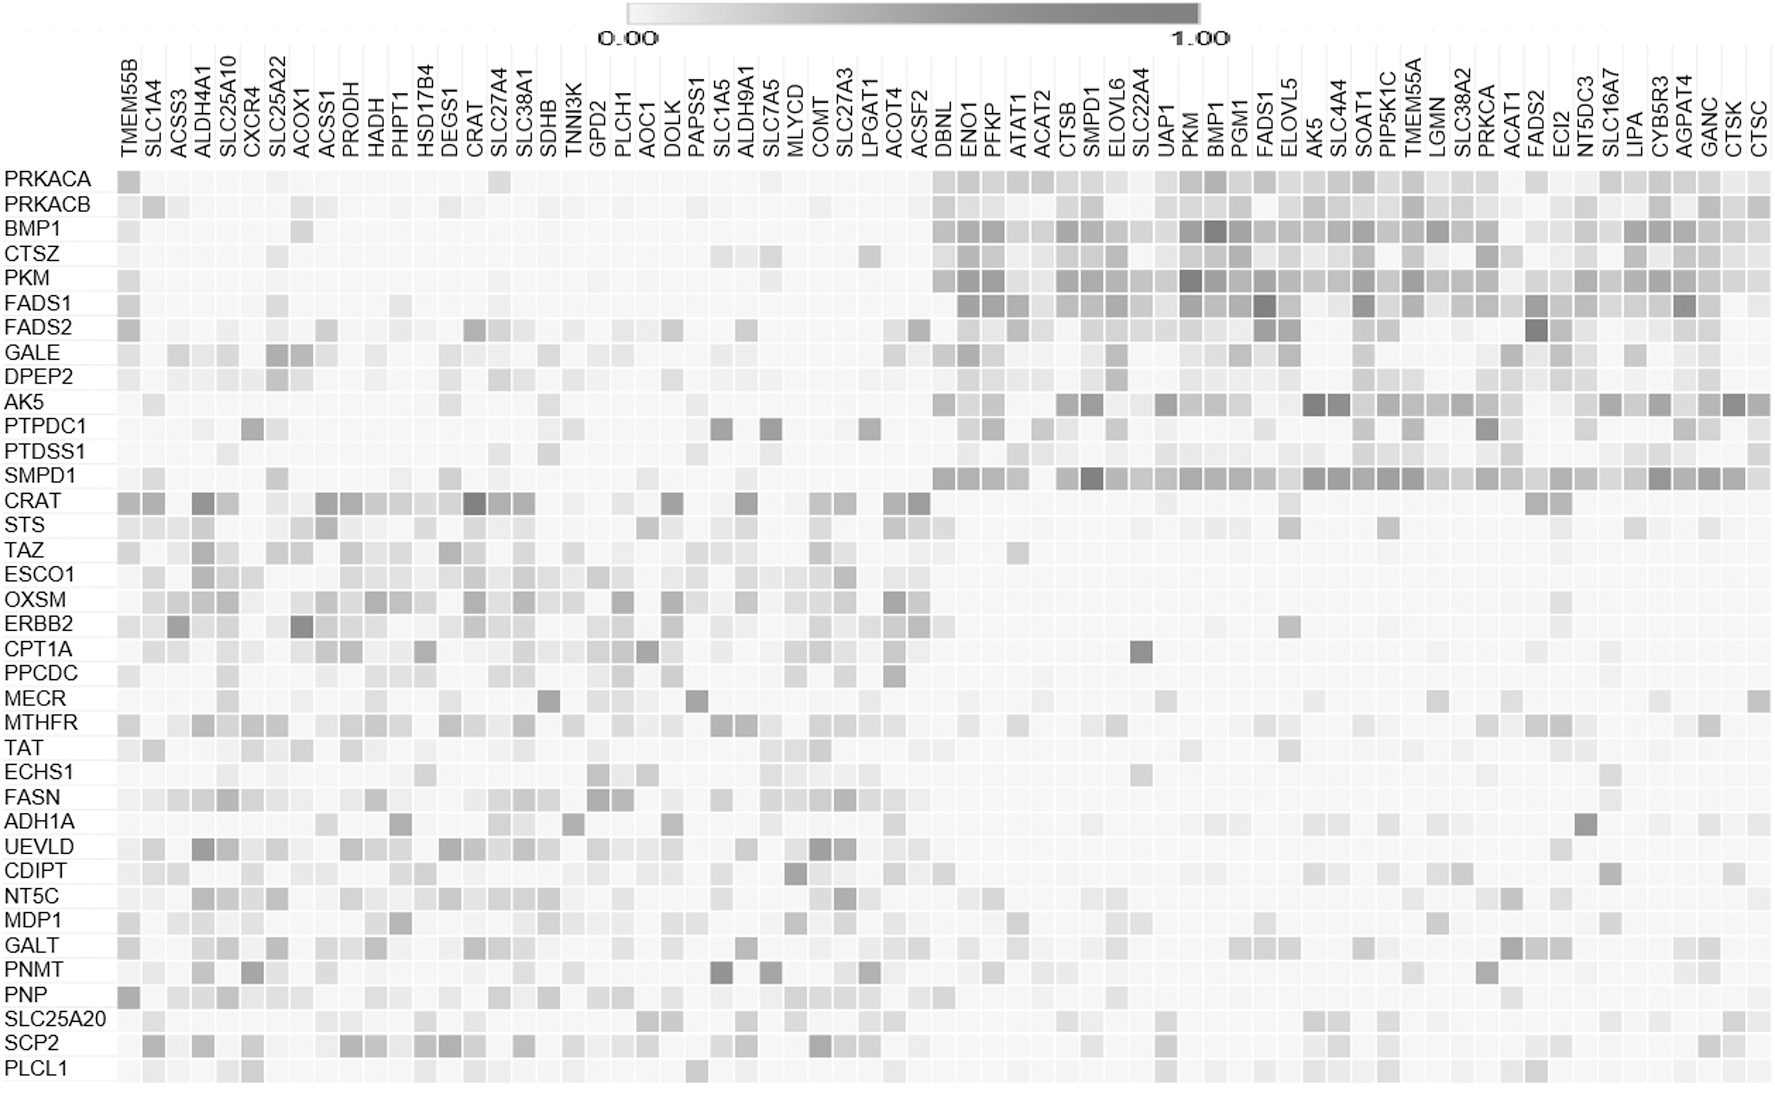
Heatmap matrix of correlation coefficient of 38 DT proteins. Heatmap shows the level of correlation between DT to available HDN proteins. A heatmap that shows the strong correlation between DT to top HDN of proteins is in dark color (p-value >0.05). Light color indicates that the corresponding DT proteins don't have a statistically significant association (low correlation).
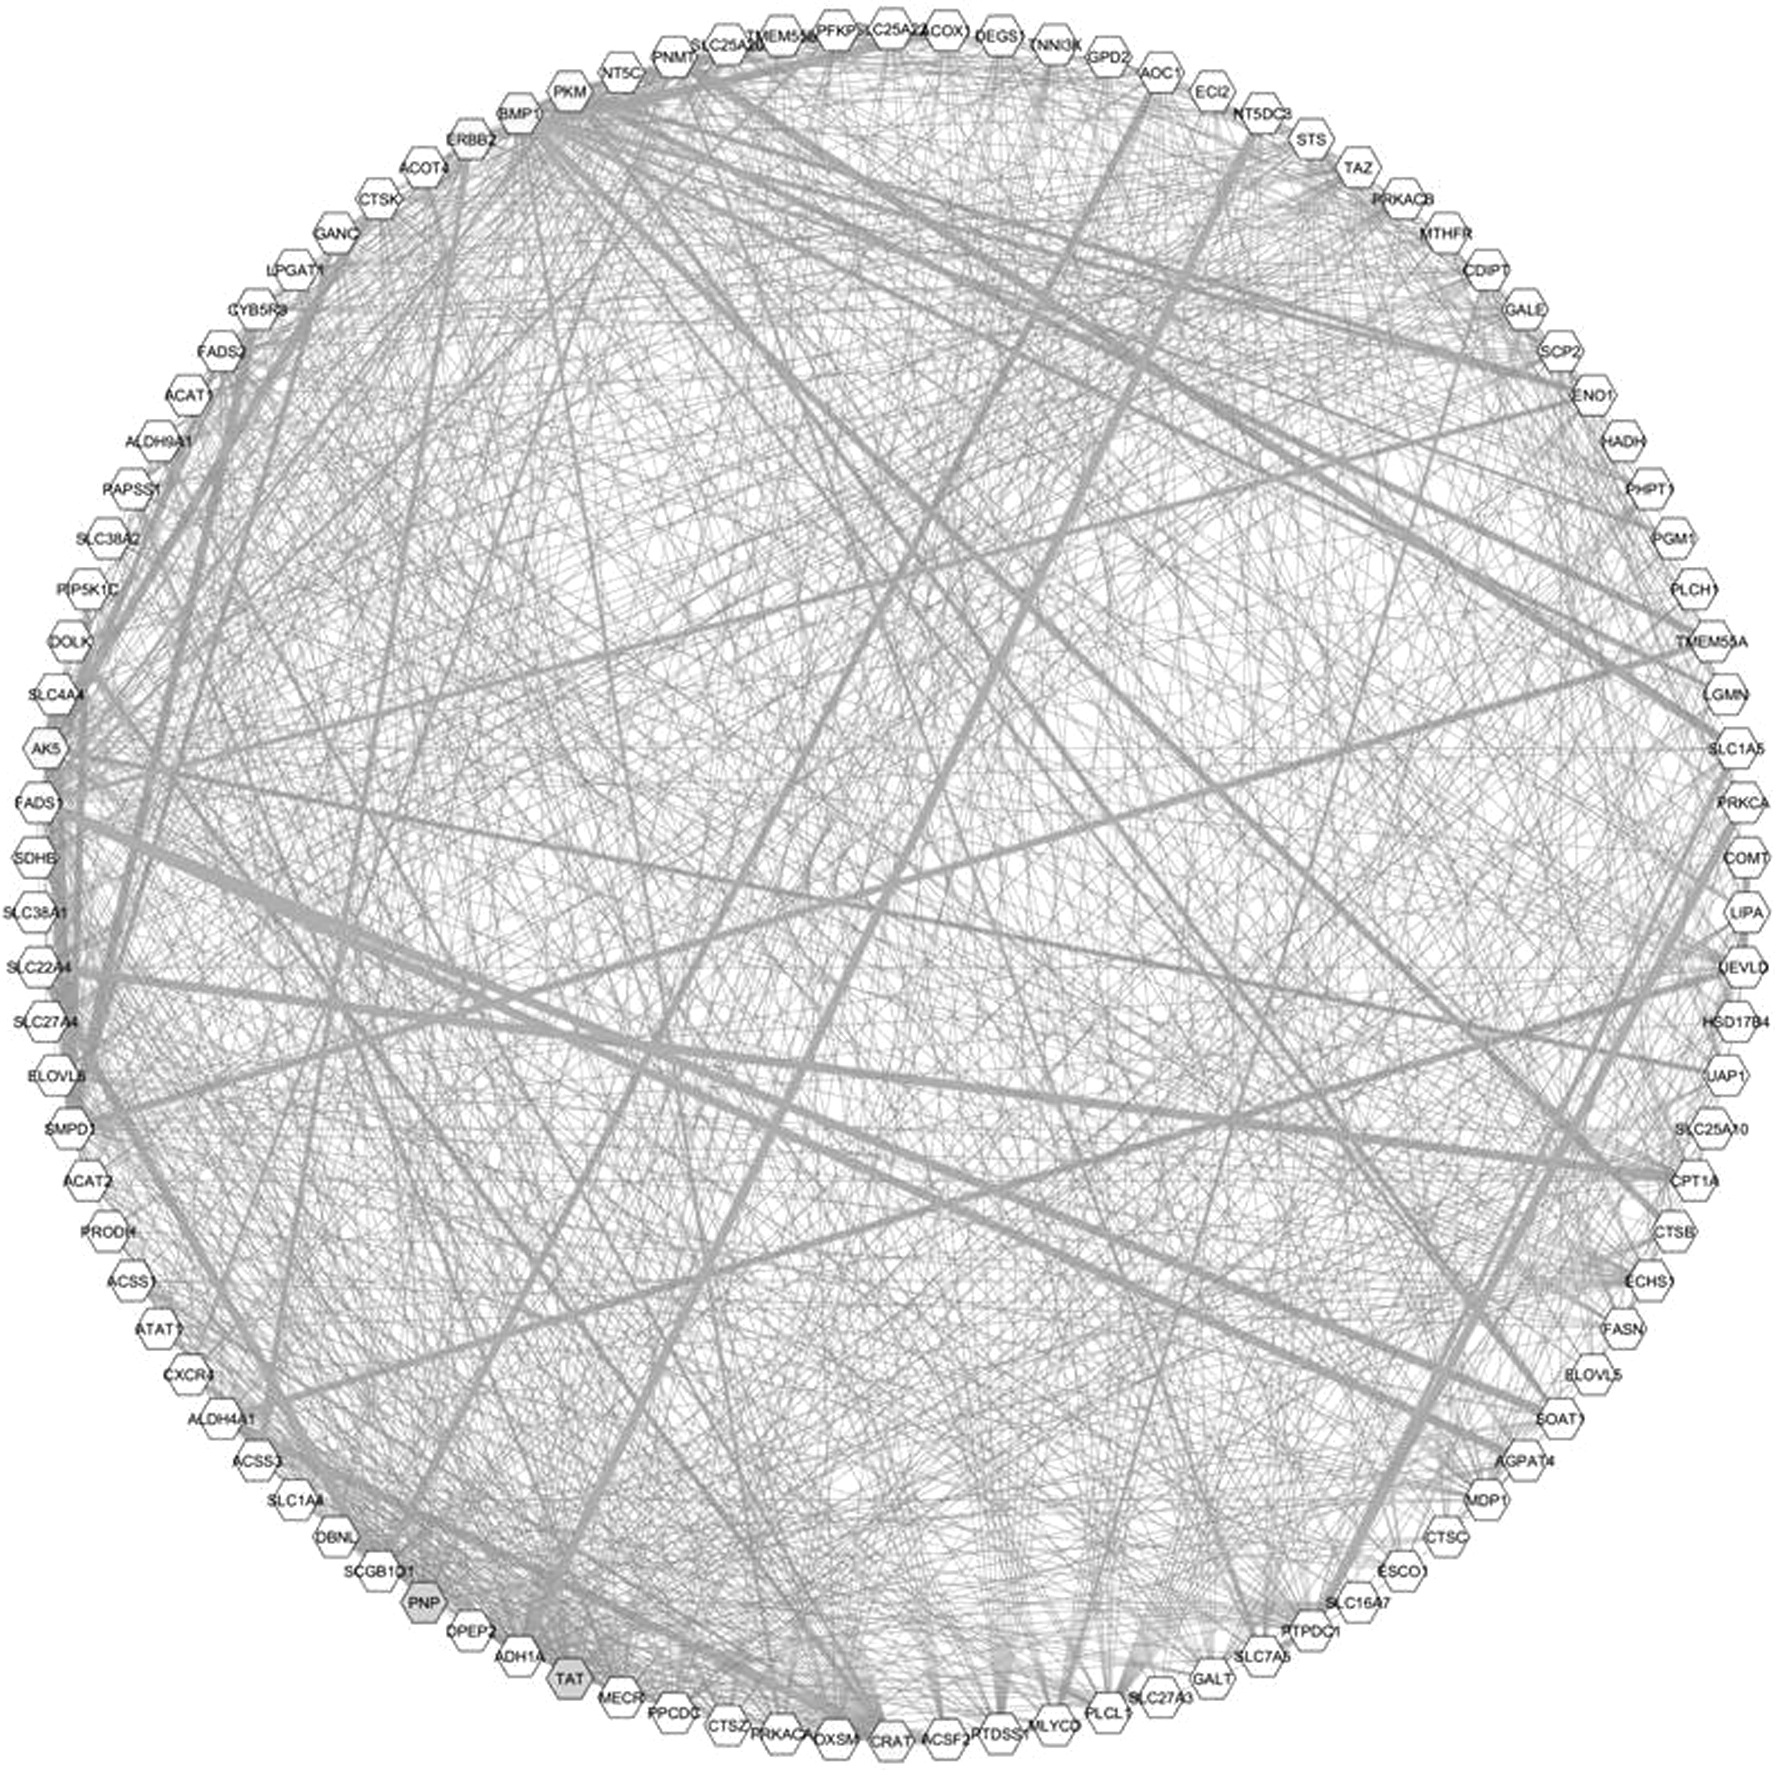
Correlation network of DT to target proteins. Shading of the lines represents the correlation type. Width of the line is proportional to the strength of the correlation.
Highly Correlated Drug Target to High Degree Node Proteins
The columns represent the DT and HDN proteins, which have the strong correlation.
DT, drug target; HDN, high degree node.
3.3. Principal component analysis
With PCA, we investigate the variation among the proteins. PCs of networks are responsible for collective modes of network dynamics; thus, PCA is one of the methods for prediction of most influencing nodes of a network. It quantitatively summarizes into a single score that is the result of candidate drugs across the network (Csermely et al., 2013; Giuliani, 2017). We have demonstrated two PCs for DT proteins from HDN protein correlation. PC approach selects the DT proteins and represents the effects of all other proteins. It explains overall variation of the data without losing the property of original data. In this study, we have used correlation matrix for observing variation among data. We have selected two PCs that explain variation in covariates, which are predictive for response proteins.
According to the Figure 4, DT proteins ERBB2 and AK5 show strong positive component value for PC1 and PC2, while DT proteins CRAT and BMP1 are strongly correlated with first PC and protein PKM is positively correlated with second PC. Red dots represented the different observations to reach the final PCs. In this study, we have observed positive correlated proteins with one or two PCs as listed in Table 4.
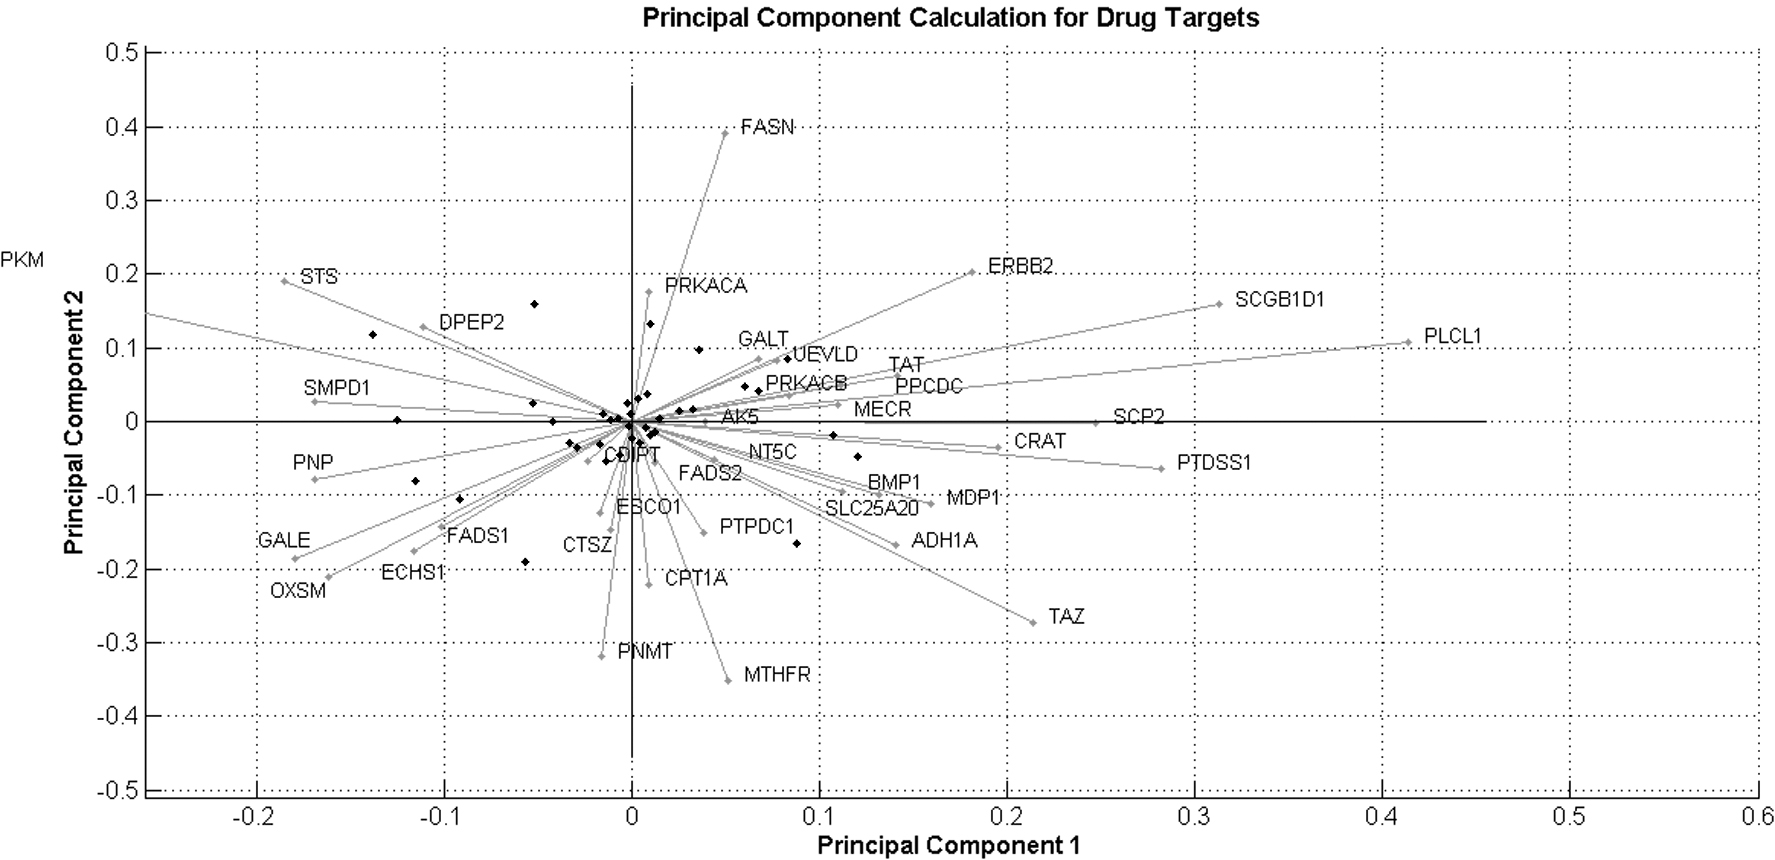
PCA of the DT proteins. PCA showing the interrelatedness and distribution of all the available DTs. PCA biplot with PC1 and PC2 distribution of DTs.
3.4. Finding driver reactions to effective drug targets
We map the top 5 DT proteins to identify DT enzyme reactions in our ECNs (Table 3). It has been well defined that some of the driver reaction is related to particular genes and proteins causing cancer (Futreal et al., 2004; Basler et al., 2016). We find that there are available cancer reactions, which are associated by our top 5 DT enzyme reactions. Remarkably, the driver reaction map by our DT proteins is also strongly associated with cancer-causing genes as our DT proteins are strongly correlated to some of the HDNs in the networks, see Figure 2, suggesting that protein identified by our approach can be an effective DT in breast cancer. In addition, we have to know about the reaction pattern of particular DT reaction to corresponding reactions and which alterations cause cancer. Also, it has been proven that some of the cancer-related reactions can be present in more than one cancer type, so in this case our found DT proteins can be used as multitarget and multicancer therapeutics.
Top 5 Drug-Target Proteins and Their EC Numbers and Reaction Name
Highly impacted DT proteins, EC numbers of enzymatic reactions, and the reaction name in breast cancer.
EC.
We find that some of our DT enzyme reactions also have robust relationship with the reactions, which are critical in tumor initiations and play vital role in cancer regulations. Therefore, inhibitions of cancer-related reactions through using our found DT enzyme reactions could be lethal in cancer, in this way we can only target cancer-related reactions and leave normal reactions unharmed. Since some of the key enzyme reactions also participate in various metabolic switches, as well as invasiveness and growth of distinct cancer, finding effective targets for these enzymes would be essential for normal cellular functions. Importantly, our approach can be useful in finding critical reactions and proteins and which (de)regulations in metabolic pathways cause oncogenesis.
3.5. Functional properties of top drug-target proteins
We reviewed the functional properties of top 5 HDN proteins, which show high correlation based on the analysis of correlation and PCA analysis and have the highest impact in identifying effective DT of cancer metabolites. The effective DTs of breast cancer are BMP1, ERBB2, AK5, PKM, and CRAT; they can also provide an important strategy for anticancer drug development. Table 4 lists the target proteins and their drugs used in different cancer therapies.
Top 5 Drug-Target Proteins for Breast Cancer
Highly impacted DT in breast cancer. The columns represent the DT, name of available anticancer drug, and known to be used in cancer therapies.
In breast cancer, BMP1 shows a significant level of expression pattern and has the inconsistent variation in transcription level in breast cancer (Nunes et al., 2017) and helps in cancer promotion and inhibition. Still, some of the roles of BMP1 in breast cancer are unpredictable (Davies et al., 2008). In addition, because of its differential expression pattern in cancer, BMP1 can be the potential therapeutic target in cancer. ERBB2 protein plays an important role in human malignancies, which is amplified or overexpressed in ∼30% of human breast cancers (Tan and Yu, 2007). Amplification of ERBB2 protein is the main cause of its overexpression in cancer, while depletion of glucose also inhibits expression of ERBB2. In addition, because of its overexpression in cancer, it's easily accessible by DT and can be a promising DT for breast cancer (Badache and Gonçalves, 2006; Awada et al., 2016). AK5 protein methylated in breast cancer causes silencing and loss of expression of other proteins (Miyamoto et al., 2005). PKM is a glycolytic enzyme that catalyzes the transfer of a phosphoryl group from phosphoenolpyruvate to ADP for generating ATP. Stimulation of POU5F1-mediated transcriptional activation plays a general role in caspase-independent cell death of tumor cells. By that, it defines glycolytic enzyme as a novel target for cancer therapy development.
4. Discussion
The systems biology approach of metabolic networks is a vital tool to study the dynamics of metabolic pathways and reactions. This further provides an insight into its physiology and can be important in the case of cancer. The metabolic network has various network properties such as scale-free nature, which certifies that the same highly connected network nodes have hub-like properties and may affiliate with key metabolites and enzymes, which are important for the biochemical reaction between/among two or more metabolites (Jeong et al., 2000). For our analysis, we have generated an enzyme-centric network to identify DT in breast cancer metabolic model. To identify DT in a complex biological network is relatively difficult, because of dynamic nature and unknown functions of various biochemical (metabolic and signaling pathways) networks. However, advancement in genome-wide association study and recent development in genetic editing technology have presented a new way to identify vital cancer-specific proteins in the network. Although many biological systems are homeostatic in nature, some internal mechanisms need to be determined. In this study, we have shown application of HDN approach for identifying DT in our network. We demonstrate how our identified DT proteins are the potential DTs to cancer-related proteins and reactions and define the drug-protein relationship of ECN in a more comprehensive way.
We analyzed the network properties of our cancer network and define a certain number of HDN proteins in the network and identify a set of effective DT proteins for effective target over cancer-related proteins inside the network. Our approach successfully identified 38 DT proteins in the network. We also found that these proteins have an average higher degree than other proteins in the network. Due to this characteristic, these proteins could have an important role in occurrence and evolution in cancer and our found DT proteins may act as an effective anticancer agent. Some of these proteins also work as a bridge in the network and are crucial in the passing of cancer-related biochemical signaling inside the cancer networks.
Furthermore, we analyzed the correlation analysis of top DT proteins with HDN proteins and significantly derived that some of the DT proteins have a very high correlation with some HDN proteins. Based on the correlation analysis, we found our top 5 DT proteins as BMP1, ERBB2, AK5, PKM, and CRAT, indicating that these proteins can be a good candidate to find an effective anticancerous drug for cancer metabolite pathways. This correlation pattern might also help to find the tumor location in the pathways. PCA shows the variation of DT proteins to target proteins. To make our computational results more predictive, we map our top 5 DT proteins in multiple cancer-related databases, and it illustrates that these DT proteins have high expression level in breast cancer, as well as other types of cancer. Therefore, correlation analysis shows the physiological state of the model and can be a novel method to generate the computational model about the regulation and identification of effective DT in cancer metabolism.
In addition, an important aspect of our approach is that it can also be used in the finding of driver reactions in cancer. We find that our DT enzyme reactions are strongly correlated to cancer-causing reactions and can be used as therapeutic targets in cancer. It has been also found out that some of these cancer-related reactions affect the intercellular reactions; therefore, our found DT can be used as multitargeted therapeutics and in multiple cancers. Hence, novel DT reactions identified by our approach can help in developing novel therapeutic targets based on tumor metabolism. Furthermore, this opens a new dimension to identify effective DT in the cancer metabolic model.
The network approach and statistical methods apply here to provide a new way to identify effective DT for metabolic network and an integrated network approach framework for network medicine. In addition, our work could be used in improving the treatment of cancer, where multiple biochemical pathways work in cooperation to proliferate the cancer cells. This, in turn, could advance a new way to the identification of biomarkers or metabolites, future studies of various biological network based identification of the effective therapeutic target, and precision medicine.
Footnotes
Acknowledgment
The authors thank Professor Ion Petre for suggestions and insightful comments.
Authors' Contributions
K.K. and D.T. conceived the approach, D.T. collected and integrated the data, K.K. and D.T. interpreted the results, and K.K. and D.T. wrote the article. All authors reviewed the article.
Author Disclosure Statement
The authors declare they have no competing financial interests.
Funding Information
This work was partially supported by the Academy of Finland through grant 272451, by the Finnish Funding Agency for Innovation through grant 1758/31/2016, and the Academy of Finland through grant 311371/2017.
References
Supplementary Material
Please find the following supplemental material available below.
For Open Access articles published under a Creative Commons License, all supplemental material carries the same license as the article it is associated with.
For non-Open Access articles published, all supplemental material carries a non-exclusive license, and permission requests for re-use of supplemental material or any part of supplemental material shall be sent directly to the copyright owner as specified in the copyright notice associated with the article.