
Abstract
RNA sequencing (RNA-seq) is widely used to study gene-, transcript-, or exon expression. To quantify the expression level, millions of short sequenced reads need to be mapped back to a reference genome or transcriptome. Read mapping makes it possible to find a location to which a read is identical or similar. Based upon this alignment, expression summaries, that is, read counts are generated. However, reads may be matched to multiple locations. Such ambiguously mapped reads are often ignored in the analysis, which is a potential loss of information and may cause bias in expression estimation. We present the general principles underlying multiread allocation and unbiased estimation of the expression level of genes, exons, or transcripts in the presence of multiple mapped reads. The underlying principles are derived from a theoretical concept that identifies important sources of information such as the number of uniquely mapped reads, the total target length, and the length of the shared target regions. We show with simulation studies that methods incorporating some or all of the aforementioned sources of information estimate the expression levels of genes, exons, and/or transcripts with a higher precision and accuracy than methods that do not use this information. We identify important sources of information that should be taken into account by methods that estimate the abundance of genes, exons, and/or transcripts to achieve good precision and accuracy.
1. Introduction
High-throughput complementary DNA (
A typical RNA-seq experiment produces millions of short reads. Mapping of these reads to the genome or transcriptome is an essential step in expression quantification. Based upon the alignment, the expression level can be estimated based on the number of reads mapping to a genomic or transcriptomic location. In practice, due to sequence similarities, sequencing errors, and hidden nucleotide variations, it may happen that a large fraction of reads [even up to 36% of all reads according to Consiglio et al. (2016)] can be aligned to more than one target (gene or transcript) (Mortazavi et al., 2008). These reads are often ignored when establishing the expression levels. However, discarding multireads may lead to underestimation of the true expression levels (Grabherr et al., 2011). To avoid introducing bias, multireads should be taken into account (Li et al., 2008a; Taub et al., 2010). The results of RNA-seq quantification may also vary depending on other factors such as the choice of the reference sequence, mapping and quantification algorithms, and read length (RL) (Li and Jiang, 2012; Robert and Watson, 2015). It has also been shown that different sources of information, such as the number of uniquely mapped reads or the reference target length, affect the quantification results as well (Li et al., 2010; Roberts and Pachter, 2013).
Several methods to handle the issue of multireads have been proposed. The simplest approach, called the unique (or naïve) assignment method (Bentley et al., 2008; Marioni et al., 2008), discards all multireads in downstream analysis such as expression estimation. Despite the fact that, as already mentioned, discarding multiple-mapped reads may bias the estimates of expression levels, this approach is often used in the analysis of RNA-seq experiments.
An alternative approach, the so-called proportional (or rescue) assignment method, assigns multireads proportionally to the uniquely mapped reads (Mortazavi et al., 2008; Hashimoto et al., 2009). It is based on the assumption that the allocation of the multireads corresponds to the distribution of the locations of the uniquely mapped reads.
Following these two methods, a number of approaches for handling mapping uncertainty have been developed. The vast majority of these methods uses the expectation–maximization (EM) algorithm to estimate expression levels (Li et al., 2010; Taub et al., 2010; Trapnell et al., 2010; Roberts and Pachter, 2013). Besides the EM framework, the cumulative assignment method (Taub et al., 2010) and a Bayesian-based method have been proposed (Ji et al., 2011). The former uses a cumulative distribution function and incorporates a score for the alignment. The latter computes the mapping probability for each multiread based on the Bayesian model.
In this article, we present general principles of target expression estimation in the presence of multireads. In particular, we show that three sources of information, that is, the observed number of uniquely mapped reads, the total length (TL) of the target (gene, transcript, or exon), and the lengths of the shared, or overlapping, target regions, are important when estimating expression levels in the presence of multireads. The first two pieces of information are used by RNA-Seq by expectation maximization (RSEM) (Li et al., 2010; Li and Dewey, 2011) and eXpress (Roberts and Pachter, 2013).
In particular, we show, with simulations, that methods using these sources of information estimate the expression levels of genes, exons, or transcripts, in the presence of multireads, in an accurate and precise manner. In addition, we show that the assumptions underlying the unique method and the proportional assignment method are too crude and can lead to biased estimates of expression levels.
The presented conceptual framework may allow abundance estimation with a set of equations. The use of this set of equations, to determine the absolute expression level of a genomic target, removes the need of an estimation method such as the EM-algorithm.
2. Methods
2.1. Repetitive sequences and ambiguity problem
A common approach to RNA-seq consists of extracting RNA, preparing a collection of shorter fragments, converting them into cDNA, and sequencing them using an NGS-based platform, from either one (single end) or both ends (paired end) of each cDNA fragment (Oshlack et al., 2010). As a consequence, millions of short sequences (reads) are obtained. To measure the expression levels of genes or transcripts, these reads are aligned to a reference sequence and, subsequently, are summarized for genomic or transcriptomic locations. The problem with read counting occurs when some sequence locations are similar or identical. In that case, a number of reads will map to more than one region. Without correct assignment, we are no longer able to properly assess the expression levels of that region. In the remainder of the article, we will refer to a read mapped to only one target as a “unique read,” and to a read mapped to multiple targets as a “multiread” or “shared read.”
Considering reference targets (genes or transcripts) with repetitive sequences, we can distinguish the nonoverlapping (or unique) regions and the overlapping (or shared) regions. To avoid confusion, for a particular target we use the term “nonoverlapping region” to denote any segment that is not part of any other target, and “overlapping region” to denote any segment that is shared with some other targets. The term “shared segments” refers to regions that are identical in nucleotide composition, or highly similar, that is, with a limited number of mismatches.
2.2. Theoretical abundance estimation
To gain insight into the underlying principles of ambiguous read allocation and expression-level quantification, we introduce a theoretical/conceptual framework. The principles are graphically illustrated.
The underlying idea of this framework is that the number of multireads originating from a target is proportional to the number of unique reads from the same target, while accounting for the length of the shared region and the length of the unique region. In this section, we derive the proposed conceptual framework.
2.2.1. A simple approach
Consider a genomic target A which shares an identical sequence segment with one or more targets. For each target, the TL, the length of the shared or overlapping region (OL), and the length of the unique regions (UL) are known. The total number of short sequence reads that are uniquely mapped to target A,
As a consequence, the number of multireads that truly belong to target A,
2.2.2. Edge effect correction
According to Oshlack et al. (2010), short sequence reads are not uniformly distributed across a genomic target (Fig. 1). The deviation from the uniform distribution of short sequence reads at the edges of the genomic targets can be explained by the fragmentation and sequencing process. During fragmentation, the extracted messenger RNA (mRNA) is broken into smaller pieces. The start positions of the generated fragments range between the first base of the mRNA sequence and the nucleotide at position
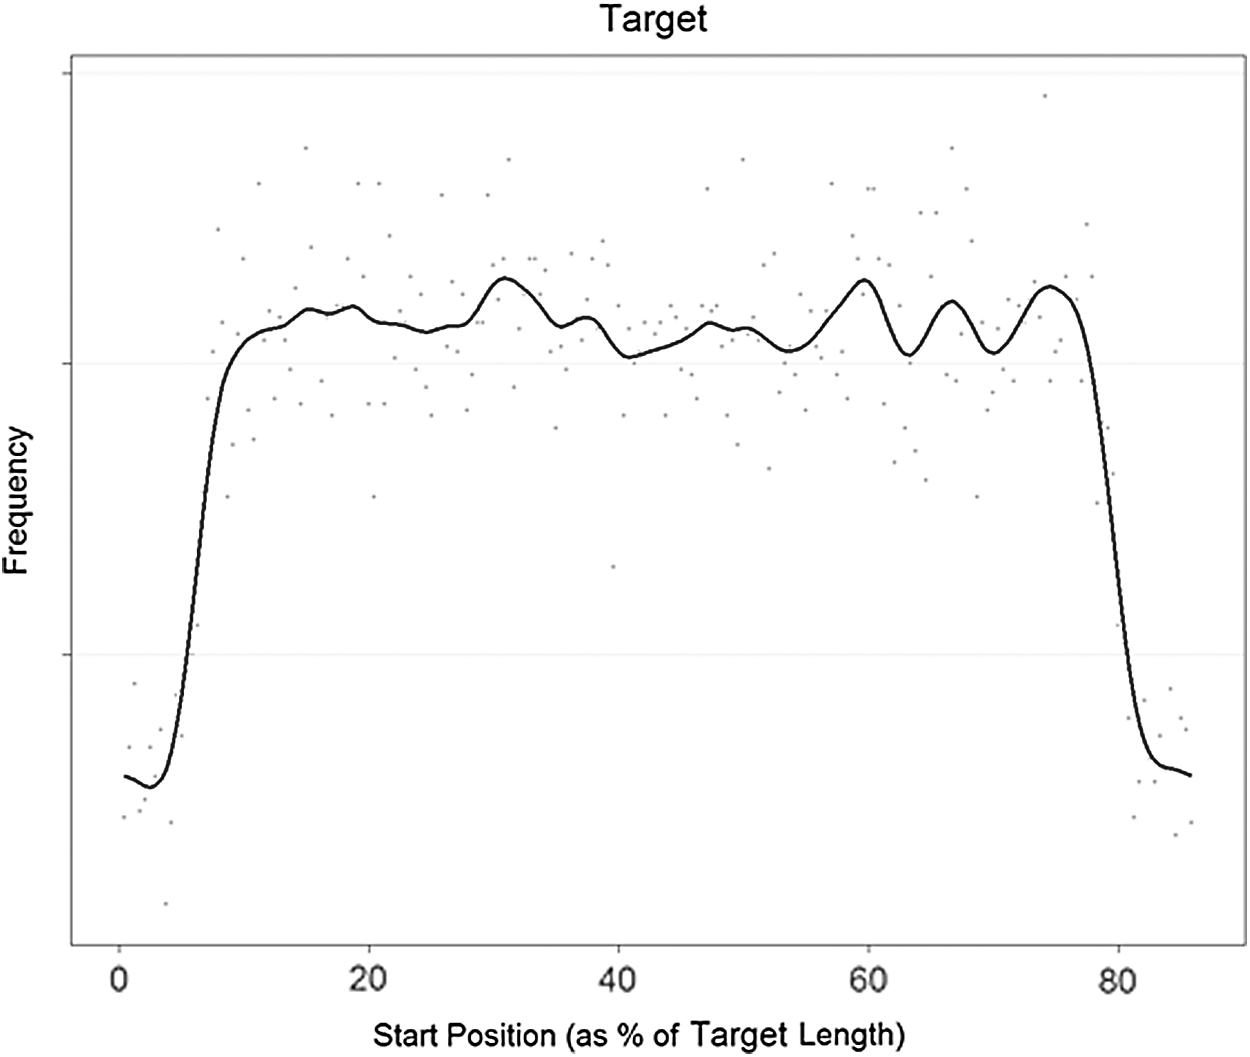
Distribution of read start position as a percentage of length for a certain genomic target. The number of mapped reads is 32,018. The black line is a cubic spline fit.
If a genomic target contains one or more shared sequence segments, additional edge effects have to be taken into account. To be considered as a multiread, a short sequence read should map fully within the shared region, when ignoring the possibility of sequencing errors and not allowing for mismatches in the alignment process. Hence, the length of the overlapping regions should also be corrected with edge effects. The starting position of the multireads cannot be past
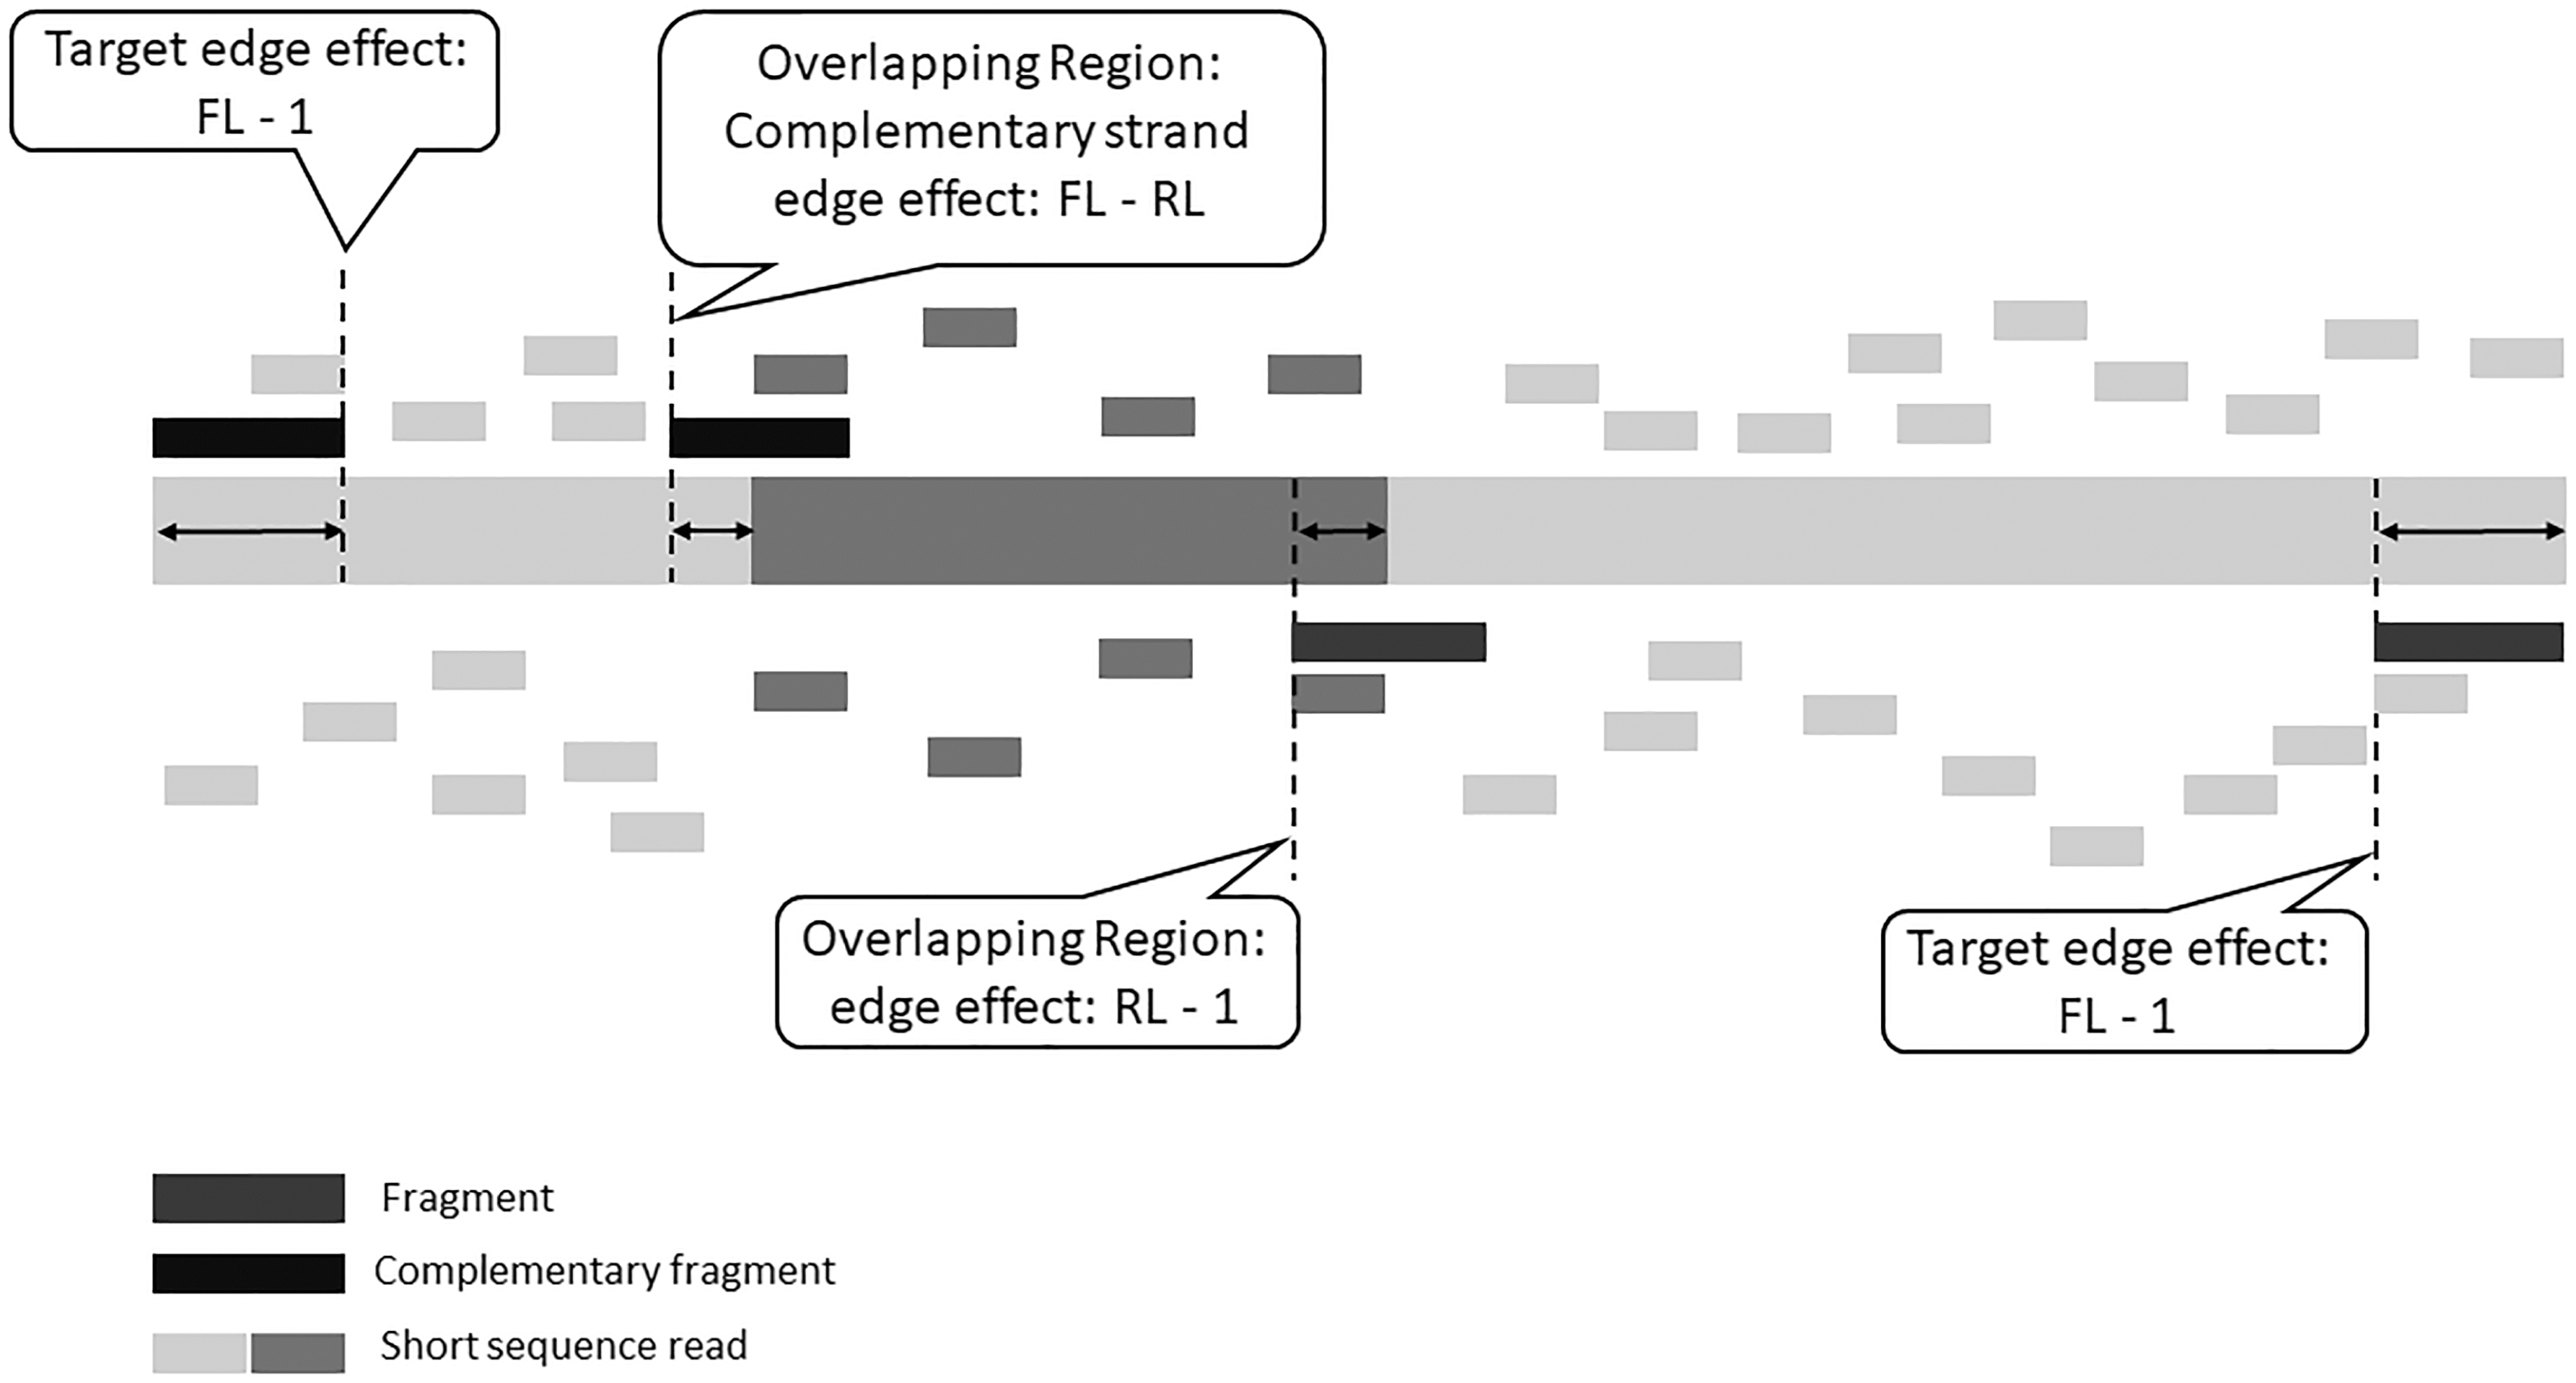
The possible edge effects for the genomic target and the overlapping region. The light grey segments indicate unique regions, whereas the darker grey segment is shared with one or more genomic targets. The short sequence reads below the genomic target are sequenced from fragments coming from the first strand (dark grey), while the reads above are from the complementary fragments (black). Shown are three edge effects: the target-edge effects (FL-1), the overlapping region edge effect RL-1, and the overlapping region complementary edge effect, FL-RL. FL, fragment length; RL, read length.
2.2.3. Abundance estimation using edge effects
To reliably estimate the abundance and to assess the number of truly mapped ambiguous reads, the simple approach has to incorporate the sequencing FL and the edge effect corrections. Ignoring this information, as in Equations (1) and (2), leads to biased estimates. These corrections depend on the location of the overlapping regions; that is, whether they are located at the beginning of the genomic target, at the end, or in between. We propose three different formulas to estimate the expression level, depending on the location of the overlapping region.
The total number of reads
Then, the total number of reads can be determined:
When the shared segment is located at the center of target A, the total number of reads can be calculated, while incorporating edge effect corrections, as follows:
If target A contains a shared region at the end, the overlapping complementary-strand edge effect and the target-edge effect occur. As a consequence, the total number of reads originating from target A is equal to
When target A has an overlapping region at the start, this region cannot be extended with the complementary-strand edge effect, but is shortened by the overlapping edge effect. The target length has to be corrected with the target-edge effect:
In case of paired-end sequencing, the three different formulas for the edge effect correction reduce to the following formula:
2.2.4. Alignment mismatches
At this point, we have not considered the possibility for allowing mismatches during the alignment process. Allowing for mismatches will lead to a higher number of short sequence reads that align to more than one genomic location. As a result, the number of unique reads will decrease. A fraction of the multireads will not map equally well to multiple locations; that is, a multiread may be aligned to multiple genomic locations with a different number of mismatches. Information about the number of mismatches can be retrieved from the BAM and/or SAM-file. We propose to consider multireads with an equal number of mismatches for different mapping locations to be “true” multireads. All other ambiguous reads will be assigned as unique reads to the genomic target with the lowest mismatches. With this approach, we ignore the possibility that a mismatch is caused by a sequencing error. Given the low sequencing error probability, a negligible bias in the estimated expression level can be expected.
2.3. Expression-level estimation by the unique method, proportional method, eXpress, and RSEM
Consider two reference targets T1 and T2 with expression level (abundance) given by the number of mapped reads
The simplest assignment method, the so-called unique method, estimates the target expression level by using solely uniquely mapped reads. In our example, this method yields expression-level (abundance) estimates equal to
The proportional method (Mortazavi et al., 2008; Hashimoto et al., 2009) estimates the fraction of multireads assigned to each reference target based on the number of uniquely mapped reads. For target T1, this fraction is expressed by
The underlying idea of our theoretical framework (TF), and of RSEM (Li et al., 2010; Li and Dewey, 2011) and eXpress (Roberts and Pachter, 2013) is identical; that is, shared reads can be divided across genes, isoforms, and/or exons based on the unique reads, and the length of the genomic targets. While the proposed TF suggests the possibility of using a set of equations to determine the expression levels, RSEM and eXpress estimate the expression levels iteratively.
In case of RSEM, the probability,
with
where
eXpress (Roberts and Pachter, 2013) allocates reads among targets by means of the EM algorithm. In the process, it uses the information about the unique reads, the location to which unique reads and multireads are mapped to, the FL, the target length, positional bias, and sequencing errors. The algorithm returns the target abundance for each sample, and the probability that a given multiread originates from a specific genomic target.
3. Data
Due to the absence of real-life RNA-seq data for which the true expression levels are known, we conducted a number of simulation studies to validate the performance of the unique and the proportional methods, RSEM, and eXpress, when specifying the FL distribution; that is, the mean FL and the standard deviation. In addition, we specified extra iterations of the EM-algorithm for eXpress. We also present results from the “TF” and “TF simple” (TF without edge effect corrections).
We simulated short reads using the R package Polyester (Frazee et al., 2015). Polyester allows full control over the simulation setup, the sequencing FL, and the RL. We point out that the data generation mechanism used by Polyester is fully independent from our concept. As it has been shown that the fragment–length–distribution can be approximated by a Gaussian one (Li and Dewey, 2011), we generated fragments from a normal distribution with an average length of 50 base pairs (bp) and a standard deviation equal to 3 (sd = 3). The RL was set to 35 bp. To mimic experimental data, we shuffled the obtained short sequences.
We simulated data for three different settings (Fig. 3). In each setting, two experimental conditions with two replicates per condition were generated. In Settings 1 and 3, two genomic targets share one identical region, while in Setting 2 three genomic targets share two identical regions: genomic target A shares a segment with targets B and C, and genomic targets B and C share one extra region. We generated ∼1000 reads for target A and 300 reads for target B in Setting 1 and Setting 3, and in Setting 2, 1000, 300, and 500 reads for targets A, B, and C, respectively (Table 1). We mapped the generated reads against the reference sequence using Bowtie (Langmead et al., 2009). We allowed Bowtie to report up to two valid alignments in Settings 1 and 3, and up to three in Setting 2. Subsequently, for each target, the numbers of unique reads and multireads were obtained based on the number of mapping locations.
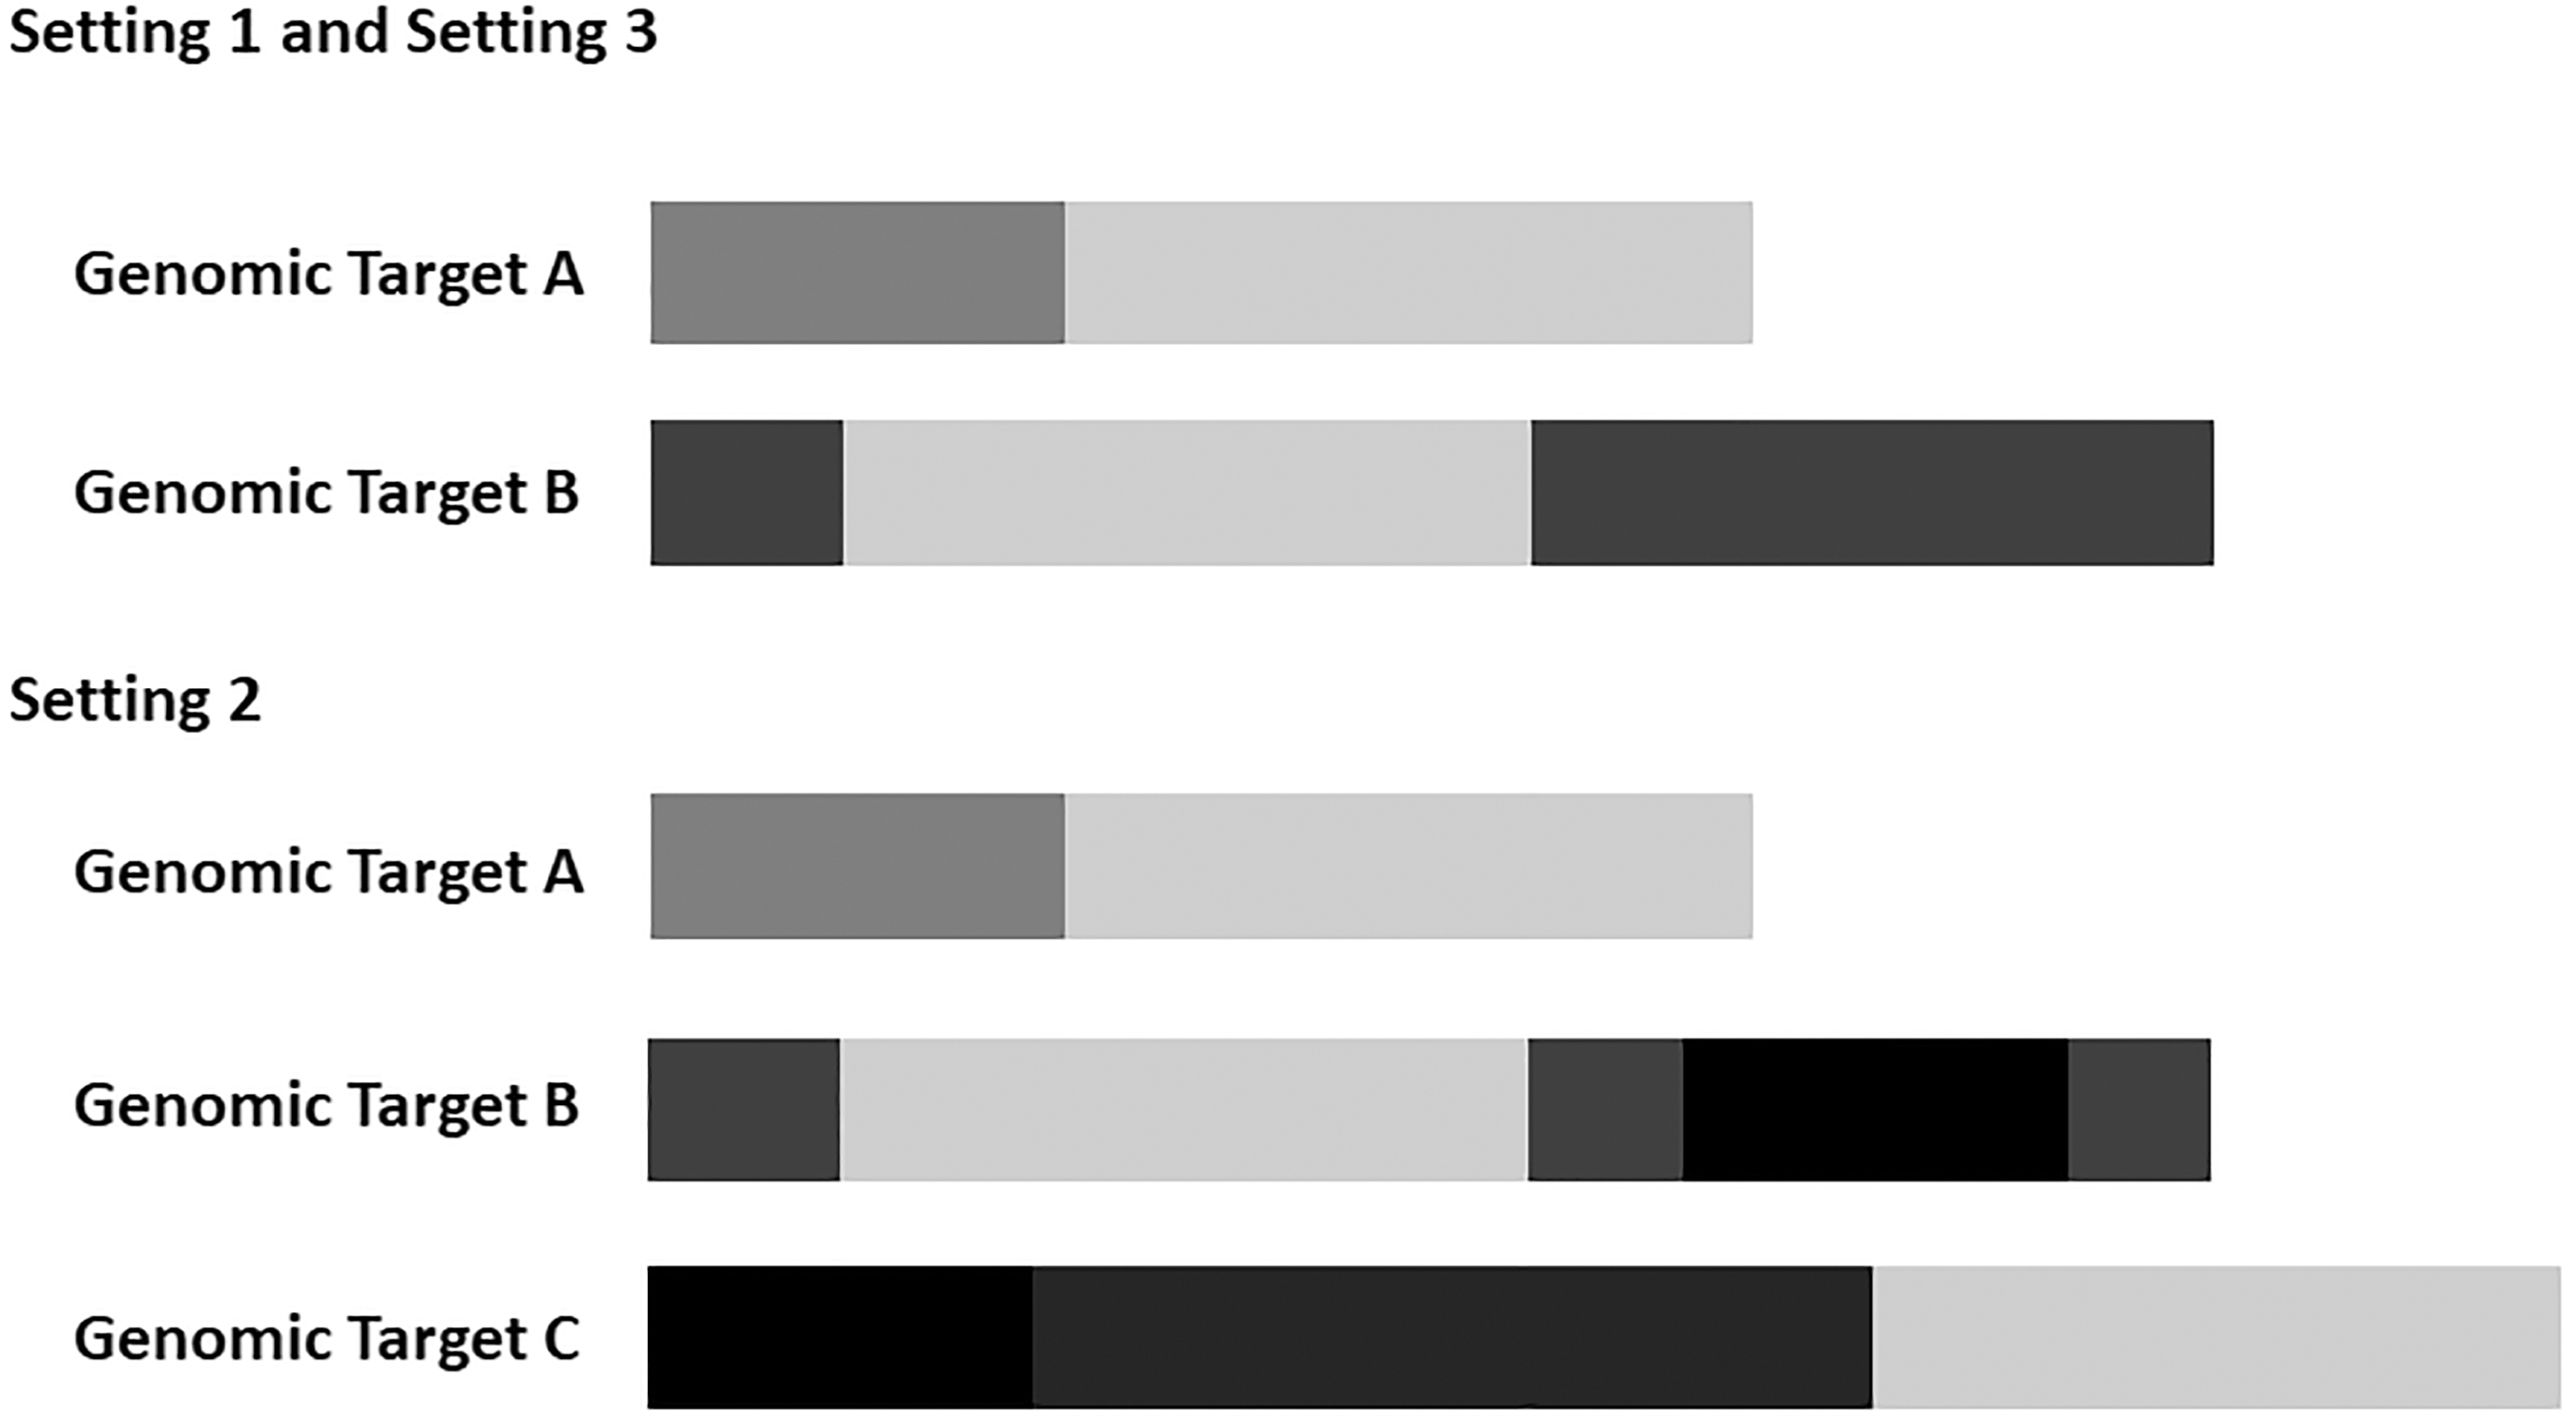
Simulation Settings 1, 2, and 3. The light grey and black segments indicate shared regions, whereas the other shades of grey segments indicate unique regions for, respectively, genomic targets A, B, and C. Settings 1 and 3 use the same set of targets, but the experiment type is different. Single-end and paired-end experiments were used in Settings 1 and 3, respectively.
The Expression Levels in Conditions 1 and 2
Table 2 shows the four different simulation scenarios that we considered: mapping without allowing for mismatches, mapping with allowing mismatches, in combination with reads that were generated without or with sequencing error.
The Different Simulation Scenarios
Mismatches indicate mapping without mismatches (no) and mapping allowing for mismatches (yes). Error indicates simulated reads without sequencing error (no) and allowing for sequencing error (yes).
To evaluate the impact of the compared methods on the abundance estimation, we considered the difference between the read counts estimated by each method and the true expression level (Ji et al., 2011; Pasaniuc et al., 2011). We defined the resulting error rate as follows:
4. Results and Discussion
4.1. Setting 1: two genomic targets
In Setting 1, we considered two targets (A and B) for which single-end reads were generated and mapped to the reference sequence. Figure 3 shows the placement of the shared region between target A and target B.
In the first simulation scenario, the reads were generated without sequencing errors, and were aligned to a reference sequence without allowing for mismatches. Table 3 summarizes the read counts obtained by all methods of handling ambiguously mapped short sequences. Figures 4 and 5 show the error rates of the unique method, the proportional method, eXpress, RSEM, “TF simple,” and TF. Among the compared approaches, TF and RSEM achieved the highest accuracy in expression-level estimation. In every sample, for both targets, the estimated numbers of short sequence reads were almost identical to the true counts (Table 3 and Figs. 6 and 7); that is, for TF the error rate was on average equal to 0.0276 and 0.0297 for targets A and B, respectively, while for RSEM the average error was equal to 0.005 and 0.028 for targets A and B, respectively (Figs. 4 and 5).

Results for Scenario 1 in Setting 1 comparing the error rate of target abundance-level estimation (target A). Shown are the distances between read counts estimated by each method and true expression level for 1000 simulated data sets.

Results for Scenario 1 in Setting 1 comparing the error rate of target abundance-level estimation (target B). Shown are the distances between read counts estimated by each method and true expression level for 1000 simulated data sets.

Results for Scenario 1 in Setting 1 comparing the target abundance-level estimation (target A). The boxplots show the abundances estimated by each method for 1000 simulated data sets. The true expression level is represented by a black line.

Results for Scenario 1 in Setting 1 comparing the target abundance-level estimation (target B). The boxplots show the abundances estimated by each method for 1000 simulated data sets. The true expression level is represented by a black line.
Overview of the Target Abundance Estimates Averaged Across 1000 Data Sets for Simulation Scenario 1 (No Sequencing Error, No Mismatches) in Setting 1
The column “TF simple counts” shows the estimated expression levels without the edge effect correction, while the last column shows the estimated expression levels with edge effect correction.
RSEM, RNA-Seq by expectation maximization; TF, theoretical framework.
The approach without correcting for the edge effects (“TF simple”) systematically overestimated the abundances. In particular, the error rate was larger than that for TF; that is, 0.1219 and 0.0573 for targets A and B, respectively. This indicates that the proposed edge effect corrections are important. For the proportional method, the number of short sequences was substantially underestimated (target A, error rate = 0.1509) or overestimated (target B, error rate = 0.9034). This suggests that using only the number of unique reads to allocate the multireads across multiple targets is insufficient, and can lead to relatively large bias. When using eXpress, with the mean and standard deviation for the FL specified, the error rate was equal to 0.2619 and 0.077 for targets A and B, respectively.
In addition, in the first simulation scenario we generated 50 bp-long reads. The same conclusions as is a case of 35 bp-long reads can be made among considered methods (Supplementary Table S1 and Supplementary Figs. S1 and S2).
Similar observations can be made for simulation Scenario 2, where the reads were aligned with up to two mismatches (Table 4). The proportional method led to underestimation in case of genomic target A (error rate = 0.1602) and substantial overestimation of the abundance level of target B (error rate = 0.9621). eXpress overestimated the abundance especially for target A, while TF and RSEM returned very accurate and very precise abundance estimates (Supplementary Figs. S3, S4, S5, S6).
Overview of the Target Abundance Estimates Averaged Across 1000 Data Sets for Simulation Scenario 2 (No Sequencing Error, Allowing for Mismatches) in Setting 1
The column “TF simple counts” shows the estimated expression levels without the edge effect correction, while the last column shows the estimated expression levels with edge effect correction.
In simulation Scenarios 3 and 4, the short sequence reads were created with the possibility of sequencing errors (probability 0.5%). Tables 5 and 6 show the abundance estimates in the presence of sequencing errors when mapping without any mismatch (Scenario 3) and when allowing for up to two mismatches (Scenario 4). The tables also show that the bias of TF's and RSEM's estimates was much smaller than that for the unique and proportional methods. For the unique method, the abundance was, as could be expected, strongly underestimated, while for the proportional method the abundance was systematically underestimated for target A, while overestimated for target B. “TF simple” slightly outperformed eXpress in case of both targets (Supplementary Figs. S7, S8, S9, S10).
Overview of the Target Abundance Estimates Averaged Across 1000 Data Sets for Simulation Scenario 3 (Sequencing Error, No Mismatches) in Setting 1
The column “TF simple counts” shows the estimated expression levels without the edge effect correction, while the last column shows the estimated expression levels with edge effect correction. The sequencing error was set on 0.5%.
Overview of the Target Abundance Estimates Averaged Across 1000 Data Sets for Simulation Scenario 4 (Sequencing Error, Mismatches) in Setting 1
The column “TF simple counts” shows the estimated expression levels without the edge effect correction, while the last column shows the estimated expression levels with edge effect correction. The sequencing error was set on 0.5%.
4.2. Setting 2: three genomic targets
We considered three reference targets (A, B, and C). All three targets shared the same sequence region. In addition, target B and target C shared one more sequence region (Fig. 3). The locations of the overlapping regions were at the beginning, in the middle, and at the end of the genomic targets. The unique, proportional method, eXpress, RSEM, “TF simple,” and TF were applied to four simulation scenarios to assess the expression levels (Table 7 and Supplementary Tables S2, S3, S4 and Supplementary Figs. S11, S12, S13). Results were similar to those observed for Setting 1: TF and RSEM estimated the abundance of the three targets with a very small bias, while the unique method systematically underestimated the true abundance level. The proportional method led to a larger bias and error rate than TF.
Overview of the Target Abundance Estimates Averaged Across 1000 Data Sets for Simulation Scenario 1 (No Sequencing Error, No Mismatches) in Setting 2
The column “TF simple counts” shows the estimated expression levels without the edge effect correction, while the last column shows the estimated expression levels with edge effect correction.
4.3. Setting 3: paired-end short sequences
Since paired-end reads provide superior mapping results (Li et al., 2015), paired-end sequencing is also applied to mRNA-seq experiments. Table 8 summarizes the results for simulation Scenario 1 in Setting 3. For this setting, we did not have to specify the FLs for eXpress, as eXpress can derive the FL distribution from paired-end reads on-the-fly. Similarly to Setting 1 and Setting 2, TF and RSEM clearly outperformed all other methods. Simulation Scenarios 3 and 4 in Setting 3 included sequencing error (probability 0.5%). This error was applied to only one of the two reads that form a pair. The results for Scenarios 2, 3, and 4 are described in detail in Supplementary Tables S5, S6, S7 and Supplementary Figs. S14, S15, S16, S17. The unique method systematically underestimated the true expression level. For the proportional method, a trend similar to the one observed in Settings 1 and 2 was seen. The abundance was underestimated and overestimated for target A and target B, respectively. eXpress led to smaller bias in expression-level estimation in case of target B compared with target A. For target A, eXpress performed similarly to TF without edge effect correction. In addition, in Scenario 1 we generated reads of length 50 bp. Similar conclusions as is in case of reads 35 bp long can be made among compared methods (Supplementary Table S8 and Supplementary Figs. S18 and S19).
Overview of the Target Abundance Estimates Averaged Across 1000 Data Sets for Simulation Scenario 1 (No Sequencing Error, No Mismatches) in Setting 3
The column “TF simple counts” shows the estimated expression levels without the edge effect correction, while the last column shows the estimated expression levels with edge effect correction.
5. Discussion
We presented a set of principles underlying multiread allocation and estimation of the abundance of genes, isoforms, and/or exons in the presence of reads with multiple mapping locations. These principles indicate that at least three additional sources of information should be used when estimating the expression level of genomic targets; that is, the RL, the target length, and the length of the overlapping region.
As can be seen from the results, approaches that use this additional information partially (“eXpress” and “RSEM”) or fully (“TF” and “TF simple”) are more precise and accurate than methods that do not consider this information (“unique” and “proportional”).
We point out that Equations (5)–(8), derived from the proposed principles, are used only as an indication of the potential of the underlying principles, and therefore should be considered as a theoretical concept. The practical implementation of the underlying principles can be challenging, as several issues have to be overcome. Similarly to RSEM and eXpress, the FL distribution is not readily available in case of single-end sequencing. One can extract this distribution, after conducting an experiment, with the help of tools such as Bioanalyzer (www.genomics.agilent.com). Paired-end sequencing has the advantage that the FL can be obtained from the data. Moreover, since both ends have to map to a genomic target, the three proposed formulae for total abundance estimation reduce to a single equation. Another issue is identifying the overlapping regions of genomic targets. This process can be very time consuming. However, it has to be executed only once for each reference genome. Two additional challenges with respect to the overlapping regions have to be dealt with. First, it is likely that multiple overlapping regions within one genomic target can be found. As a consequence, additional edge effect corrections have to be defined. Second, in case of nonidentical shared segments, one should divide these shared segments in subparts that are identical to segments in other genomic targets. We believe that these challenges can be tackled, and methods that can be used for this purpose are the topics of this research.
6. Conclusion
RNA-seq has become the major technology for measuring RNA expression either on gene-, transcript-, or exon level. Accurate estimation of the expression level is crucial, but is still problematic in spite of existing methods. Current literature shows that the mapping process might be inaccurate, which is a big impediment in abundance estimation. That is, for a large fraction of short sequence reads several genomic locations can be found. Often, reads aligning to more than one region are ignored, or randomly assigned to one location. However, such strategies lead to incorrect estimation of expression levels. A number of methods have been proposed to estimate abundance in the presence of multireads. They either handle ambiguities in the alignment process (Langmead et al., 2009; Ji et al., 2011), or try to diminish biases occurring in reads quantification (Li and Dewey, 2011; Roberts and Pachter, 2013).
In this article, we highlight the underlying mechanism of multireads allocation. We present a conceptual framework that shows the importance of the RL, the genomic target length, and the overlapping region length for the abundance estimation of genes, transcripts, and/or exons in the presence of multireads. These pieces of information enable determining the correct number of multireads originating from a genomic location, and as such ensure high accuracy in expression quantification. Our results show that algorithms that incorporate (partially) this information into their estimation procedure, such as RSEM and eXpress, outperform the unique method and the proportional method by achieving higher accuracy in single-end and in paired-end sequencing experiments.
Our findings also suggest that the RL, the genomic target length, and the overlapping region length affect ambiguous reads occurrence. Shorter reads and targets incur more ambiguity in reads alignment and larger bias in expression quantification. However, RSEM, eXpress, and the set of proposed equations can handle these impediments.
Footnotes
Acknowledgments
The authors acknowledge Joke Reumers for the useful comments and fruitful discussions.
Author Disclosure Statement
The authors declare they have no conflicting financial interests.
Funding Information
K.G. acknowledges funding by the BOF-BiLA grant (R-7699) from Hasselt University.
References
Supplementary Material
Please find the following supplemental material available below.
For Open Access articles published under a Creative Commons License, all supplemental material carries the same license as the article it is associated with.
For non-Open Access articles published, all supplemental material carries a non-exclusive license, and permission requests for re-use of supplemental material or any part of supplemental material shall be sent directly to the copyright owner as specified in the copyright notice associated with the article.