




Abstract
Genome segmentation methods are powerful tools to obtain cell type or tissue-specific genome-wide annotations and are frequently used to discover regulatory elements. However, traditional segmentation methods show low predictive accuracy and their data-driven annotations have some undesirable properties. As an alternative, we developed ModHMM, a highly modular genome segmentation method. Inspired by the supra-Bayesian approach, it incorporates predictions from a set of classifiers. This allows to compute genome segmentations by utilizing state-of-the-art methodology. We demonstrate the method on ENCODE data and show that it outperforms traditional segmentation methods not only in terms of predictive performance, but also in qualitative aspects. Therefore, ModHMM is a valuable alternative to study the epigenetic and regulatory landscape across and within cell types or tissues.
Introduction
A single organism may consist of a remarkable diversity of cell types all sharing the same genotype. To understand how this diversity arises, current research in molecular biology has focused much attention on the functioning of transcriptional regulation. Genome-wide measurements of epigenetic marks and RNA expression have recently become available for many cell types and tissues (ENCODE Project Consortium, 2012). These data provide a first glimpse at the regulatory program on a genome-wide scale. It is used to annotate regulatory elements and to locate important switches that control cell identity (Hoffman et al., 2012b).
Genome segmentations are frequently used as a starting point for the identification and analysis of regulatory elements within cell types or tissues. By combining data from multiple experiments a genome segmentation method assigns a chromatin state to each genomic position. This may include regulatory elements such as active or repressed promoters and enhancers, active transcription or regions without an apparent function. The set of chromatin states a segmentation method is able to detect heavily depends on the choice of features. Typically a variety of histone modification ChIP-seq experiments is used possibly in combination with measurements of chromatin accessibility. However, other sources of information may be used as well, including DNA methylation, CpG content, or evolutionary conservation. Chromatin states are characterized by specific combinations of such features. For instance, promoters are often conserved elements and accessible for transcription factors where the flanking nucleosomes are marked by H3K4me3. In contrast, most enhancers are less conserved and marked by H3K4me1. Enrichment of H3K27ac is found at active promoters and enhancers, whereas H3K27me3 is known to be a repressive mark observed at bivalent promoters and poised enhancers (Barski et al., 2007; Heintzman et al., 2007; Calo and Wysocka, 2013; Heinz et al., 2015).
Most common segmentation methods are instances of hidden Markov models (HMMs) where the observed data are assumed to be caused by an unobserved sequence of hidden states with Markov dependency structure. A frequently used implementation of this type is ChromHMM (Ernst and Kellis, 2012), which, however, relies on binarized data. A more advanced HMM-based method is EpiCSeg (Mammana and Chung, 2015) that addresses this shortcoming by using negative multinomial distributions to model observations. The handling of both methods is seemingly easy. Parameters are estimated unsupervisedly without the need for a training set using a maximum likelihood approach. Afterward, by inspection of estimated parameters each hidden state is identified with one or more chromatin states. Although this approach is very easy to apply, it also bears several risks. The specific combination of features known to mark a chromatin state and their spatial distribution is often not well reflected by the model.
Hence, supervised methods specialized in the detection of regulatory elements typically perform much better. To obtain good classification performances of unsupervised HMMs the number of hidden states often exceeds the actual observed number of chromatin states. This leads to highly fragmented genome segmentations where single chromatin states are represented by multiple states of the HMM. Figure 1 illustrates this problem on a promoter of a transcribed gene. An optimal segmentation would detect the region as a single active promoter with a transcribed region to the left. However, typical segmentations obtained with ChromHMM or EpiCSeg instead show a highly fragmented promoter region. Another drawback of the unsupervised HMM approach is the low flexibility of the model offering no glaring way to improve a poor segmentation. ChromHMM and EpiCSeg have only two parameters, namely the number of hidden states and the genomic bin size, whose effect on the resulting segmentation is highly unpredictable. Furthermore, to determine the optimal set of parameters it is necessary to learn and evaluate a large number of different models, effectively negating the presumed simplicity.
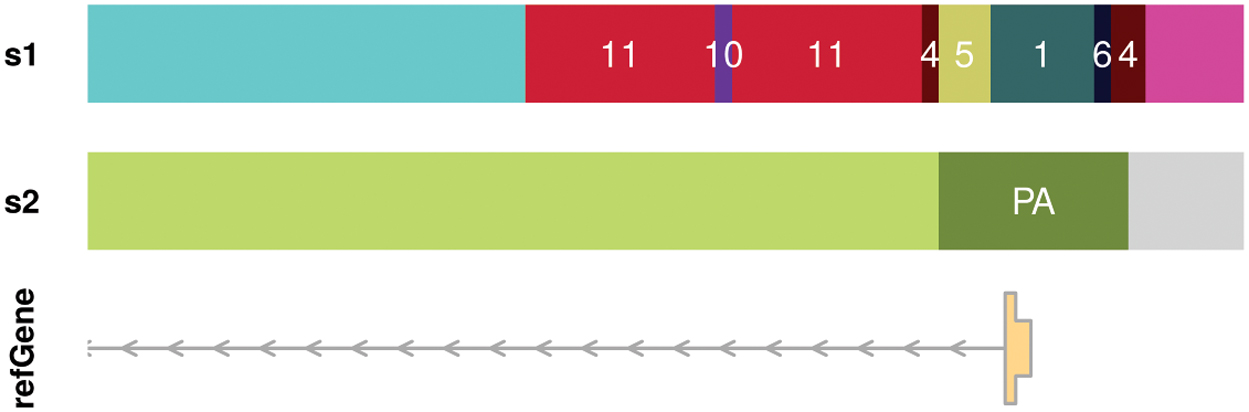
Genome segmentations. Typical genome segmentation (s1) where the promoter is fragmented into many different segments. In this example, the optimal segmentation (s2) shows a single active promoter segment (PA) with a transcribed region to the left and no signal to the right.
ChroModule (Won et al., 2013) is a supervised alternative that models the spatial distribution of features at chromatin states with left–right structured HMMs that are commonly used in speech recognition (Rabiner, 1989). However, the construction of a model requires a training set for each chromatin state. As an alternative to the HMM-based methods, Segway (Hoffman et al., 2012a,b) allows to compute segmentations based on arbitrary hidden processes, as long as the model can be represented as a dynamic Bayesian network. It operates on a single base-pair resolution and with its default model computes segmentations that are even more fine-grained than those of ChromHMM and EpiCSeg (Hoffman et al., 2012a). Segway models are typically trained on a small fraction of the available data, due to the computational complexity of the inference algorithm and the high data resolution.
A different approach is implemented in StateHub-StatePaintR (Coetzee et al., 2018). Instead of inferring chromatin states de novo every time a segmentation is computed, the method implements a model of our current understanding of chromatin state characteristics. In particular, the model encodes for each chromatin state the set of features that are positively or negatively associated with that state. The method is certainly a step toward the right direction, but it also does not model the spatial distribution of features around chromatin states and, therefore, produces highly fragmented segmentations, similar to those of unsupervised HMMs.
We develop in this study a new modular segmentation method based on HMMs called ModHMM that addresses some of these shortcomings in the following way. First of all, we recognize that jointly learning all parameters of an HMM in an unsupervised way is overly ambitious and leads to poor results. Instead, we assemble the segmentation method piece by piece allowing us to guide the learning process as much as possible. Second, our objective is to construct a method that may benefit from the ample variety of well-performing classifiers that have been developed for most regulatory elements. Inspired by the supra-Bayesian approach (Lindley et al., 1979; Lindley, 1982, 1985; Genest and Zidek, 1986; Gelfand et al., 1995; Jacobs, 1995), we construct an HMM that acts as a decision maker who integrates assessments from several experts. Each expert or classifier is specialized in the detection of a single chromatin state, possibly by considering only a subset of the available features. The classifiers may also model the spatial distribution of features near functional elements to improve prediction accuracy.
Hence, our segmentation method consists of an HMM combined with a set of chromatin state classifiers. As opposed to traditional segmentation methods, our HMM does not take feature tracks (i.e., ChIP-seq/ATAC-seq tracks) as input, but instead regards the genome-wide probability assessments of the chromatin state classifiers as observations. We constructed the method in a highly modular way, allowing to easily improve segmentations by replacing single classifiers. To facilitate the usage of ModHMM, we constructed a default set of chromatin state classifiers. The parameters of supervised classifiers are commonly estimated on some training set. However, constructing a training set for each classifier would not only be a tedious task, but it would also shift control over the resulting segmentation to the composition of such training sets. Instead, we do not rely on a training set but engineer each classifier by translating contemporary knowledge of chromatin states into a probabilistic model. This makes ModHMM easily applicable to new data sets and ensures that the interpretation of hidden states is consistent across samples.
We evaluate ModHMM equipped with its default chromatin state classifiers on promoter and enhancer test sets and show that it outperforms traditional segmentation methods not only in classification accuracy but also in qualitative aspects, meaning that ModHMM segmentations are less fragmented. To improve segmentation results, classifiers from the default set can be easily replaced by more powerful supervised alternatives, allowing to incorporate predictions from state-of-the-art methods. Inspired by the DFilter peak calling method (Kumar et al., 2013), we develop a classifier that models the spatial distribution of features around chromatin states. We train this classifier on a set of active enhancers and show that it can be effectively integrated into our genome segmentation method.
We consider chromatin states that are most relevant for the analysis of gene regulation and that are typically found in genome annotation studies (Hoffman et al., 2012b; Ernst and Kellis, 2017; Gorkin et al., 2017). This includes active promoters (PA) and enhancers (EA), primed (PR) and bivalent (BI) regions, as well as regions of active (TR) and low transcription (TL). In addition, we model heterochromatic regions marked by H3K27me3 (R1) or H3K9me3 (R2) and regions where either no signal (NS) or a control signal (CL) is observed. Enhancers and promoters are detected based on ATAC-seq (Buenrostro et al., 2013, 2015) data measuring chromatin accessibility in combination with histone marks H3K4me1 and H3K4me3. To measure the activity of promoters and enhancers we use histone mark H3K27ac (Creyghton et al., 2010). Although active promoters and enhancers can be accurately discriminated by the ratio of histone marks H3K4me1 and H3K4me3, we observed that the prediction accuracy is much lower for bivalent promoters and poised enhancers (Section 3.3).
Therefore, we decided to merge both chromatin states into a single bivalent state (BI), which is marked by H3K27me3 and H3K4me1 or H3K4me3. Similarly, we define primed states (PR) as accessible regions marked by H3K4me1 or H3K4me3 but showing no H3K27ac and H3K27me3 signal. We also model regions solely marked by either H3K27me3 (R1) or H3K9me3 (R2). Histone mark H3K27me3, catalyzed by the polycomb repressive complex 2, is involved in gene silencing and associated with constitutive heterochromatin (Kuzmichev et al., 2002; Margueron and Reinberg, 2011). In contrast, histone mark H3K9me3 is associated with constitutive heterochromatin, predominantly formed in gene-empty regions (Saksouk et al., 2015). Transcribed regions are typically marked by H3K36me3 (Wagner and Carpenter, 2012); however, we decided to use polyA RNA-seq data instead since it is a more direct and less noisy measurement. Our model also accounts for low levels of transcription (TL) that frequently occur at repressed genes or in intergenic regions, for instance near certain types of enhancers that generate unidirectional polyA+ eRNAs (Koch et al., 2011).
ModHMM is a highly modular genome segmentation method that incorporates predictions from a set of classifiers. In contrast to unsupervised methods, we manually construct most parts of the model. It consists of two components, the HMM and the set of chromatin state classifiers, both will be outlined in the following. For the chromatin state classifiers we consider a default set of engineered classifiers as well as a supervised alternative.
Hidden Markov model
ModHMM implements a HMM, which consists of an unobserved Markov process generating a series of hidden states, each emitting a single observation (Cappé et al., 2005). To define the HMM, we first must assign each chromatin state to one or more hidden states of the HMM and decide on a set of feasible transitions of the unobserved Markov process. Finally, we present the emission model for incorporating genome-wide predictions of the classifiers and show that transition rates must be further constrained to construct a well-functioning model.
Hidden states and feasible transitions
Unsupervised HMM-based segmentations methods, including ChromHMM and EpiCSeg, learn transition rates using a maximum likelihood approach and initially allow transitions between any two states. To guide the learning process, it is often helpful to enforce a predefined structure on the transition matrix (Galassi et al., 2007). In genetics such structured HMMs have been utilized before, for instance, for the prediction of gene structures from DNA sequences (Burge and Karlin, 1997). In our case, the structure of the HMM should encode any prior knowledge about the context in which chromatin states appear in the genome and may, for instance, be used to implement a model for actively transcribed genes. However, one has to be cautious not to enforce an overly simplistic model. For instance, an HMM that requires each gene to have exactly one promoter and a single transcribed region would not be realistic and result in wrong predictions. The converse, a model that is excessively complex would have equally poor predictive performance.
Therefore, we decided on an HMM with minimal structure, as depicted in Figure 2. Some chromatin states are represented by multiple hidden states of the HMM. For instance, active enhancers (EA) are represented by hidden states EA,
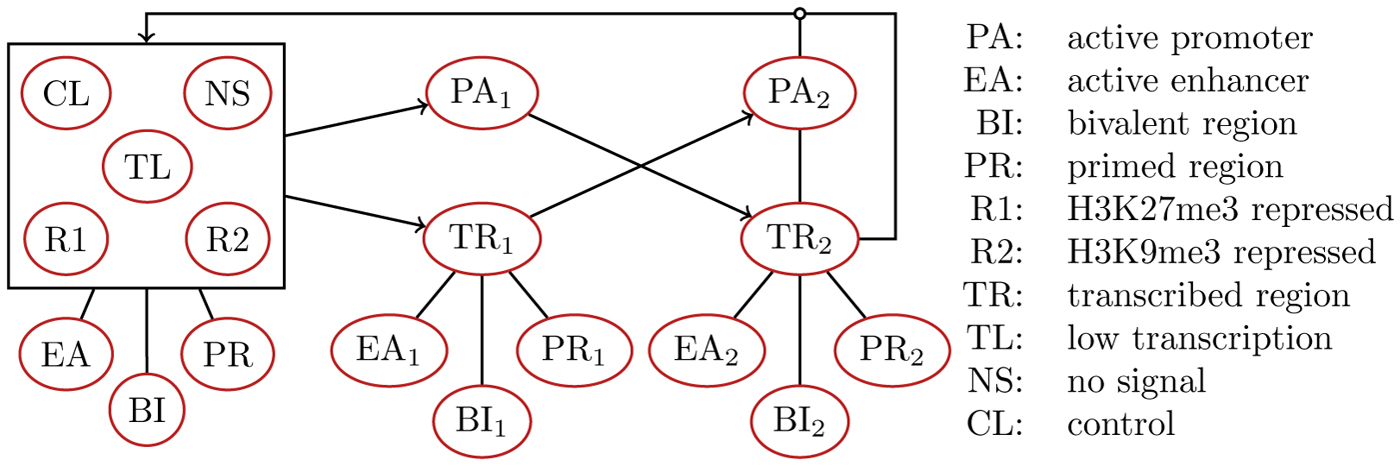
ModHMM state diagram. Some chromatin states are represented by multiple hidden states. For instance, active enhancers (EA) are represented by hidden states EA,
The ModHMM segmentation method is inspired by the supra-Bayesian approach that integrates predictions of an expert committee from which a decision maker reaches a final decision. The expert committee consists of a set of classifiers, each specialized in the detection of a single chromatin state
where
Transition rates
In typical HMMs, transition rates are estimated from data and reflect context-dependent state prevalences. The situation is different in our case, where classifiers are used to optimally discriminate between chromatin states and to account for prevalences. By naively integrating classifiers into an HMM, results of classification may get overruled by transition rates, making it more difficult to combine classifiers into a well-functioning model. For instance, whether a region is classified as active enhancer or primed should be mostly decided based on what classifier shows the higher probability (Fig. 3). Still, transition rates are valuable parameters and we use them to model the expected length of chromatin states.

Transition rates interfering with classifications. The figure shows a region with histone modification signals (omitted) of an active enhancer. The active enhancer classifier (EA) also shows the highest probability. The primed state classifier (PR) shows a smaller peak while the probability for an active promoter (PA) is very low. The first segmentation (s1) is computed with an unconstrained transition matrix. The region is classified as primed because transition rates overrule classifier assessments. The second segmentation (s2) has constrained transition rates and correctly classifies the region as active enhancer.
Two types of constraints are imposed on the transition matrix
The parameter
ModHMM incorporates predictions from a set of classifiers through a simple parameter-free likelihood model. Hence, the only parameters that must be estimated are the transition rates of the unobserved Markov process. Given the amount of data available for computing genome segmentations, we refrain from using highly sophisticated Bayesian estimation methods. Instead, we utilize the common maximum likelihood approach. As an instance of the expectation-maximization (EM) algorithm the Baum–Welch algorithm maximizes the likelihood function iteratively until a stationary point is found. To satisfy our constraints on the transition matrix
and
with multipliers
that contains two types of constraints. First,
where
where dots mark additional constraints stemming from the remaining parts of the matrix
Default chromatin state classifiers
ModHMM takes as input the genome-wide predictions of a set of classifiers. In principle, any type of classifier can be used; however, ModHMM implements a default classifier set to simplify usage. These engineered classifiers require no training data and consist of two layers. First, a single-feature classifier is constructed for each feature that determines the probability of enrichment at each genomic position. These single-feature classifiers are then combined into a set of naive Bayesian multifeature classifiers (Maron, 1961; Duda and Hart, 1973; Mitchell, 1997; Russell and Norvig, 2016), each specialized in the detection of a single chromatin state.
Single-feature classifiers
The purpose of a single-feature classifier is to assess the enrichment of a feature genome-wide. Since it assigns a probability to each genomic position, we may also interpret this step as a normalization step that decouples the definition of the engineered multifeature classifiers from the actual observations. Such classifiers are the basic ingredient of many peak calling methods, implementing a large variety of different statistical models (Wilbanks and Facciotti, 2010), ranging from Poisson (Mortazavi et al., 2008; Valouev et al., 2008) or local Poisson (Zhang et al., 2008) to HMMs (Spyrou et al., 2009).
Our approach differs in that we do not assume the same model for all features but rather account for the high heterogeneity. More specifically, we first compute the coverage along the genome in 200 bp bins (Section 3.5). The coverage values are then modeled by a feature-specific mixture distribution. Consider an event
where pk is the kth component of the feature-specific mixture distribution with weight
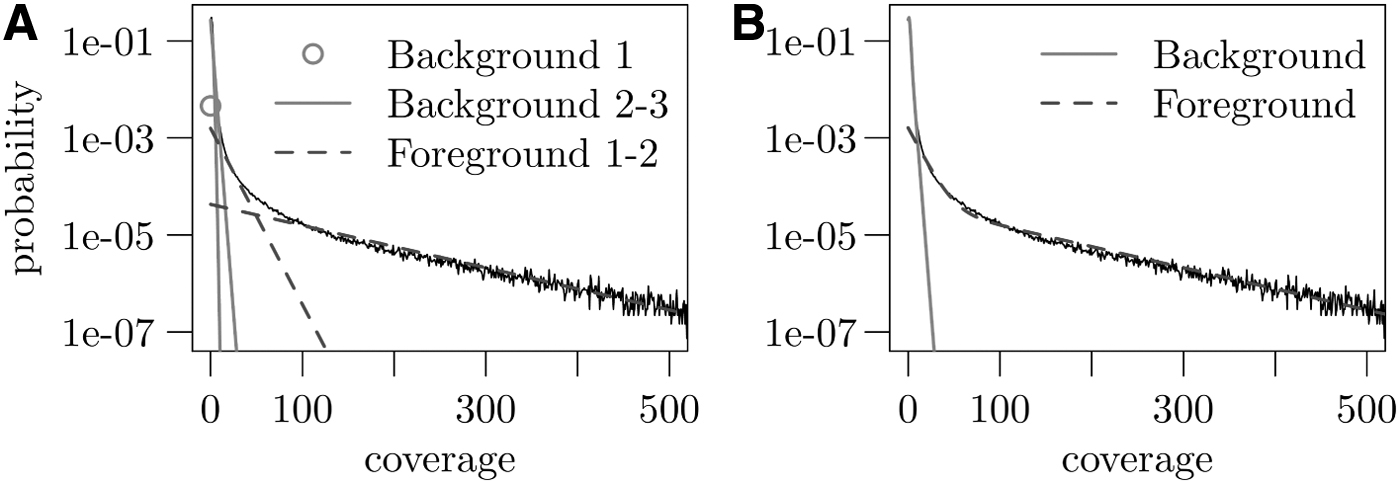
Mixture distribution used to model ATAC-seq data. Both plots show the empirical distribution in black.
Once a mixture distribution for a feature
In this way, a single-feature classifier is constructed for all features. Every such classifier consists of a mixture of Poisson, geometric, and delta distributions.
Multifeature classifiers are defined as simple combinations of single-feature classifiers. Consider the case of active promoters that are known to be accessible and marked by H3K27ac and H3K4me3 as well as a high H3K4me3-to-me1 ratio (H3K4me3/1). A classifier for active promoters should assign high probabilities to regions where those three features co-occur. Therefore, a naive Bayesian promoter model is given by
where
enforces that no peak is observed in the control data set. The classifier can be improved by also considering the spatial structure of features. For instance, histone modifications are typically more broadly distributed than ATAC-seq peaks. For such features it is necessary to also consider surrounding bins and ask for the probability that any one of the bins is enriched. For a feature
where function arguments have been omitted for better readability. Some features may require a more detailed modeling of the spatial structure. For instance, H3K4me1 is symmetrically distributed around regulatory elements as opposed to H3K4me3 that shows a higher enrichment at promoters toward transcribed regions due to its role in preinitiation complex formation (Lauberth et al., 2013). The symmetric structure of a feature is captured by
where
The classifier requires an enrichment at bins
In this manner, a multifeature classifier is constructed for every chromatin state. The classifiers are then assigned to states of the HMM, where some classifiers may also be shared among several states. This is, for instance, the case for the active enhancer states EA,
Multifeature Classifier Definitions
Multifeature Classifier Definitions
✓
c
: bin t is enriched [qt]; ✓
a
: at least one bin out of
As an alternative to the engineered default classifiers we consider a supervised method that models the shape of features around chromatin states (Section 3.4). The method is inspired by DFilter (Kumar et al., 2013), a peak calling method that implements a Hotelling filter. In its essence, the method models foreground and background as multivariate normal distributions, sharing the same covariance matrix. A likelihood-ratio test is then used to call peaks (linear discriminant analysis). We modified the method and used several components for the background distribution. More specifically, at each genomic bin t we consider for all features the observations inside a window of size
where the parameters
where the mixture weights
Results
We compared our method, equipped with its default set of engineered chromatin state classifiers, with two other segmentation methods, namely ChromHMM (Ernst and Kellis, 2012) and EpiCSeg (Mammana and Chung, 2015). ChromHMM is the most popular segmentation method, although it uses Bernoulli emission distributions for which the data must first be binarized into enriched and nonenriched regions. To also incorporate how strongly genomic regions are enriched, EpiCSeg uses negative multinomial emissions. Compared with the multinomial distribution, the negative multinomial better models the variability observed in most ChIP-seq data. We decided to omit a comparison with Segway, since its segmentations are even more fine-grained than those of ChromHMM and EpiCSeg (Hoffman et al., 2012a). We also omit a comparison with ChroModule (Won et al., 2013) since no software package was published by the authors. For all three methods a bin size of 200 bp was used. The ModHMM segmentation is computed as the most likely sequence of hidden states, that is, the Viterbi path. ChromHMM and EpiCSeg use the posterior decoding algorithm to compute segmentations.
We evaluated all three methods on ENCODE (ENCODE Project Consortium, 2012) data from mouse embryonic liver at day 12.5 and embryonic lung at day 16.5. For a first qualitative comparison, Figure 5 shows a small region within chromosome 1 that contains three actively transcribed genes, as indicated by the data. The ModHMM segmentation correctly detects the promoters and transcribed regions. In addition, there is a primed region located in one of the gene bodies. For ChromHMM and EpiCSeg the number of states was determined by maximizing classification performance (Section 3.1). The segmentations of both methods are highly fragmented and much more difficult to interpret. States that appear close to the promoter are also found at the primed region. This is due to the lack of an appropriate model for the spatial distribution of features around regulatory elements. Figure 6 shows state equivalences between the three methods. In general, there is a low overlap between states. Since we used more states for ChromHMM and EpiCSeg, it is clear that a single ModHMM state must be represented by multiple states from ChromHMM and EpiCSeg. However, there are also multiple recombinations, for instance, ChromHMM state 9 corresponds to ModHMM active promoter (PA) and enhancer (EA) states.
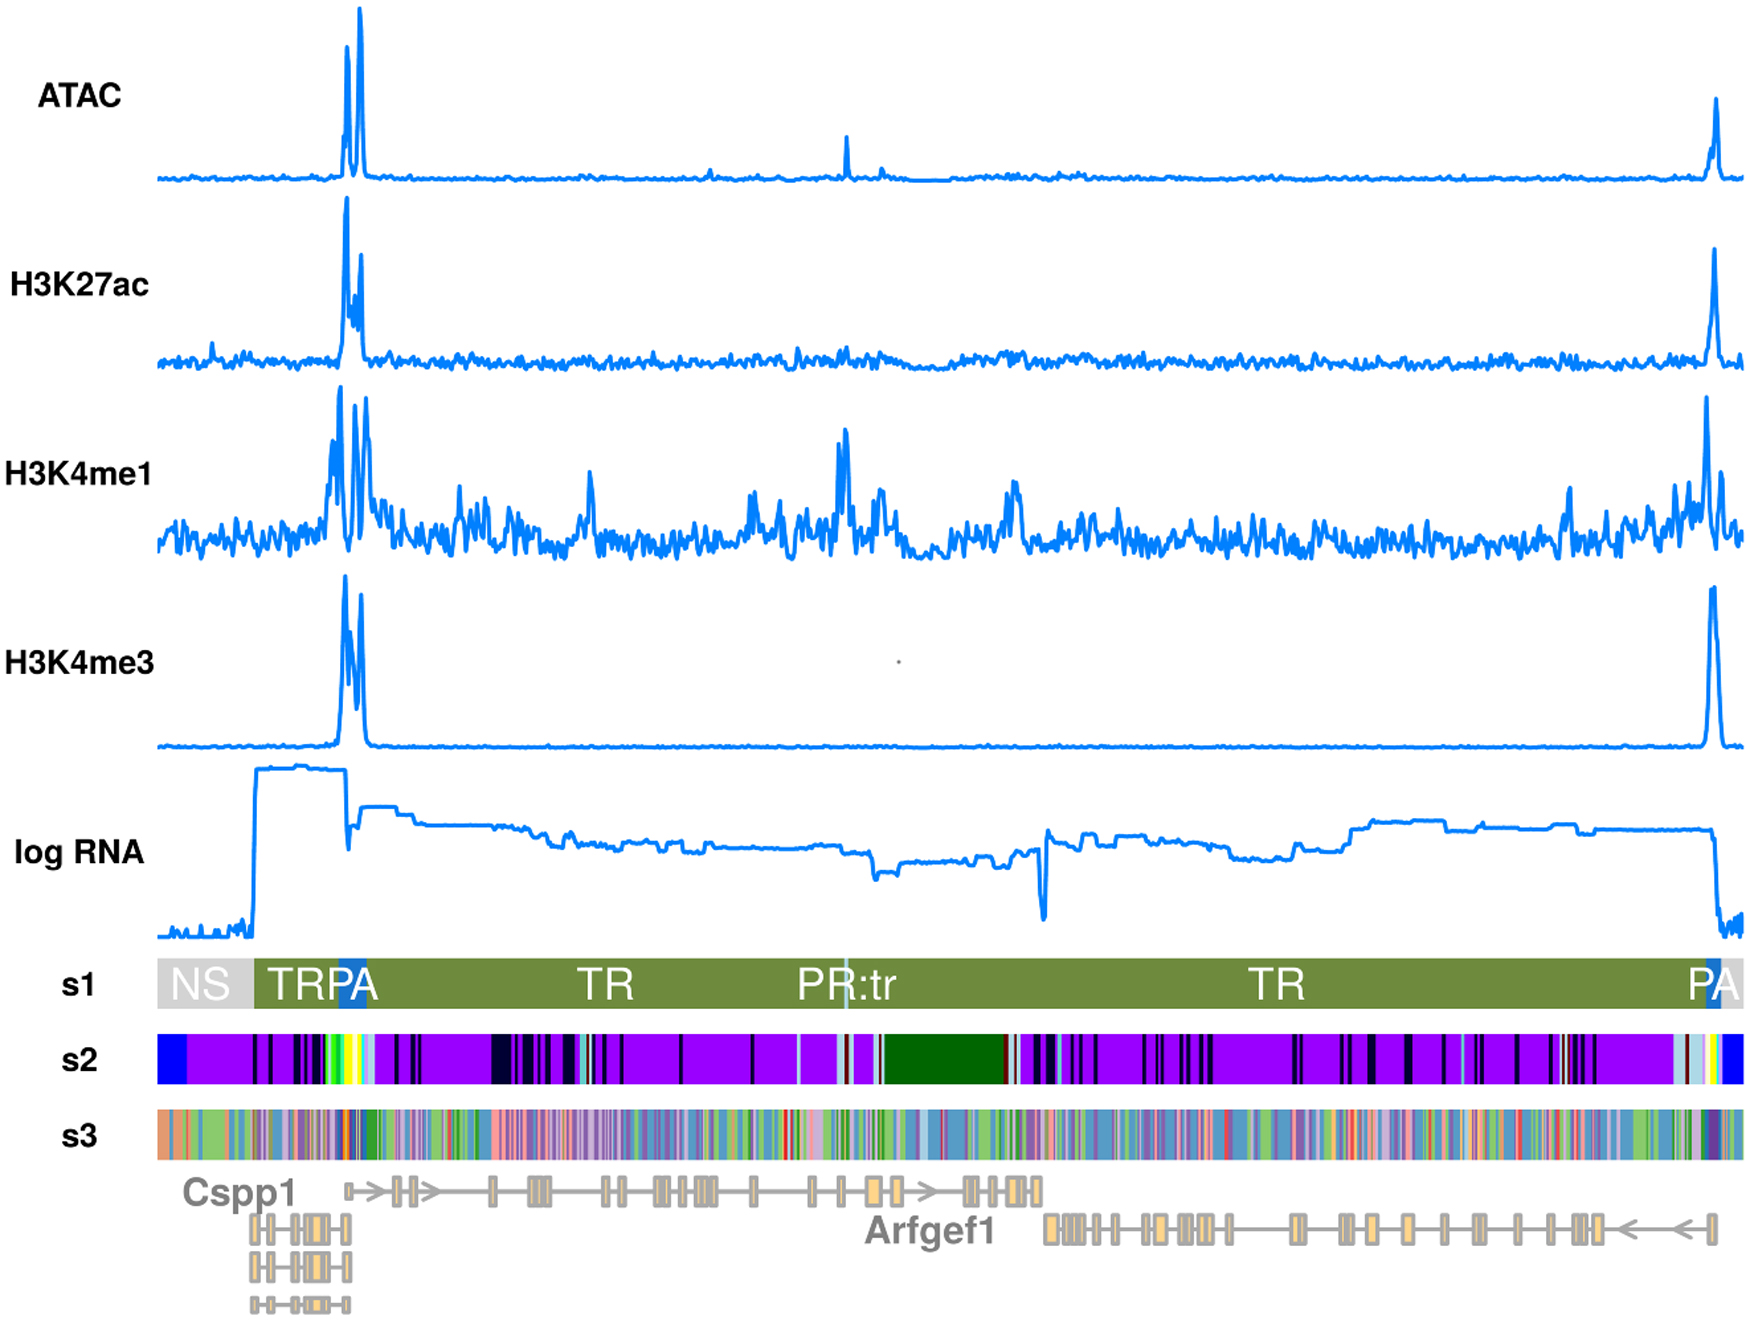
Qualitative comparison of segmentation methods. s1: ModHMM, s2: ChromHMM, s3: EpiCSeg. The primed states of ModHMM within transcribed regions (

State equivalences between ModHMM, ChromHMM, and EpiCSeg. Nodes represent the states of HMMs labeled either by state number (ChromHMM and EpiCSeg) or state name (ModHMM). Arrow widths indicate the fraction of genomic bins shared by two states. Active enhancer (
To compare the predictive performance of segmentation methods we constructed a test set with active enhancers identified by the FANTOM consortium (Andersson et al., 2014). Enhancers are experimentally detected as origins of bidirectional capped transcripts using CAGE (Shiraki et al., 2003). We took all enhancers that showed at least 5 CAGE reads in liver at embryonic day 12 resulting in only 537 regions. With such a low detection threshold on the number of counts many false positives ought to be expected. Indeed, about half of the regions did not show the desired histone modification patterns. To filter false positives, we clustered the enhancer regions using deepTools2 (Ramírez et al., 2016). We dropped all clusters that either showed no histone marks or high levels of H3K4me3, resulting in 265 positive regions. The detection of active enhancers based on chromatin marks is difficult, mostly because promoters show a very similar pattern. Therefore, we constructed a test set consisting of 2650 regions, 1/10th are the filtered FANTOM enhancers, 8/10th promoters, and 1/10th random genomic regions.
ModHMM has a well-defined enhancer state, whereas ChromHMM and EpiCSeg are unsupervised methods where states must be assigned a function after training. This assignment is often difficult especially for EpiCSeg where also the intensity of enrichment is modeled. To avoid wrong assignments, we consider for each model two to three putative enhancer states that are most abundant at the positive enhancer regions. Performance is then evaluated based on these states, including all possible combinations. The best performance is then reported, potentially giving ChromHMM and EpiCSeg a strong advantage over ModHMM.
Results are summarized in Figure 7. For all three methods we used posterior marginals of one or several states to compute precision-recall curves. In addition, we computed the classification performances of Viterbi paths. ModHMM shows the highest area under the precision-recall curve. The best ChromHMM model consists of 22 states and surprisingly outperforms the best EpiCSeg model with 20 states. The Viterbi path of ModHMM optimally balances precision and recall yielding the highest F-score. In contrast, especially the segmentations of ChromHMM show a poor balance of precision and recall with a maximum precision of ∼60%.
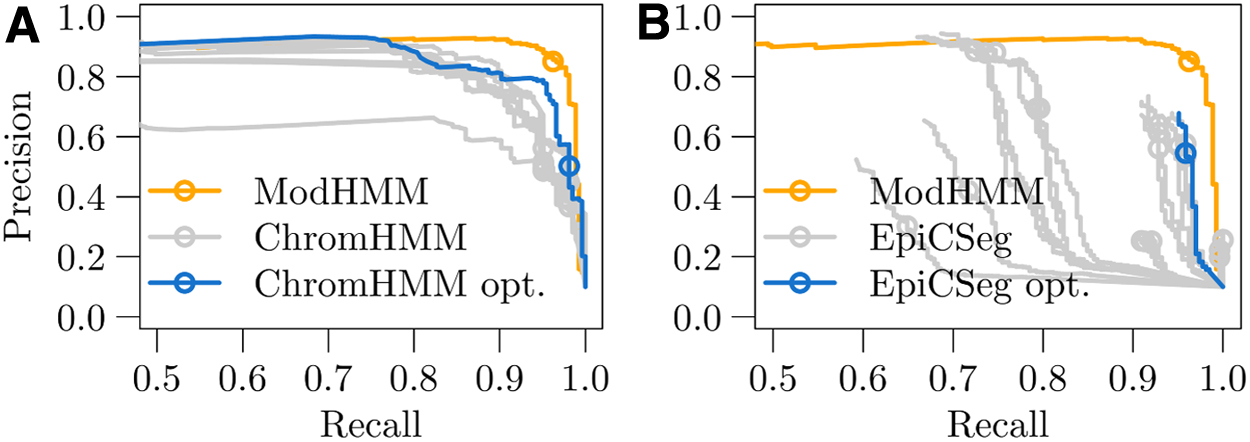
Classification performances of active enhancer regions in mouse embryonic liver at day 12.5.
To understand why ModHMM performs better than ChromHMM and EpiCSeg, we looked at segmentations around active promoters. We used UCSC refGenes to obtain an initial set of transcription start sites (TSSs). Promoters are defined as 2 kbp windows around the TSS. From this set we took regions that have a clear ATAC-seq, H3K27ac, and RNA-seq signal. Regions enriched with H3K27me3 were filtered out. For each segmentation method, we computed at every position relative to the TSS the frequency of every state.
For ModHMM we observe a clear enrichment of the active promoter state (PA) around transcription start sites (Fig. 8). The active transcription state (TR) is flanking this region in most cases, whereas other states are rarely observed. For ChromHMM active promoters are modeled by state 16, which represents enrichment in ATAC-seq, H3K27ac, H3K4me3, and RNA-seq. However, the region represented by this state is much narrower and it is frequently flanked by a diverse set of states. One of them is state 9, which models enrichment in ATAC-seq, H3K27ac, H3K4me1, and H3K4me3. It is also frequently found at enhancers that show enrichment in H3K4me3 above the binarization threshold set by ChromHMM. The situation is similar for EpiCSeg; however, the promoter is fragmented into several states modeling different levels of ATAC-seq and H3K4me3 enrichment. State 2 is frequently flanking promoters, which also occurs at enhancers since it models enrichment in ATAC-seq, H3K27ac, and H3K4me1, but low enrichment in H3K4me3. Peaks of H3K4me3 tend to be more localized than H3K4me1 peaks, so that regions close to promoters typically show characteristics of enhancers. Both ChromHMM and EpiCSeg do not model the spatial distribution of features around promoters and enhancers and, therefore, often fail to correctly discriminate between them.
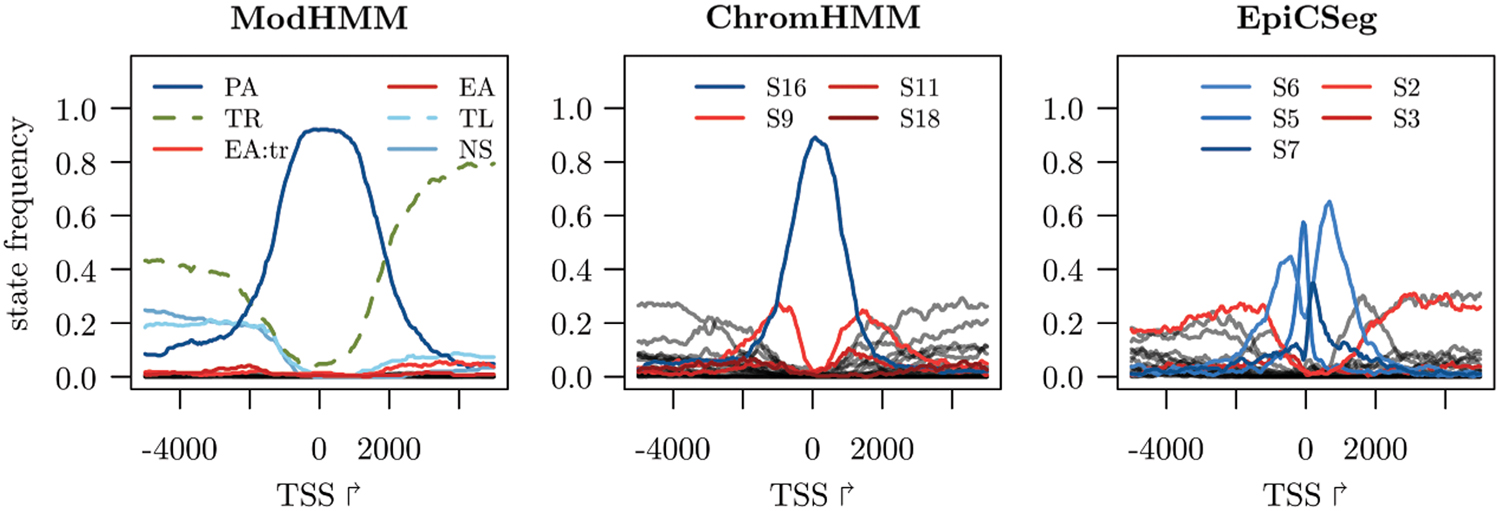
State frequencies at promoters. Promoters that belong to genes on the reverse strand are inverted so that the gene body is right of the TSS. For ChromHMM and EpiCSeg, states that are frequently observed at enhancers are in red. The ModHMM state EA:tr refers to both active enhancer states (
During the development of ModHMM, we observed that the H3K4me1-to-me3 ratio has low predictive power for discriminating between bivalent promoters and poised enhancers. This led us to represent both chromatin states by a single bivalent state. To quantify this observation, we consider all bivalent regions in the ModHMM segmentation of mouse embryonic liver at day 12.5. The H3K4me1-to-me3 ratio is then used to separate promoters from the remaining regions (i.e., putative poised enhancers). All bivalent regions overlapping annotated UCSC refGene promoters (500 bp regions around transcription start sites) are defined as true positives. This leads to an area under the precision recall curve (PR-AUC) of ∼0.84. The minimal PR-AUC achieved by a random classifier is ∼0.63. As a comparison, we took all regions of the ModHMM segmentation that are either labeled as active promoter or enhancer. Here, the same procedure leads to a PR-AUC of ∼0.96, whereas a random classifier achieves a performance of 0.46.
Supervised cross-tissue enhancer predictions
The modular structure of ModHMM allows us to gradually improve the segmentation by replacing single classifiers. Here, we graft a supervised classifier into ModHMM that models the shape of features at enhancers (Section 2.4). We use the FANTOM enhancers from embryonic liver at day 12.5 as training set and test the method on lung at day 16.5, for which a validation set has been generated in the same way (Section 3.1).
Typically there is much variability between data sets, which prevent a direct application of the model to different tissues. In most cases it would be necessary to re-estimate the parameters of the single-feature classifiers. Owing to the uniform experimental protocols and processing steps of ENCODE data we may, however, skip this step. Still, there remain some statistical differences between the data sets that we remove by quantile normalizing (Amaratunga and Cabrera, 2001; Bolstad et al., 2003) the coverage values of each feature.
To establish a baseline, we first tested how well ModHMM with its default chromatin state classifiers performs across tissues. We also trained a ChromHMM and EpiCSeg model on data from embryonic lung at day 16.5. However, we kept for both methods the number of states that was optimal for the liver data set. Compared with the liver data, the classification performance of ModHMM dropped slightly, but also the optimal combination of states for ChromHMM and EpiCSeg showed a much lower classification performance (Fig. 9A). Next, we tested the classification performance of the supervised shape classifier for which we used a window size of 10 bins and ATAC-seq, H3K27ac, H3K4me1, and H3K4me3/1 as well as the control data as features. In general, the performance of the shape classifier is better than the engineered classifier (Fig. 9B). Integrated into ModHMM the performance stays approximately the same, showing that other classifiers do not interfere.
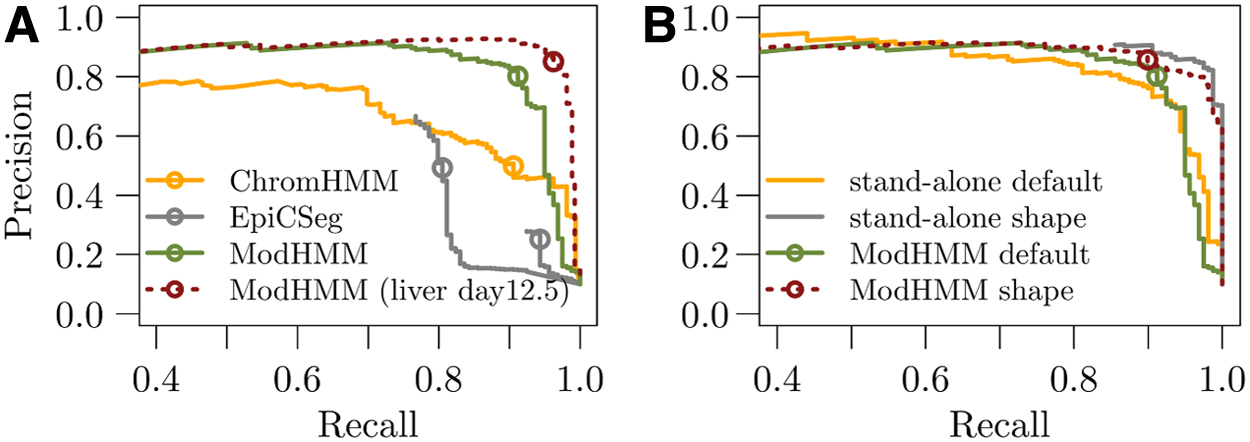
Cross-tissue predictive performance.
ENCODE BAM accession numbers are given in Table 2. For embryonic lung at day 16.5 no ATAC-seq BAM files were available. We downloaded fastq files from ENCODE with accession nos. ENCFF577XAL, ENCFF224TAO, ENCFF872IZI, and ENCFF427HTC. Bowtie2 (Langmead and Salzberg, 2012) was used to align reads to the reference genome mm10. Picard and samtools (Li et al., 2009) were used to mark and filter duplicates.
ENCODE BAM File Accession Numbers
ENCODE BAM File Accession Numbers
ENCODE data are available as either single- or paired-end. ATAC-seq data were generated using paired-end sequencing; however, since we are only interested in accessible regions we treated it as single end. For histone modifications single-end sequencing was used. We processed this data by first estimating the fragment length with a cross-correlation analysis of forward and reverse strand reads. Afterward, reads are extended in 3′ direction to match the estimated fragment length. No special processing of RNA-seq data was required.
The coverage Cn of each feature is computed by first tiling the genome into a set of bins of size n. Given a set of reads R, for each
The feature H3K4me3/1 was computed from the coverages of H3K4me1 and H3K4me3. At bin t the ratio is given by
where
Traditional genome segmentation methods, such as ChromHMM, EpiCSeg, or Segway, are unsupervised methods and can be used to detect known and unknown patterns in genomics data. They have been extensively used in the past to analyze the epigenetic landscape of a large variety of cell types and tissues (Hoffman et al., 2012b; Kundaje et al., 2015; Ernst and Kellis, 2017). However, nowadays much is known about the epigenetic landscape and the features that mark regulatory elements. This extensive knowledge questions, at least to some extent, the traditional approach to genome segmentation. Instead, we used this knowledge to construct a segmentation method that outperforms the traditional methods in several aspects. ModHMM has a higher prediction accuracy and the segmentations show a better balance of precision and recall. With each hidden state of ModHMM a classifier is associated that detects a well-defined chromatin state. This leads to segmentations that are superior in qualitative aspects. Functional elements, such as active promoters or enhancers, are typically contained in a single segment, which is not the case for ChromHMM and EpiCSeg.
Inspired by the supra-Bayesian approach, ModHMM integrates predictions of a set of experts or classifiers. Using the output of classifiers as input to the HMM has certain advantages over classical HMMs that model observations directly. For instance, a classifier may cherry-pick only a subset of the available data. The coverage of RNA-seq reads in a single genomic bin already provides enough information to decide whether the region is transcribed. In contrast, classification of active promoters and enhancers requires data from multiple features and several surrounding bins.
ModHMM uses a default set of engineered classifiers to detect chromatin states. The basis of which is a single-feature enrichment analysis with a mixture model tailored to each feature. This is unique to ModHMM as most peak calling methods implement a single model. Applying ModHMM to a new data set requires to perform the enrichment analysis de novo. Alternatively, ModHMM may quantile normalize a new data set to a known reference for which single-feature models already exist. We have shown on different tissues that this approach leads to good results. Unlike ChromHMM and EpiCSeg, ModHMM has well-defined hidden states that do not change when applied across different cell types or tissues. This makes ModHMM ideal for differential analysis.
Compared with traditional segmentation methods, ModHMM is much more flexible and provides many leverage points to construct high-quality segmentations. For instance, any of the chromatin state classifiers from the default set can be replaced by more accurate alternatives, allowing to incorporate predictions from state-of-the-art methods such as REPTILE (He et al., 2017). To improve a given segmentation, ModHMM allows visual inspection of all classifier predictions, which may serve as a powerful tool to decide which classifiers must be replaced. The software is freely available at (https://github.com/pbenner/modhmm).
Footnotes
Acknowledgments
We thank Anna Ramisch, Tobias Zehnder, and Verena Heinrich for their comments on the article and many inspiring discussions.
Author Disclosure Statement
The authors declare they have no competing financial interests.
Funding Information
P.B. was supported by the German Ministry of Education and Research (BMBF, grant no. 01IS18037G).