
Abstract
Parkinson's disease (PD) is the second-most common neurodegenerative disorder, and the actual cause of this disease is still unknown. Identifying the target genes that are associated with disease plays an essential role in the treatment of PD. Various genetic studies have determined the significant target genes for disease progression, although this continues to be challenging in the field of drug designing. In this study, we proposed a network-based approach to identify target genes for PD using gene mutation, gene expression, and gene deletion analysis. The subnetwork of PD genes was constructed from human protein–protein interaction network, and the potential genes were identified using network centrality measures. Two genes, PARK1 and PARK2, were identified as target genes by integrating gene mutation and expression data into the subnetwork. Gene deletion analysis was carried out to determine the significant target, and results revealed that VDAC1 and ATP5C1 genes were crucial for the Parkinson's subnetwork. Thus, findings from the network-based approach will provide additional insight for understanding the disease mechanism of PD. Future enhancement of this study may help in predicting disease biomarkers as well as designing novel compounds in rational drug designing.
1. Introduction
Parkinson'
Network-based approaches are new techniques that help in understanding many biological problems through system biology. The networks, in general, deal with connected elements and the mutual relationship between them; analysis of such networks will provide system-level understanding (Altaf-Ul-Amin et al., 2014). There are several biological events where scientists modeled biological systems such as transcriptional regulation networks, protein–protein interaction (PPI) networks, and gene expression networks using different mathematical approaches (Liu et al., 2018). The analysis of network approaches has been used in various applications such as function prediction, protein complex detection, prediction of interaction, analyzing the evolution, information integration, and determination of essential entities (Altaf-Ul-Amin et al., 2014). Moreover, network-based approaches were utilized as a significant method for disease diagnosis through gene mutations and gene expression data. In recent years, the construction and analysis of biological networks have become highly popular among researchers.
Targeting disease genes are becoming a new trend in disease progression and diagnosis. Several studies focused on the identification of causative factors and molecular markers of PD and differentiated their gene functions among healthy and diseased conditions. For PD, extensive data were deposited in the public database, which includes expressed genes under various conditions, different nutrients, and growing stages and symptoms (Kanehisa, 1996; Moran et al., 2006). In recent years, network-based approaches in neurodegenerative diseases have become very popular for identification of genes that trigger the progression of the disease. Thus, analyzing PD through network approaches offers a vast opportunity to study the topographic properties of several genes rather than a single gene at a time. Current research on exploring the core molecular machinery of the complex diseases is being achieved by interpreting the interactions among genes through the PPI network (human connectome) (Calvano et al., 2005; Vidal et al., 2011; Cho et al., 2012; Sevimoglu and Arga, 2014). Several genetic studies are shown to be successful in the identification of target genes that are responsible for PD progression, whereas only a few studies have utilized the network-based approach (Hardy, 2010; International Parkinson Disease Genomics Consortium et al., 2011; Klein and Ziegler, 2011; Brás et al., 2015).
In the present study, we attempted a novel method to find the target genes through network-based gene mutation and gene expression analysis in PD. Kyoto Encyclopedia of Genes and Genomes (KEGG) pathway database was used to identify those disease-gene associations, and the subnetwork for PD was determined from the Homo sapiens PPI network. Using gene mutations from the Single Nucleotide Polymorphism database (dbSNP), 88 genes were selected, and from the Gene Expression Omnibus (GEO) database (GDS3128), 7365 genes were selected from the list of 10,285 genes of H. sapiens PPI network. To identify the potential targets, we calculated the network properties for each gene, and the genes with above-average values were considered in degree, betweenness centrality, and closeness centrality. Finally, gene deletion analyses were carried out to distinguish the potential target genes. This network approach could be used to prioritize and identify the target genes in PD progression.
2. Methods
2.1. Data set
The H. sapiens PPI network was downloaded from the Biological General Repository for Interaction Data sets (BioGRID) (www.thebrid.org) (Breitkreutz et al., 2003; Stark, 2006). The number of genes involved in the PD pathway was obtained using the KEGG database (Kanehisa, 1996). From GEO (https://www.ncbi.nlm.nih.gov/geo), GDS3128 (Moran et al., 2006) was considered that includes 29 PD and 18 control samples using GPL96 (Affymetrix Human Genome U133A Array) and GPL97 (Affymetrix Human Genome U133B Array).
2.2. PPI network
The two PD subnetworks were determined from the H. sapiens PPI network for gene mutation and gene expression analysis. These subnetworks were analyzed using Cytoscape 3.6.1 (Shannon, 2003).
2.2.1. Gene mutation PPI network
From 10,285 genes, in the human PPI network, the KEGG pathway genes were used to construct the PD subnetwork, which involves 88 genes. The coding mutations for each gene were obtained from the dbSNP database (Sherry, 2001), and then, this subnetwork was considered for further analysis.
2.2.2. PPI network for gene expression analysis
From the data set of GDS3128 soft file, the gene IDs with expression values in the standardized matrix files were downloaded from GEO. The nonmatched gene symbols were removed to create a data set containing 22,283 rows with expression values for each sample. In this study, 29 PD samples with gene expression values were screened. The PD-expressed gene subnetworks were derived from the H. sapiens PPI network. The same genes with different expression values were averaged, and this value was used as the final expression level for the particular gene. To create the PD subnetwork, we have selected PD pathway genes in the human PPI network. The GEO-based gene expression data set was used to develop the PD subnetwork, which contains 7365 gene IDs, and the disease pathway gene IDs containing 72 genes were selected in subnetwork for gene expression analysis.
2.3. Analysis of network topological parameters
The disease mechanism of the functional proteins can be easily understood by analyzing the H. sapiens PPI network and their network topological properties. The graph-theoretical properties were used to determine the potential target genes using genetic mutations and gene expression values. The following network parameters such as hubs, centrality, shortest pathlength, and clustering coefficient were evaluated using the Java-based network analyzer plugin Cytoscape (Doncheva et al., 2012). The shared and unique genes among the different sets of genes were identified using Venn and Euler diagram plugin in the PPI network (Wilkinson, 2010).
2.4. Computational workflow for determining significantly mutated genes
2.4.1. Workflow for gene mutation analysis
The frequently mutated genes that are involved in the PD pathways were identified from the dbSNP database. The ratio of Single Nucleotide Polymorphism (SNP) count and gene length was taken to represent the normalized mutation counts. The PD subnetwork was derived from a human PPI network, and then, the topological parameters such as degree, closeness centrality, and betweenness centrality were calculated. The genes with above-average values were considered significant genes among all the parameters, and the shared genes were determined using Venn and Euler diagrams. Finally, the target genes were derived, which are found to be the common genes in hubs, closeness, and betweenness centrality.
2.4.2. Workflow for gene expression analysis
The GEO data set (GDS3128) was used to identify the expressed genes in PD, which contains 29 PD samples with expression values of 22,283 genes. In this data set, some genes showed repetition with different expression values. Thus, these genes with varying amounts of expression were averaged to determine the expression value for the particular gene. Then, finally 13,302 unique genes were used to identify the subnetworks from the H. sapiens PPI network. From these individual genes, we considered only KEGG pathway genes for PD subnetwork, and that generates 72 genes in the subnetwork. The degree, closeness, and betweenness centrality values were calculated, and the genes with above mean values were retained as significant genes. Thus, the common genes that are observed in hubs, closeness, and betweenness centrality were considered potential target genes.
2.4.2.1. z-Score calculation
The z-score was used to calculate the statistically significant genes, and it is calculated using the following formula
where x denotes the value of gene mutation or expression value,
3. Results and Discussion
3.1. Construction of PD subnetworks
In this study, the target genes that are responsible for dopamine loss were identified using gene mutation and gene expression data. To accomplish this, we derived two subnetworks one with using coding mutation and the other with gene expression values. The human PPI network is represented in Figure 1a, where the blue color represents the nodes that are labeled with the NCBI gene id, and the edges are colored in grayscale. Figure 1b denotes mutation subnetwork, and Figure 1c signifies the subnetwork using gene expression. The node and edge details for these subnetworks are shown in Table 1. The topological property analyses of PPI network help us to understand the structure and function of the network (Knudson, 1971). Thus, many other analyses include protein target selection or identification of critical nodes, the association of cellular systems with their fundamental principles, and the scale-free nature of PPI networks (Vazquez et al., 2003; Assenov et al., 2008; Doncheva et al., 2012). Basically, the scale-free network follows the small-world properties where the clustering coefficient (C) is high and low shortest pathlength (L). The L and C values for the human PPI network also followed small-world properties and values were found to be 4.307 and 0.110, respectively. Moreover, the scale-free networks are strong against random networks but highly unsafe to targeted attacks (Barabási and Albert, 1999).
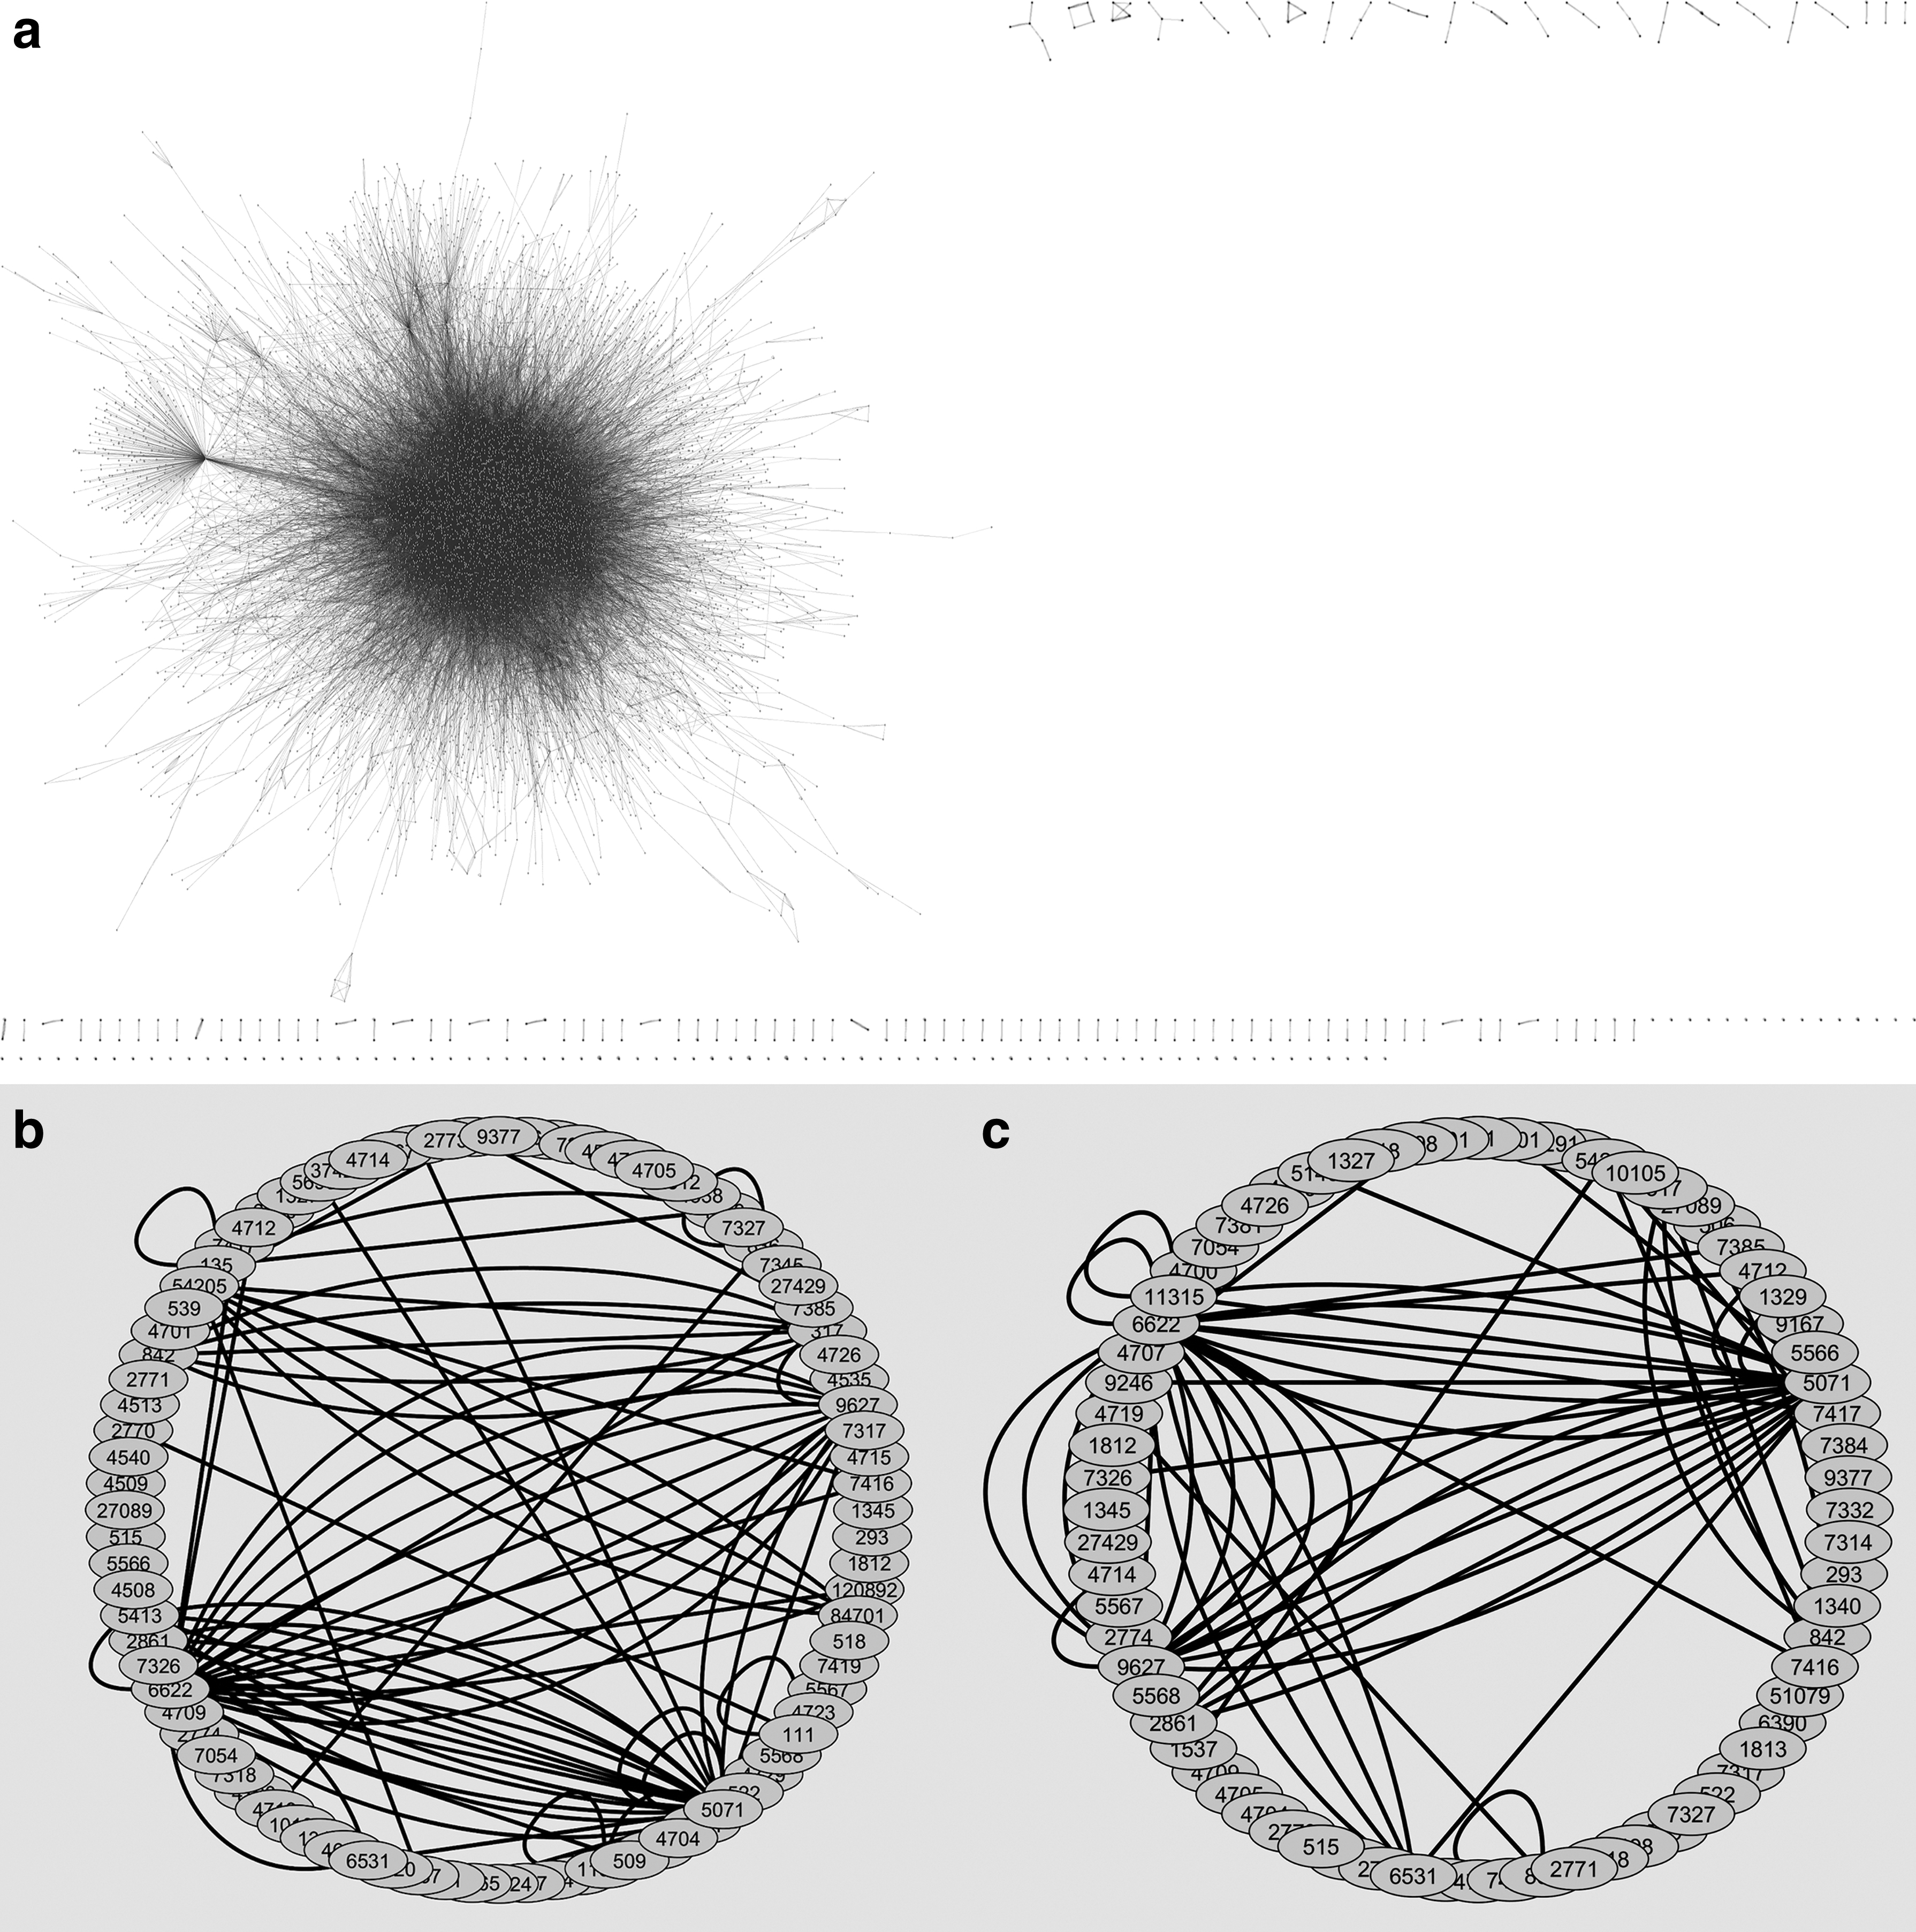
Protein–protein interaction networks.
Network Parameter Values for Human Protein–Protein Interaction Network and Subnetworks Including Mutated and Expressed Genes
PPI, protein–protein interaction.
3.2. Target gene identification through gene mutation
The human interactome (PPI) was used to identify the target genes derived from the subnetworks in PD. Network topological parameters such as hub, betweenness, and closeness centrality values were calculated for all the genes involved in the disease pathway. To filter the significant genes, we considered the genes whose network parameter values are above average in the PD subnetwork. The average value of hubs (Fig. 2a) was found to be 7.21 ± 8.26. The closeness (Fig. 2b) and betweenness (Fig. 2c) centrality values were ranging from 0.6 ± 0.31 and 0.29 ± 0.24, respectively. The coding mutations for all the genes were determined from the dbSNP database, and the significantly mutated genes were calculated using the z-score. From Figure 2, we observed that seven genes were found to be common in all the three network parameters, and those genes are UQCRC1, QCR2, APAF1, VDAC1, CYC, PARK1, and PARK2. Among all these seven genes, PARK2 gene has the highest degree value, and PARK1 contains the highest values in both closeness and betweenness centrality. Whereas in the case of mutation z-score, the UQCRC1 gene has a maximum score, but PARK1 and PARK2 have a negative score. The z-score with positive and negative scores indicates that the genes are above and below the mean values, respectively. From the z-score calculation, these high positive values and high negative values identify the genes that are crucial in the subnetwork. Thus, network measures, as well as gene mutations, play a vital role in identifying the target genes.
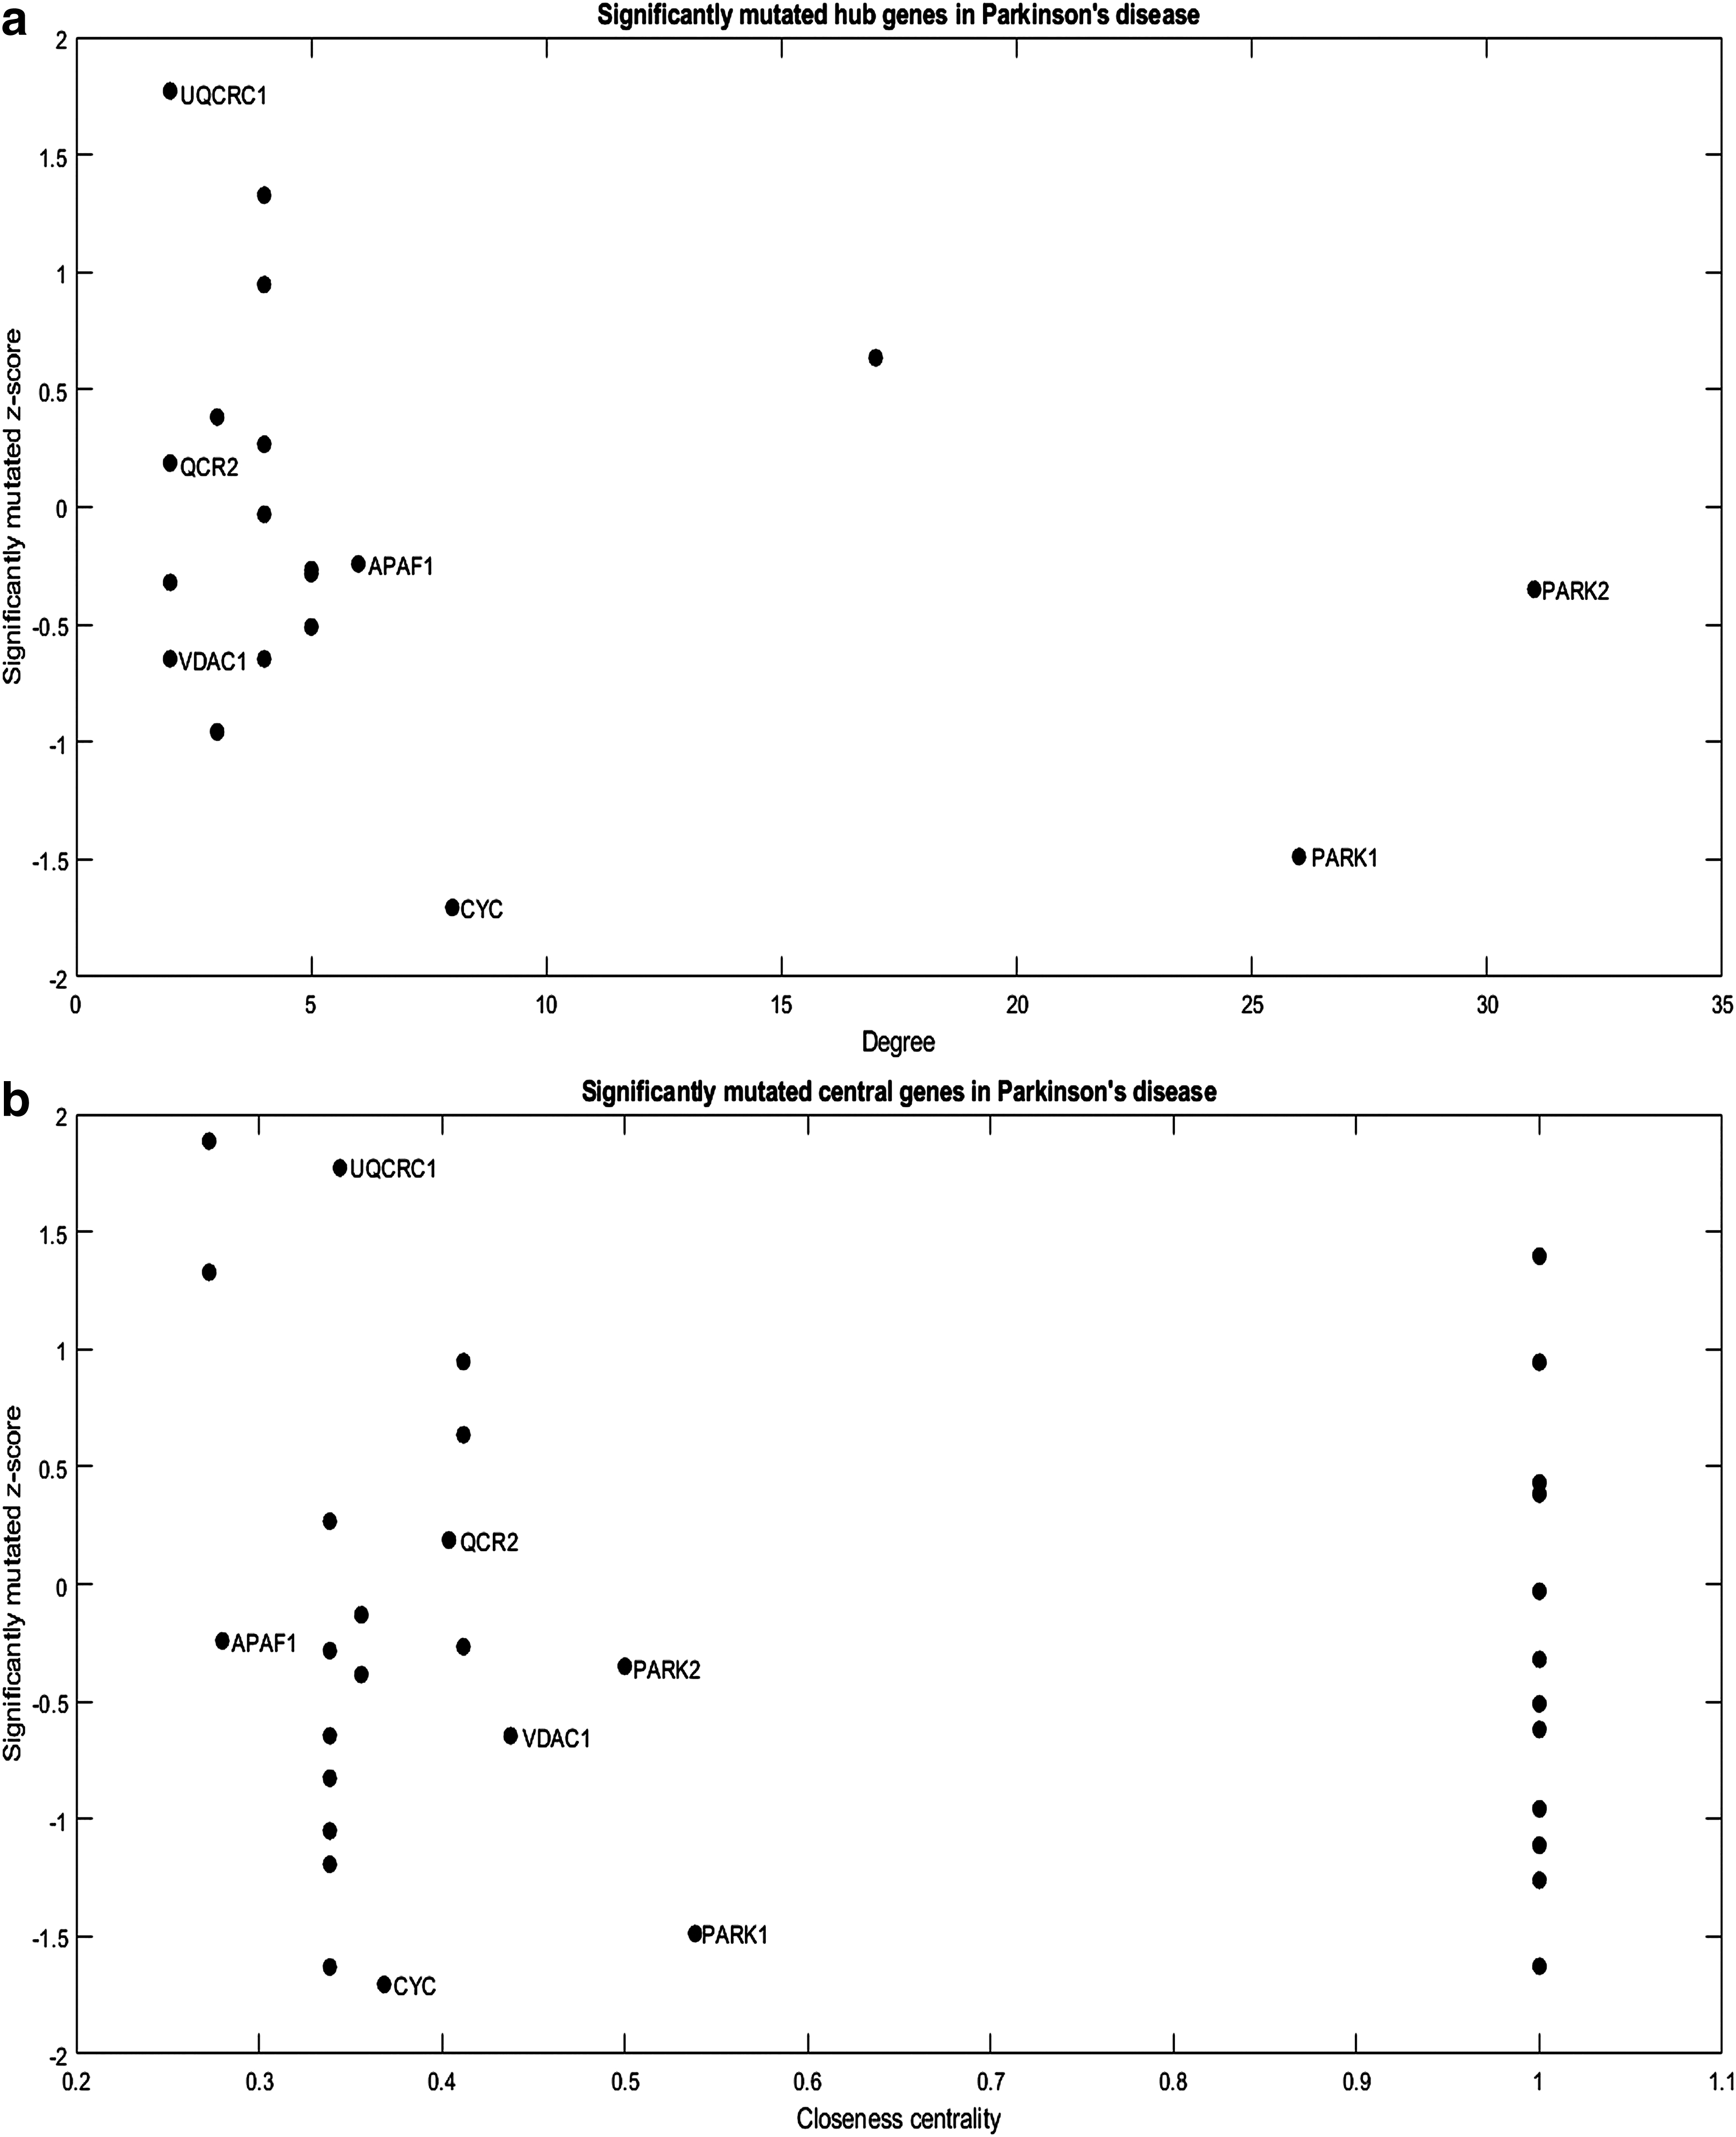
Distribution of significantly mutated genes in PD from network measures.
Several studies have reported that these genes are very much correlated for the cause of PD. Lin et al. (2019) have identified a potential novel mutation in the UQCRC1 gene via whole-exome sequencing analysis, which was found to be responsible for familial parkinsonism. Moreover, mitochondrial dysfunction has been associated with contributing to neurodegeneration (Park et al., 2009). Several studies have reported that gene UQCRC2 can be used as a candidate biomarker through the immunoblotting method and mitochondrial DNA sequencing analysis (Tzoulis et al., 2013; Grünewald et al., 2016; Picca et al., 2019). The nigrostriatal degeneration in PD is mainly caused by mitochondrial dysfunction and apoptosis. Basically, apoptosis is a form of programmed cell death, which is responsible for removing damaged or unnecessary cells in multicellular organisms (Rasheed et al., 2017). Various types of apoptosis are induced by cytochrome c (CYC) release from mitochondria. APAF1 (apoptotic protease activating factor 1) is a key gene in the mitochondrial pathway of apoptosis, which oligomerizes in response to CYC release and forms a large complex known as apoptosome (Shakeri et al., 2017). The antimitochondrial apoptotic gene therapy was used to prevent nigrostriatal degeneration, and they inferred that delivery of APAF1 dominant negative using the adeno-associated virus vector system could be a promising therapeutic strategy for PD patients (Mochizuki et al., 2001).
Furthermore, the misfolding of α-synuclein and mitochondrial dysfunction are also responsible for PD. One such study reported that voltage-dependent anion channel 1 (VDAC1) gene plays a significant component in the outer mitochondrial membrane, which regulates mitochondrial functions (Chu et al., 2014). The principal isoform VDAC1 represents the leading mitochondrial docking/binding site of misfolded proteins, such as α-synuclein in PD. The association of misfolded proteins with VDAC1 has a substantial impact on both cellular bioenergetics and apoptosis pathway change. Therefore, VDACs represent a promising therapeutic target in neurodegeneration (Magri and Messina, 2018). In addition to this, CYC interacts with mitochondria in Lewy bodies to promote their aggregation, as well as activating cell death pathways. This suggests that mitochondrial dysfunction has a role in the development of pathologic protein inclusions in PD (Mounsey and Teismann, 2011).
PARK1 is considered the major causative gene involved in the early onset of familial PD, and findings suggest that the five missense mutations are responsible for autosomal dominant PD (Jiang et al., 2011). Another study has confirmed that the exon four mutation in PARK1 gene is an important pathogenic mutation for PD through gene identification and sequencing techniques (Siddiqui et al., 2016). Several studies infer that the autosomal recessive form of PD is caused by a PARK2 mutation, which results in early-onset loss of dopaminergic neurons in the substantia nigra (Mizuno et al., 2001; Veeriah et al., 2010; Ivashynka and Likhachev, 2017). The stem cell-based experiment has characterized the level of pro- and antiapoptotic factors in Bcl system with PARK2 mutations. The findings revealed that PARK2 mutations are accompanied by an imbalance in programmed cell death systems where nonapoptotic molecular mechanisms play a major role (Konovalova et al., 2015). From the above discussion, we suggest that the genes with high-degree, high-centrality, and high-mutation z-score play a vital role in identifying the target genes in PD progression. Interestingly, these three genes, PARK2, PARK1, and UQCRC1, are found to be localized in cell membranes.
3.3. Target gene identification through gene expression
On analyzing the PD subnetwork, as shown in Figure 3, five genes were found to be common in all the network parameters, and the genes are GNAI2, ATP5C1, PARK1, PRKACA, and PARK2. The hub genes with significantly expressed value (Fig. 3a) in the PD were in the range 29.95 ± 20.62. The closeness centrality score (Fig. 3b) for all the significantly expressed genes was found in the range 0.27 ± 0.02; similarly, for betweenness centrality (Fig. 3c), the values were ranging 0.002 ± 0.0016. From this gene expression subnetwork, we determined the upregulated and downregulated genes through z-score for disease progression. Among the five differentially expressed genes, three genes were positive z-score (upregulated), and two were negative z-score (downregulated). The upregulated genes are ATP5C1, GNAI2, and PARK1, and the downregulated genes are PARK2 and PRKACA. On the contrary, from network measures, PARK2 and PARK1 genes were found to have the highest values in degree, closeness centrality, and betweenness centrality. The PARK2 was found to be downregulated and PARK1 was upregulated in the PD subnetwork. In short, results conclude that PARK2 and PARK1 were considered target genes through gene expression subnetwork study for PD.
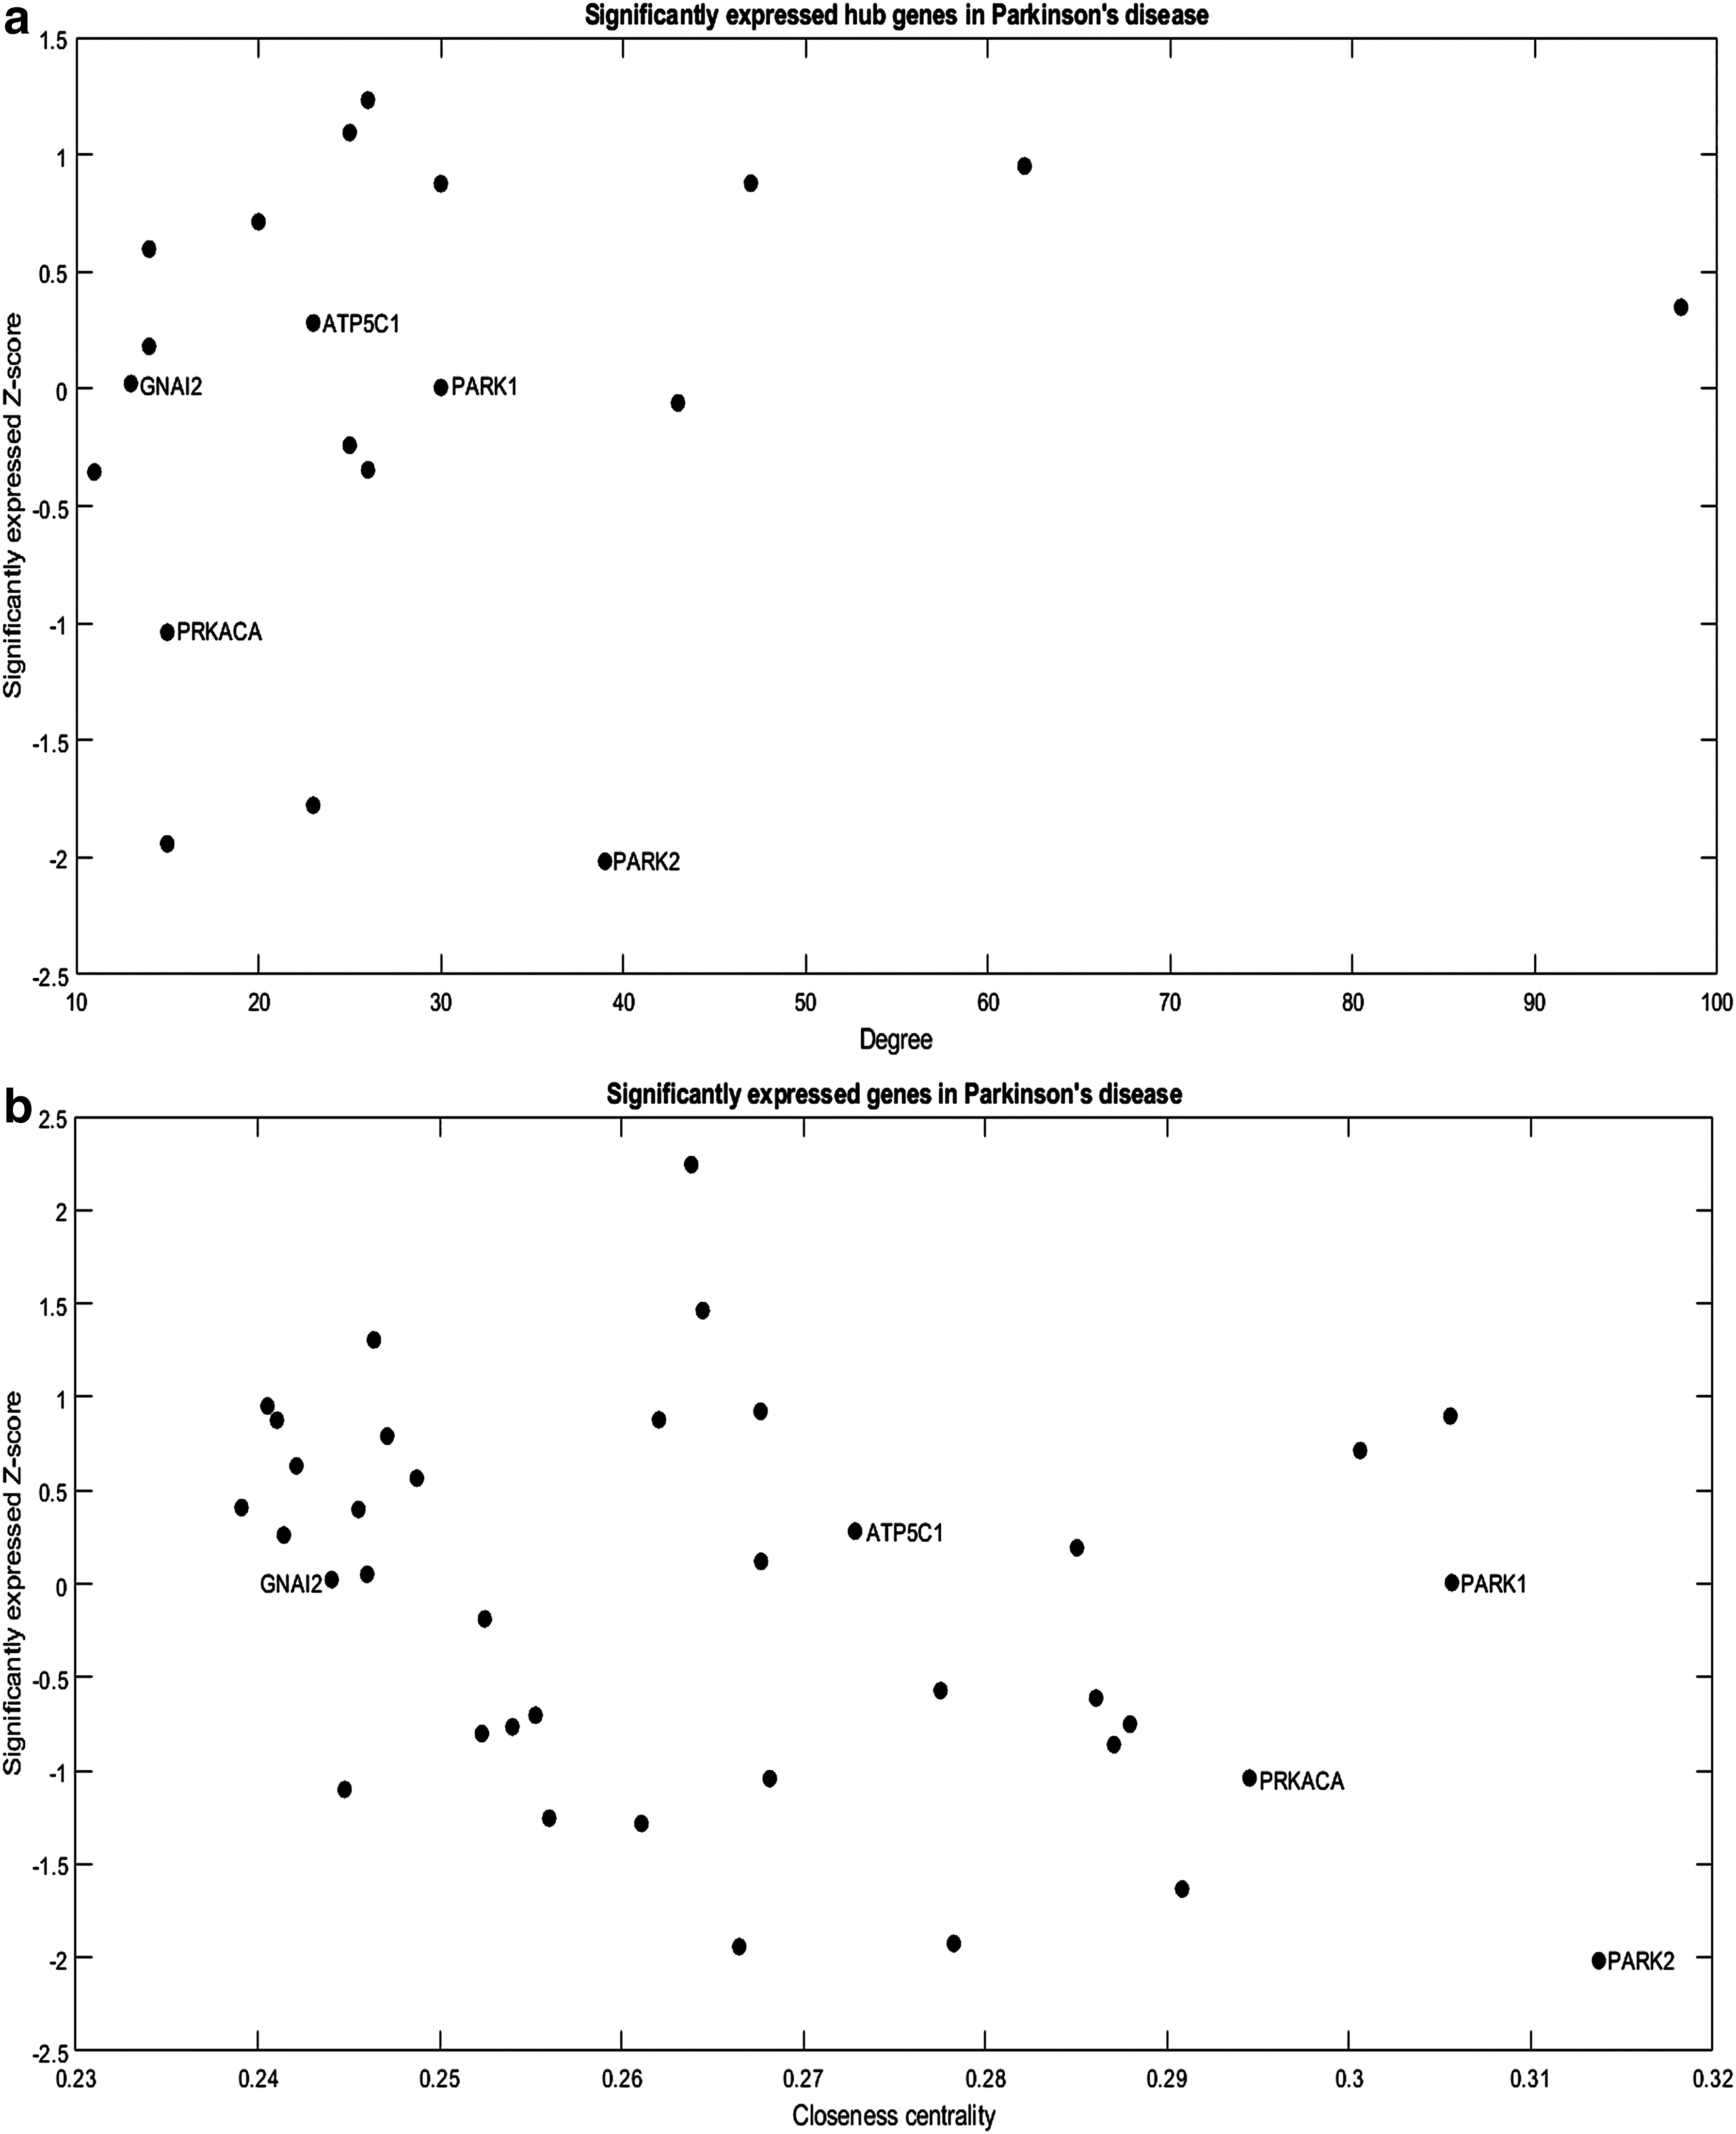
Significantly expressed genes toward PD.
In biological research, the study of expressed genes has a more significant impact as they are basic functional units of genomic DNA (Martin and Pardee, 2000). Many databases contain information about gene expression for human and mouse genes. From those genes, the crucial genes for disease progression can be identified using various computational or hybrid methods. Several studies have used gene expression data for identifying the target genes in PD through multiple approaches. Hub genes for PD have been identified through gene coexpression network, gene regulatory network, and INcRNA-mediated regulatory network from expression data (Chatterjee et al., 2017). For early diagnosis of PD, the functional enrichment analysis and PPI network were developed to find out critical miRNA and target genes from the gene expression profile (Liu et al., 2019). Furthermore, whole-blood gene expression and DNA methylation data were also utilized to determine the gene signature biomarkers in PD using data integration analysis (Wang et al., 2019). Thus, to identify the target genes in PD, these studies have examined the expression data using the network approach, functional enrichment analysis, and data integration analysis.
Specific genes have shown to be low in expression or only expressed in particular cell types, developmental stages, or growth conditions. Such genes play a vital role in many cellular functions, including key regulatory factors, developmental progression, or cell growth regulation. In this study, gene expression data were used to identify the responsible genes in PD using a network approach. Findings suggest that the PARK1 and PARK2 genes were determined as target genes for disease progression as they possess high values in centrality as well as in the hub genes.
3.4. Gene deletion analysis in gene mutation and gene expression subnetworks
From the above analysis, we determined seven significant genes from gene mutation subnetwork and similarly five genes from gene expression subnetwork. In this section, gene deletion analysis was performed to identify the target genes. After the gene deletion task, the consequences of network structure were analyzed based on the variations of the network parameter values. Changes in the network parameters such as clustering coefficient (C) and shortest pathlength (L) indicate that the network is highly robust by removing nodes or genes. The individual genes and their links were removed from the subnetwork to determine the potential target genes in both subnetworks. All the genes were having a low clustering coefficient and high shortest pathlength, simplifying the small-world property of a network. Finally, the target genes were selected with high C, and high L values were found to be disrupting the PD subnetworks, as shown in Figure 4. Results suggest that the VDAC1 gene has shown a considerable role as a potential target gene in the gene mutation subnetwork (Fig. 4a) whereas ATP5C1 in the gene expression subnetwork (Fig. 4b).
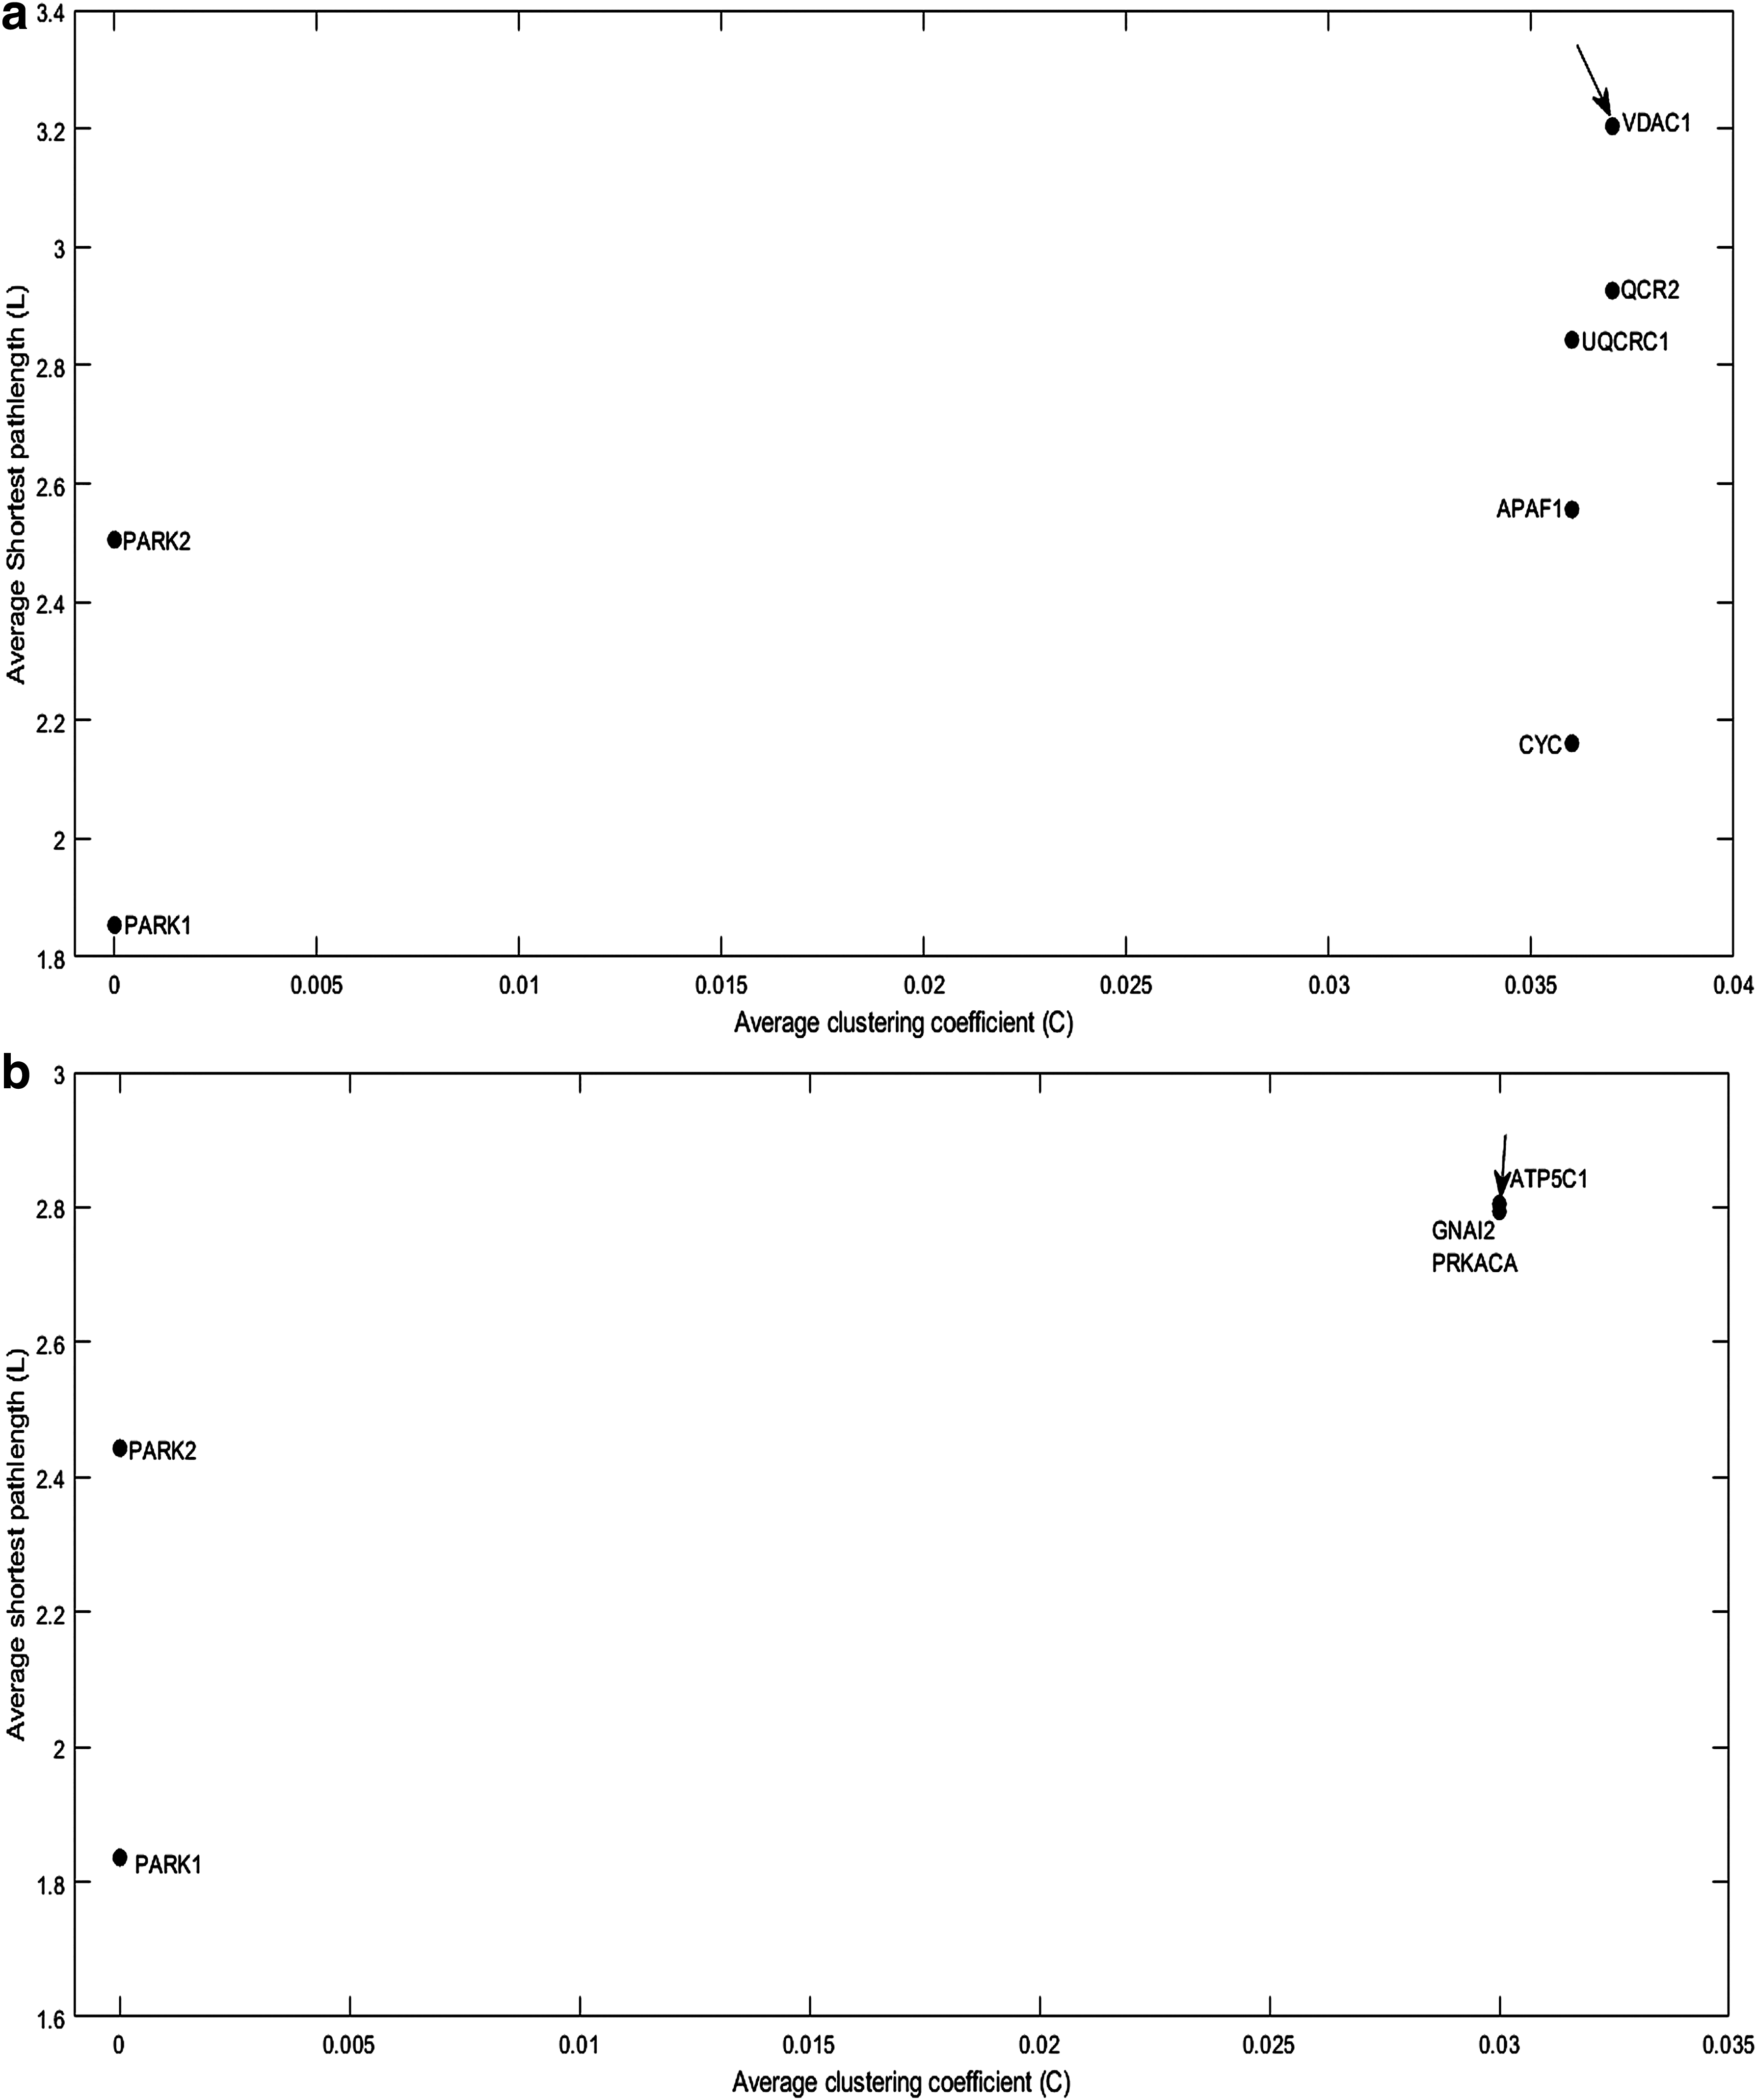
Shortest pathlength and clustering coefficient (LC) plot for potential target genes.
4. Conclusion
Identifying the candidate genes linked with PD is of great importance for the treatment of PD. In the present study, topological analyses of PPI network of human were used to determine the genes that cause PD. The genetic mutations and expression data were embedded into the PPI network to reveal potential targets that drive the implication of PD. The Parkinson's subnetwork was derived using KEGG pathway genes, and the target genes were determined using hub and centrality measures. The PARK1 and PARK2 genes were identified as common target genes from gene mutation and gene expression, which are high in centrality, and hub genes in subnetworks. Gene deletion analyses were implemented in the subnetwork; we have identified the VDAC1 and ATP5C1 genes, which are having a significant contribution to the robustness of PD subnetwork. The outcome of this study will help in designing the drugs for the novel targets and provide a reasonable method to accomplish gene prioritization in the disease state.
Footnotes
Acknowledgment
The authors thank the Vellore Institute of Technology for providing necessary computational facilities.
Author Disclosure Statement
The authors declare they have no competing financial interests.
Funding Information
The authors received no grant from funding agencies for this research.