
Abstract
The double pushout approach for graph transformation naturally allows an abstraction level of biochemical systems in which individual atoms of molecules can be traced automatically within chemical reaction networks. Aiming at a mathematical rigorous approach for isotope labeling design, we convert chemical reaction networks (represented as directed hypergraphs) into transformation semigroups. Symmetries within molecules correspond to permutations, whereas (not necessarily invertible) chemical reactions define the transformations of the semigroup. An approach for the automatic inference of informative labeling of atoms is presented, which allows to distinguish the activity of different pathway alternatives within reaction networks. To illustrate our approaches, we apply them to the reaction network of glycolysis, which is an important and well-understood process that allows for different alternatives to convert glucose into pyruvate.
1. Introduction
The study of semigroups has provided essential insight into the analysis of decomposability of systems. One of the most important contributions is the Krohn–Rhodes theory (or algebraic automata theory) (Rhodes et al., 2009), which allows to decompose any semigroup into simpler components (similar to the Jordan–Holder decomposition for groups). While conceptually very powerful, its application in life sciences is quite limited. A notable exception is a series of scientific contributions to analyze biological systems, more specifically metabolic and gene regulatory networks (Egri-Nagy et al., 2008). Based on semigroup theoretical approaches, subsystems and their hierarchical relations are identified within several biochemical systems, including the lac operon, the Krebs cycle, and the p53-mdm2 genetic regulatory pathway.
An essential tool for these studies is the analysis of an associated algebraic structure based on the Krohn–Rhodes decomposition. The hierarchical decomposition is also used as a way of assessing structural complexity changes of biological systems. However, for the Krohn–Rhodes complexity (Rhodes et al., 2009) (i.e., the least number of groups in a wreath product), it is even unknown if its computation is even decidable. Furthermore, it is also practically a very difficult problem to solve (Egri-Nagy and Nehaniv, 2008). Therefore, an alternative decomposition approach, the holonomy decomposition (Ginzburg, 1968), has been promoted. While the complexity measure is rigorously defined and based on the inference of the nontrivial permutation groups of the decomposition approach, it should be noted that the systems that can be analyzed cannot be very large. For example, the finite-state automaton modeling the Krebs cycle in Egri-Nagy et al. (2008) has eight states, and a rigorous inference of the exact value of its complexity was not possible. For a simplified version with six states, the decomposition leads (using a nontrivial argument) to an exact complexity value.
The decomposition approaches as well as most other methods that aim to analyze metabolic networks (e.g., flux balance analysis [FBA] or elementary flux modes [EFM]) (Schuster and Hilgetag, 1994, 2010; Orth et al., 2010) are based on a fixed set of abstracted molecular structures and rules (named reactions) that transform molecules (or equivalence classes of molecules) into each other. In the decomposition approaches, a biological system is represented as a state automata, where subsets of substrates correspond to states in the state set A and a transition function δ:
We follow a more chemically motivated (and direct) modeling approach with several important differences. (1) Being the most natural approach, we model chemical reaction networks as directed multi-hypergraphs (Zeigarnik, 2000), where the directed hyper-edges correspond to chemical reactions. (2) Molecules are not modeled as abstract entities, but as undirected graphs, with vertices representing atoms and edges representing the chemical bonds between them. (3) Hypergraphs are generated by methods based on graph transformation (Andersen et al., 2016). This level of abstraction allows to trace each individual atom through a single or a series of reactions. (4) We employ a mathematical framework in which pathways are rigorously defined as integer-hyperflows on directed multi-hypergraphs (Andersen et al., 2018).
In the following, we introduce a semigroup approach to assist in the design of (stable) isotope labeling experiments. A typical labeling experiment uses an isotope-labeled source molecule, for instance, glucose with a single or several labeled atoms (e.g., carbon-13, 13C, in place of a 12C) at a specific position of the molecule. These molecules are then used for some experiment, for instance, the glucose is ingested or by other means transformed into the product molecules. By extracting the product molecules and analyzing at which position the labeled atoms ended up (e.g., by using mass spectrometry [MS]), the original labeling might have been informative or not, that is, it might or might not be possible to learn something about the chemical process involved, or to allow for quantification of different pathway alternatives.
We present a framework to automatically infer if a specific labeling experiment is informative or not. Besides introducing a theoretical framework, we also aim to support the cross-fertilization of different scientific communities, including biology, chemistry, and theoretical computer science. To make such a bridge viable, we borrow many techniques from algorithmic engineering (Sanders, 2009) as all the methods presented are efficiently implemented and easily accessible to scientists with a limited background in computer science. For example, as an efficient inference of the automorphism group molecular graphs is essential for our approach, we employ our state-of-the-art algorithmic engineering approach for inference of the automorphism group of a graph (Andersen and Merkle, 2018, 2019).
2. Basic Definitions
We will keep our mathematical notation brief. For details with respect to transformation semigroups, we refer the reader, for example, to Ganyushkin and Mazorchuk (2009).
2.1. Semigroup theory
Many problems involving semigroups of a finite set of generators are hard. It can be shown that determining any “sensible” property of such semigroups is even undecidable and, for example, that membership testing in commutative transformation semigroups is NP-complete (East et al., 2018) (while being polynomial in permutation groups). Despite these results, the computational runtime needed for the results of this contribution will not be dominated by semigroup computations.
2.2. Graph transformations
 commutes (Ehrig et al., 2006). The objects D and H are guaranteed to be unique if they exist. The graph H is the product obtained by rewriting the educt G with respect to the rule
We call the application of a graph transformation rule a direct derivation from G to H via rule p and morphism m, written  or
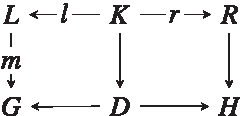
or  if the morphism is unimportant. An example DPO diagram for a chemical reaction called inverse aldol addition is depicted in Figure 1. Note that for two different morphisms m and m′, it might hold and
  , that is, the same rule might transform a set of molecules G into a set of molecules H using different atom maps. A derivation graph (DG) is a directed hypergraph
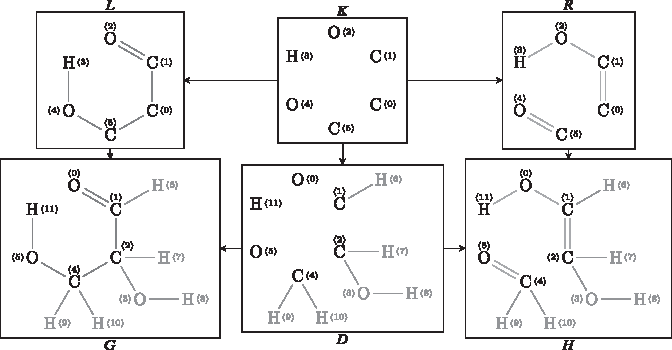
A chemical example of a DPO diagram with the application of a rule (inverse aldol addition). The graph transformation corresponds to an edge in the DG. DG, derivation graph; DPO, double pushout.
3. The Hypergraph Semigroup Approach
The overarching goal of an isotope labeling experiment is to be able to distinguish different pathways (or quantify their activity level). In the first step of our approach, we construct a hypergraph semigroup based on a DG that covers different pathway alternatives. This semigroup will be used to compute orbits of atoms. Based on the orbit calculation used in the forward hypergraph semigroup approach, we will define a pathway table where rows are potentially active pathways to be distinguished and columns are the informative candidates for atom labeling, while the entries are results of orbit calculations. The inverted semigroup will allow us to define a pathway comparison table, which has the potential to distinguish pathways based on co-occurring labels in the product, even if the pathway table cannot.
3.1. Forward semigroup approach
An example based on a DG for the so-called Formose reaction is depicted in Figure 2. See Andersen et al. (2013) for modeling details and the four graph transformation rules used to compute the DG (an aldol-addition reaction, a keto-enol tautomerization reaction, and their inverses). We restrict Ω to carbon atoms to reduce clutter of the illustration. While every hyperedge in the DG defines a transformation of the hypergraph semigroup, (14 15) is the only automorphism found (in cycle notation) in all molecular graphs. An inclusion of hydrogen atoms would significantly increase the number of automorphisms. We depict the partial transformation
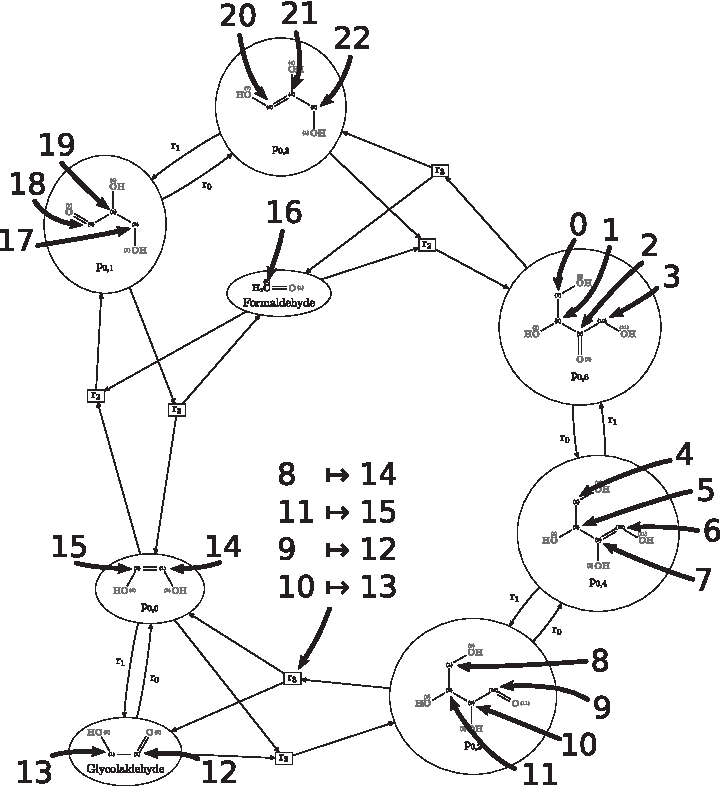
A DG for the Formose reaction. To reduce clutter, we restrict Ω to the 22 carbon atoms in the DG. Integers 1 to 22 correspond to the IDs of an atomic linearization. For the derivation
To (1) verify the correctness of our DG (i.e., the model of the chemical system) and (2) design an isotope labeling experiment that allows to distinguish pathway activity, we bridge in the following wet-lab isotope labeling experimentation and semigroup theory (for an overview of model checking approaches in Systems Biology, see, e.g., Brim and Safránek, 2013).
3.1.1. Forward semigroup approach
Let G be a hypergraph semigroup of a DG covering a set of different pathways and let a single atom k of a source molecule be labeled. Assume, that a (wet-lab) isotope labeling experiment leads to a target molecule with an isotope label at a vertex with ID i. If
While not observing i in the orbit of k allows us to conclude that the DG (i.e., the model) is not correct, this approach can also be used to distinguish the activity of different pathways by computing the orbits within different pathways in a DG, as is shown later.
3.2. Inverted hypergraph semigroup approach
Consider Figure 2 and let glycolaldehyde be the source molecule and p0, 6 be the target molecule for the sake of the example (we underline that this makes no sense chemically). Assume that an isotope labeling experiment is run with the atom corresponding to linearization ID 13 labeled, and p0, 6 as an observed target (with labeled atoms corresponding to linearization IDs 0, 2, and 3). Without even thinking about pathways, it would be desirable to be able to tell if the model is correct—should it even be possible to observe this labeling of (0, 2, 3)? Using the inverted hypergraph semigroup, we can answer in this case it is not.
Note that t−1 with
3.2.1. Inverted semigroup approach
Let G be a hypergraph semigroup of a DG covering a set of different pathways and let a single atom k of a source molecule be labeled. Assume that a (wet-lab) isotope labeling experiment leads to a target molecule with isotope labels simultaneously at vertices
The inverted approach underlines an insight that can be used to distinguish pathways: if some atoms have a similar or even identical orbit in two different pathways, using the inverted orbit can potentially disambiguate the two. We note that the forward semigroup approach on tuples
In the following, we introduce pathway tables and pathway comparison tables, which will guide an experimentalist when designing isotope labeling experiments.
4. Distinguishing Pathways
Given a set of pathways, the forward semigroup approach will be used to compute a pathway table, which allows to distinguish pathways finding informative atoms for labeling: rows correspond to pathways and columns correspond to informative atoms in the source molecules. The entries in pathway tables correspond to the orbit of the source atom in the pathway. Even when pathways cannot be distinguished with pathway tables, the pathway comparison table, which employs the inverted hypergraph semigroup approach, might allow so. A comparison table is made for a specific source atom and a specific cardinality of target labels. Rows correspond to pathways where certain elements are in an orbit, and columns correspond to pathways where the element is not in the orbit. Entries then correspond to k-tuples of simultaneously labeled target atoms, which when observed in a wet-lab experiment will allow to distinguish the row and column pathways from each other.
We will use a running example of four artificial pathways to be distinguished, to introduce and illustrate the applicability of pathway tables and pathway comparison tables. We then show results for a real-world example of how to distinguish alternative glycolysis pathways.
4.1. Artificial example pathways
For simplicity of illustrating the approaches, all artificial “molecules” of the following example are linear, that is, they have a natural string representation, which is in contrast to most real molecules. The four different pathways to be distinguished are shown in Figure 3. The artificial source “molecules” for all pathways are CCCY and the single-vertex graph X. The target molecule of all the pathways is the graph represented by CCCCCX. The local IDs of the source C atoms are 0, 1, and 2 (corresponding to the three Cs of the source CCCY). The local IDs of the product C atoms are 0, …, 4 (corresponding to the five Cs of target CCCCCX). The source and target molecules in Figure 3 are annotated with these local IDs, and they are also used both in the pathway table (Table 1) as well as in the pathway comparison table (Table 2). The four pathways P1, P2, P3, and P4 convert CCCY and X into CCCCCCX as follows:

Depicted are the four artificial pathways P1–P4 in subfigures
Pathway Table for the Running Example
Pathway Comparison Tables Where the Source Molecule Is Assumed to Have a Labeled Atom at Position with Local Atom ID a = 0
Depicted are the pathway comparison tables for tuple sizes k = 2, k = 3, and k = 4. For k = 1 and k = 5, the corresponding tables have no entries. As an example, assume the observation of a source molecule with labeled atoms at the three positions 0, 1, and 3 simultaneously. This would distinguish pathway P4 (for which such a labeling is possible) and pathway P1 (for which such a labeling is not possible). Note that the target atoms IDs 0, 1, and 3 are in the orbit of the corresponding carbon with ID 0 for both pathways (Table 1), and therefore, the pathway table does not allow to distinguish these two pathways. Note also that for this specific labeling in the source molecule no conclusion is possible for the comparison of any other pair of pathways. See Figure 3.
In pathway P1, CCCY splits into CCC, Y or C, CCY. The two Cs added to the left and the right to CCC turn it into CCCCC, which then attaches an X to give CCCCCX.
In pathway P2, CCCY splits into CCC, Y or C, CCY. CCC merges with X into CCCX. Afterward, the single C attaches to make CCCCX and then another to make CCCCCX.
In pathway P3, CCCY splits into CCC, Y or C, CCY. X is attached to a single C, then the result is attached to another C and another until we have CCCX. CCCX is now attached to CCC to give the too long CCCCCCX. Finally, a single C is cut of the end, leaving CCCCCX. Note that the subsequently added Cs can be added in any order.
Finally, in pathway P4, we split multiple CCCY into C, CCY compounds. X is attached to C to give CX. Another single C is attached to CX to give CCX. This is continued all the way to CCCCCX.
The DG of the running example corresponds to the union of the four pathways, where isomorphic compounds are identified.
4.2. Pathway tables
Suppose we have a set of potential pathways P and we aim to distinguish them. For simplicity of notation, we assume that we are interested in tracing atoms from one educt compound S to one product compound T. Let SV be the set of all atoms in S. Let
In case all entries of a specific column are identical, the candidate atom for isotopic labeling is noninformative. Note that it is straightforward to remove such noninformative columns and furthermore to merge identical lines (i.e., nondistinguishable pathways) of a pathway table. These reduction steps are not applicable to the pathway table depicted in Table 1.
We will use the following notation to easily relate the IDs to where they are coming from: iS means the carbon atom with local ID i in source molecule S. For example, 1 S corresponds to the carbon with local ID 1 in S, that is, the column from Table 1 called “1, C.” We use a similar notation iT for IDs in the target molecule T.
MS is an analytical standard technique for measuring masses of molecules. Together with stable isotope labeling experimentation, this is an extremely powerful tool for the analysis of (bio)chemical systems. For the approaches introduced in this article, it is important to note that it is much easier and cheaper to detect whether some molecule analyzed via MS has zero or one labeled atoms (as this leads to a mass difference) compared with determining at what position the labeled atoms are located in a molecule. In contrast to inferring the mass of a molecule (via the so-called MS1 experimentation), the inference of the position of a labeled atom usually requires the fragmentation of the molecule (via MS2 experiments), or the fragmentation of fragments (MS3), and so on. The fragmentation process of a molecule leads to a series of MS k spectra, which can be used as input for inferring the position of a labeled atom. As it is much easier to determine if there are no labels versus if there are some labels, it is preferred to look for mass-distinguishing factors over positions. The pathway table (Table 1) computed for the running example (Fig. 3) provides such an example. If someone carries out an isotope labeling experiment where carbon 1 S of S is labeled and no labels are observed in T, then we know that pathway P4 cannot have been active. To distinguish pathways P1, P2, and P3 based on a 1 S labeling requires the determination of the location of the label in the target compound. However, such an inference would indeed allow to identify which pathway was (or which pathway was not) active.
In the example, consider labeling 0 S (first column). Each entry has a lot of IDs in common with the rest of the entries, but it can still be used. For instance, observing 3 T would exclude pathway P2. Observing 1 T would not allow to exclude any of the pathways.
4.3. Pathway comparison tables
In the inverted semigroup approach, we test whether a target molecule could have been simultaneously labeled at multiple positions, starting from a source molecule with a label in just one position. The approach thus uses inverted orbits. As example, consider a pair of atoms that pathways P1 and P3 have in common in the corresponding pathway table entry, for instance, (1
T
, 3
T
). Now compute the inverted orbit for this pair in both pathways P1 and P3:
The “…” represents the part of the orbit not in molecule S, which is not relevant for this part of the analysis. We know that we started with a label only at 0 S , thus both elements of the tuple (1 T , 3 T ) must have originated from 0 S . The only of the two pathways where this could have happened is pathway 3 because (0 S , 0 S ) is in the orbit and not in the orbit for the other pathway. Therefore, if we ever observe (1 T , 3 T ), we can exclude pathway P1. This idea of looking at differences in inverted orbits can be used to create a pathway comparison table, which is a more powerful tool when ordinary orbits do not give useful results. We therefore aim at a table that allows us to see which labeling observations in the target molecules can be used to distinguish specific pathways based on the inverted semigroup approach.
Algorithmically, we proceed as follows: Given a set of pathways P, a specific column (i.e., a specific local atom ID) a from a pathway table τ, and an integer k, we create a Initialize entry Let [Oi is the subset of Let (We only care about what they have in common, that is, the part that we cannot distinguish by position.) Let For each (a) Compute (b) Compute (c) If di contains (
Using this algorithm on the pathway table in Table 1, considering the source labeling position ID
5. A Chemical Example
Assuming that the potential pathways are modeled as graph transformations, our approach can be applied to chemical examples in a straightforward manner. Here, the analysis of two alternative glycolysis pathways is presented. Glycolysis is a process that converts one glucose molecule into two pyruvate molecules. There are two glycolysis pathways that achieve this: the Entner–Doudoroff (ED) pathway and the Embden–Meyerhof–Parnass (EMP) pathway (Flamholz et al., 2013). Using the graph transformation rules for glycolysis as presented in Andersen et al. (2014), it is possible to determine what carbon atoms in glucose are informative for distinguishing the ED and EMP pathway by labeling. The 18 graph transformation rules including their atom-to-atom mapping are listed in Section 7. Figure 4 depicts the DG, which is an union of the two pathways depicted with green (ED) and blue (EMP) arrows. Figure 5 shows the source molecule (glucose) and the target molecule (pyruvate) and the local atom IDs as used in the pathway table.
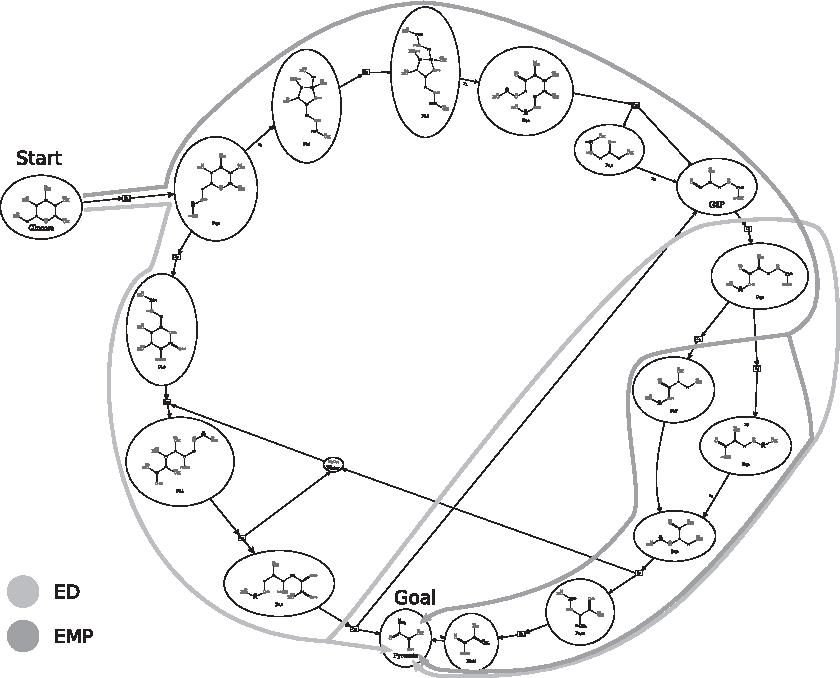
A combined DG for the ED and EMP pathways. Not all molecules are depicted to reduce clutter (e.g., cofactors NADH, ATD, ADP, and water molecules are not depicted). ED, Entner–Doudoroff; EMP, Embden–Meyerhof–Parnass.
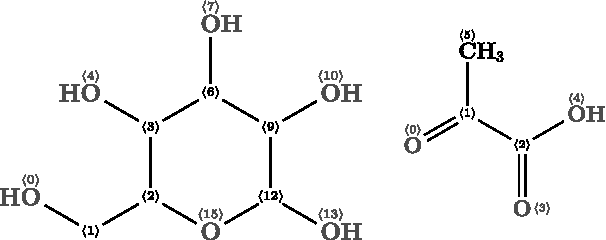
Glucose and pyruvate molecules where the local IDs can be seen.
Table 3 depicts the pathway table of the two pathways as well as their union. The columns correspond to all informative atoms, that is, all atoms that allow to distinguish different pathways. Ignoring hydrogen atoms, it turns out that there are six atoms in glucose that can be used to distinguish the EMP and ED pathways. For instance, if an isotope labeling experiment is carried out with a 13C in the place of the normal 12C at position 6 in the glucose molecule, and the MS results show only pyruvates with 13C at positions different from 2, then we can conclude that the EMP pathway was not active. The orbit of the oxygen atoms with local ID 0 or 13 (not so for the two other oxygens with IDs 7 or 15) does not include any atoms in pyruvate if only the EMP pathway is active. Note that we can furthermore conclude that a corresponding oxygen labeling experiment does not require verification of the position of the labeled oxygen, as the existence of a label in pyruvate (verified by mass only) is enough to determine that the ED pathway was active.
Pathway Table for Two Pathways (Embden–Meyerhof–Parnass and Entner–Doudoroff) Realizing Glycolysis
ED, Entner–Doudoroff; EMP, Embden–Meyerhof–Parnass.
To exemplify the inverted hypergraph semigroup approach, we chose
We can, however, conclude that using an isotope-labeled glucose cannot lead to a single pyruvate molecule that has two co-occurring labeled atoms. If this would be observed in a wet-lab experiment, then we would have to conclude that the modeling of the presented EMP and the ED is not sufficient and that another pathway must be active. If (k, k) would have been an element in only one of both inverted semigroup orbits, we could have used the labeling of atom k in glucose to distinguish pathways.
6. Conclusion
We introduced an approach based on transformation semigroups to automatically design isotope labeling experiments. The input to the approach is a set of pathways to be distinguished. All chemical reactions of the pathways are modeled using the DPO approach for graph transformation. The most relevant mathematical structure used in the analyses presented in this article is the transformation semigroup induced by pathways of a chemical reaction network. While symmetries within individual molecules correspond to permutations in the semigroup, chemical reactions correspond to transformations. In the forward semigroup approach, the orbit of source atoms was computed to infer a pathway table, which is used to distinguish potential pathways. If this approach fails, the inverted semigroup approach might still allow to distinguish pathways by analyzing the orbit of k-tuples (corresponding to co-occurring target labeling positions) in the inverted semigroup. We applied the approaches on a chemically inspired artificial example of four pathways as well as on pathway alternatives within a reaction network for glycolysis. All approaches have been implemented and will be integrated in an open source framework for chemically inspired graph transformation (Andersen et al., 2016).
A natural next step is to apply the decomposition results known for semigroups. While the modeling approach in Egri-Nagy and Nehaniv (2008) is applied on a different level of abstraction (the transformations of a semigroup map molecules onto each other, in contrast to our approach where atoms are mapped), there is an interesting similarity. In Nehaniv et al. (2015), local substructures that exhibit symmetry on a network level are found to be permutation groups. Such permutation groups are considered as natural and important subsystems (a “pool of local reversibility”). In our approach, local substructures are permutation groups that describe natural symmetries: the automorphisms of any molecular graph will describe a permutation group as a substructure of a semigroup. In our future work, we will apply the decomposition approaches to gain a deeper understanding of the atom transition networks by a hierarchical decomposition.
7. Appendix
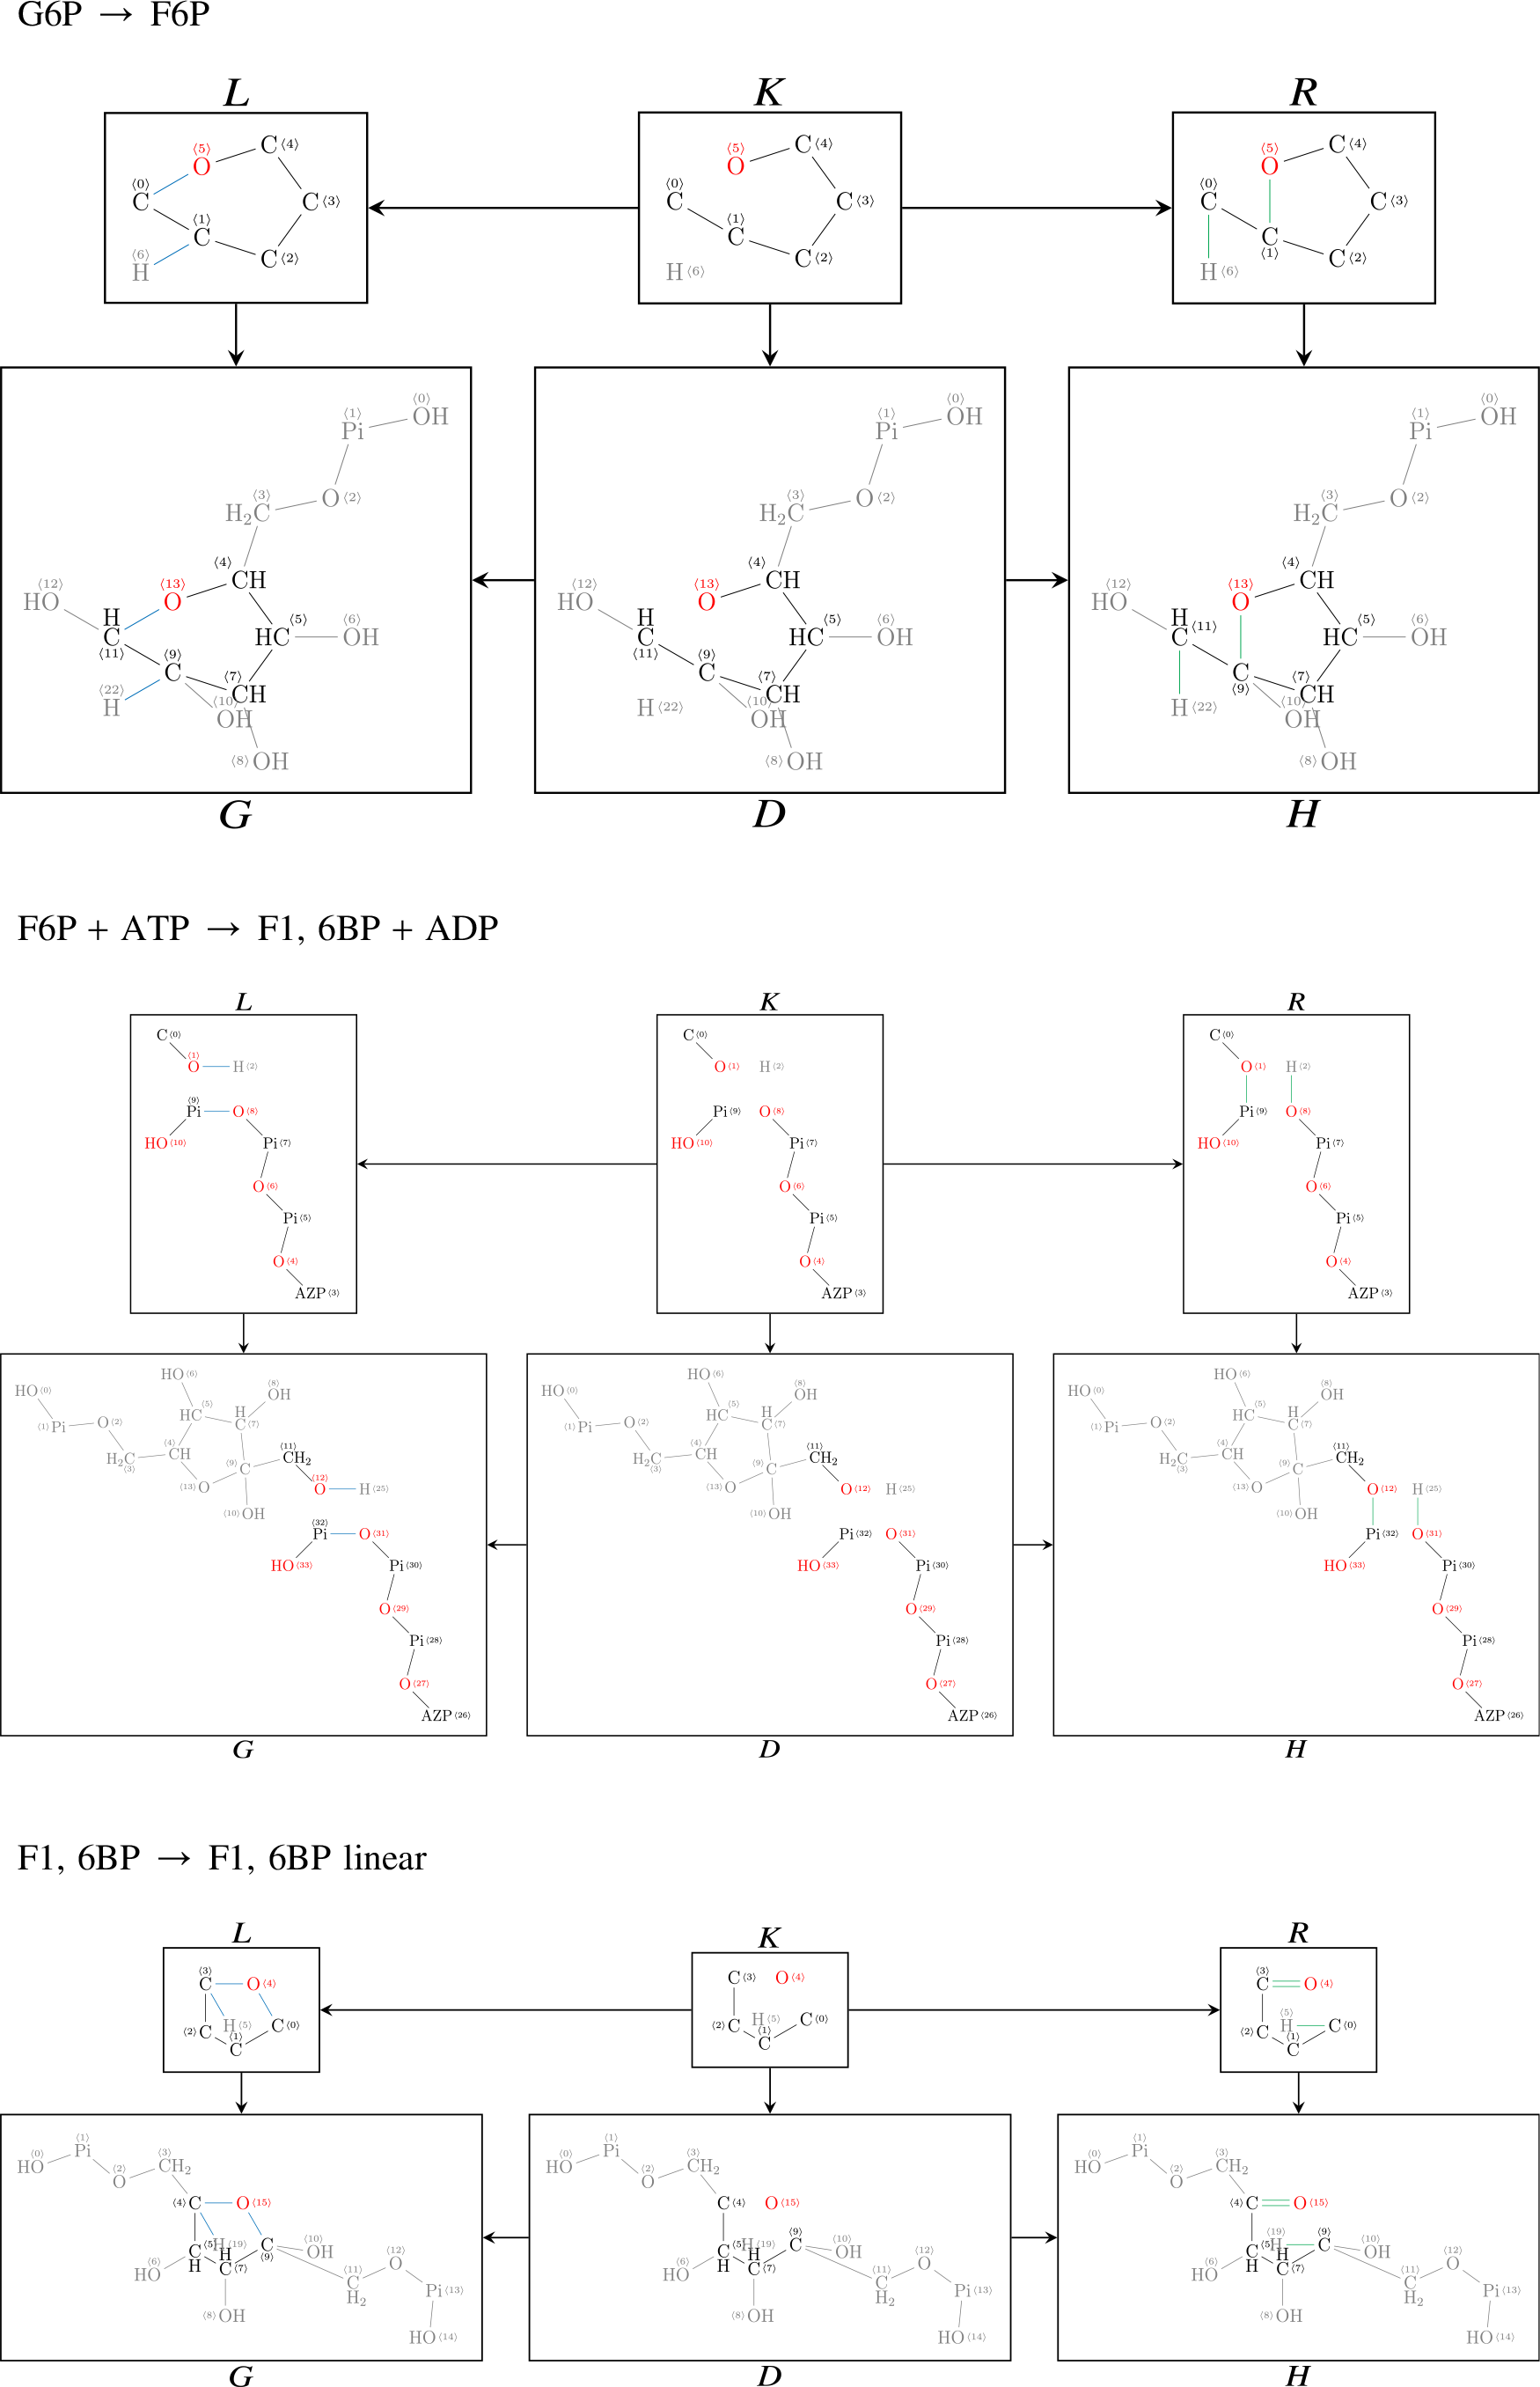
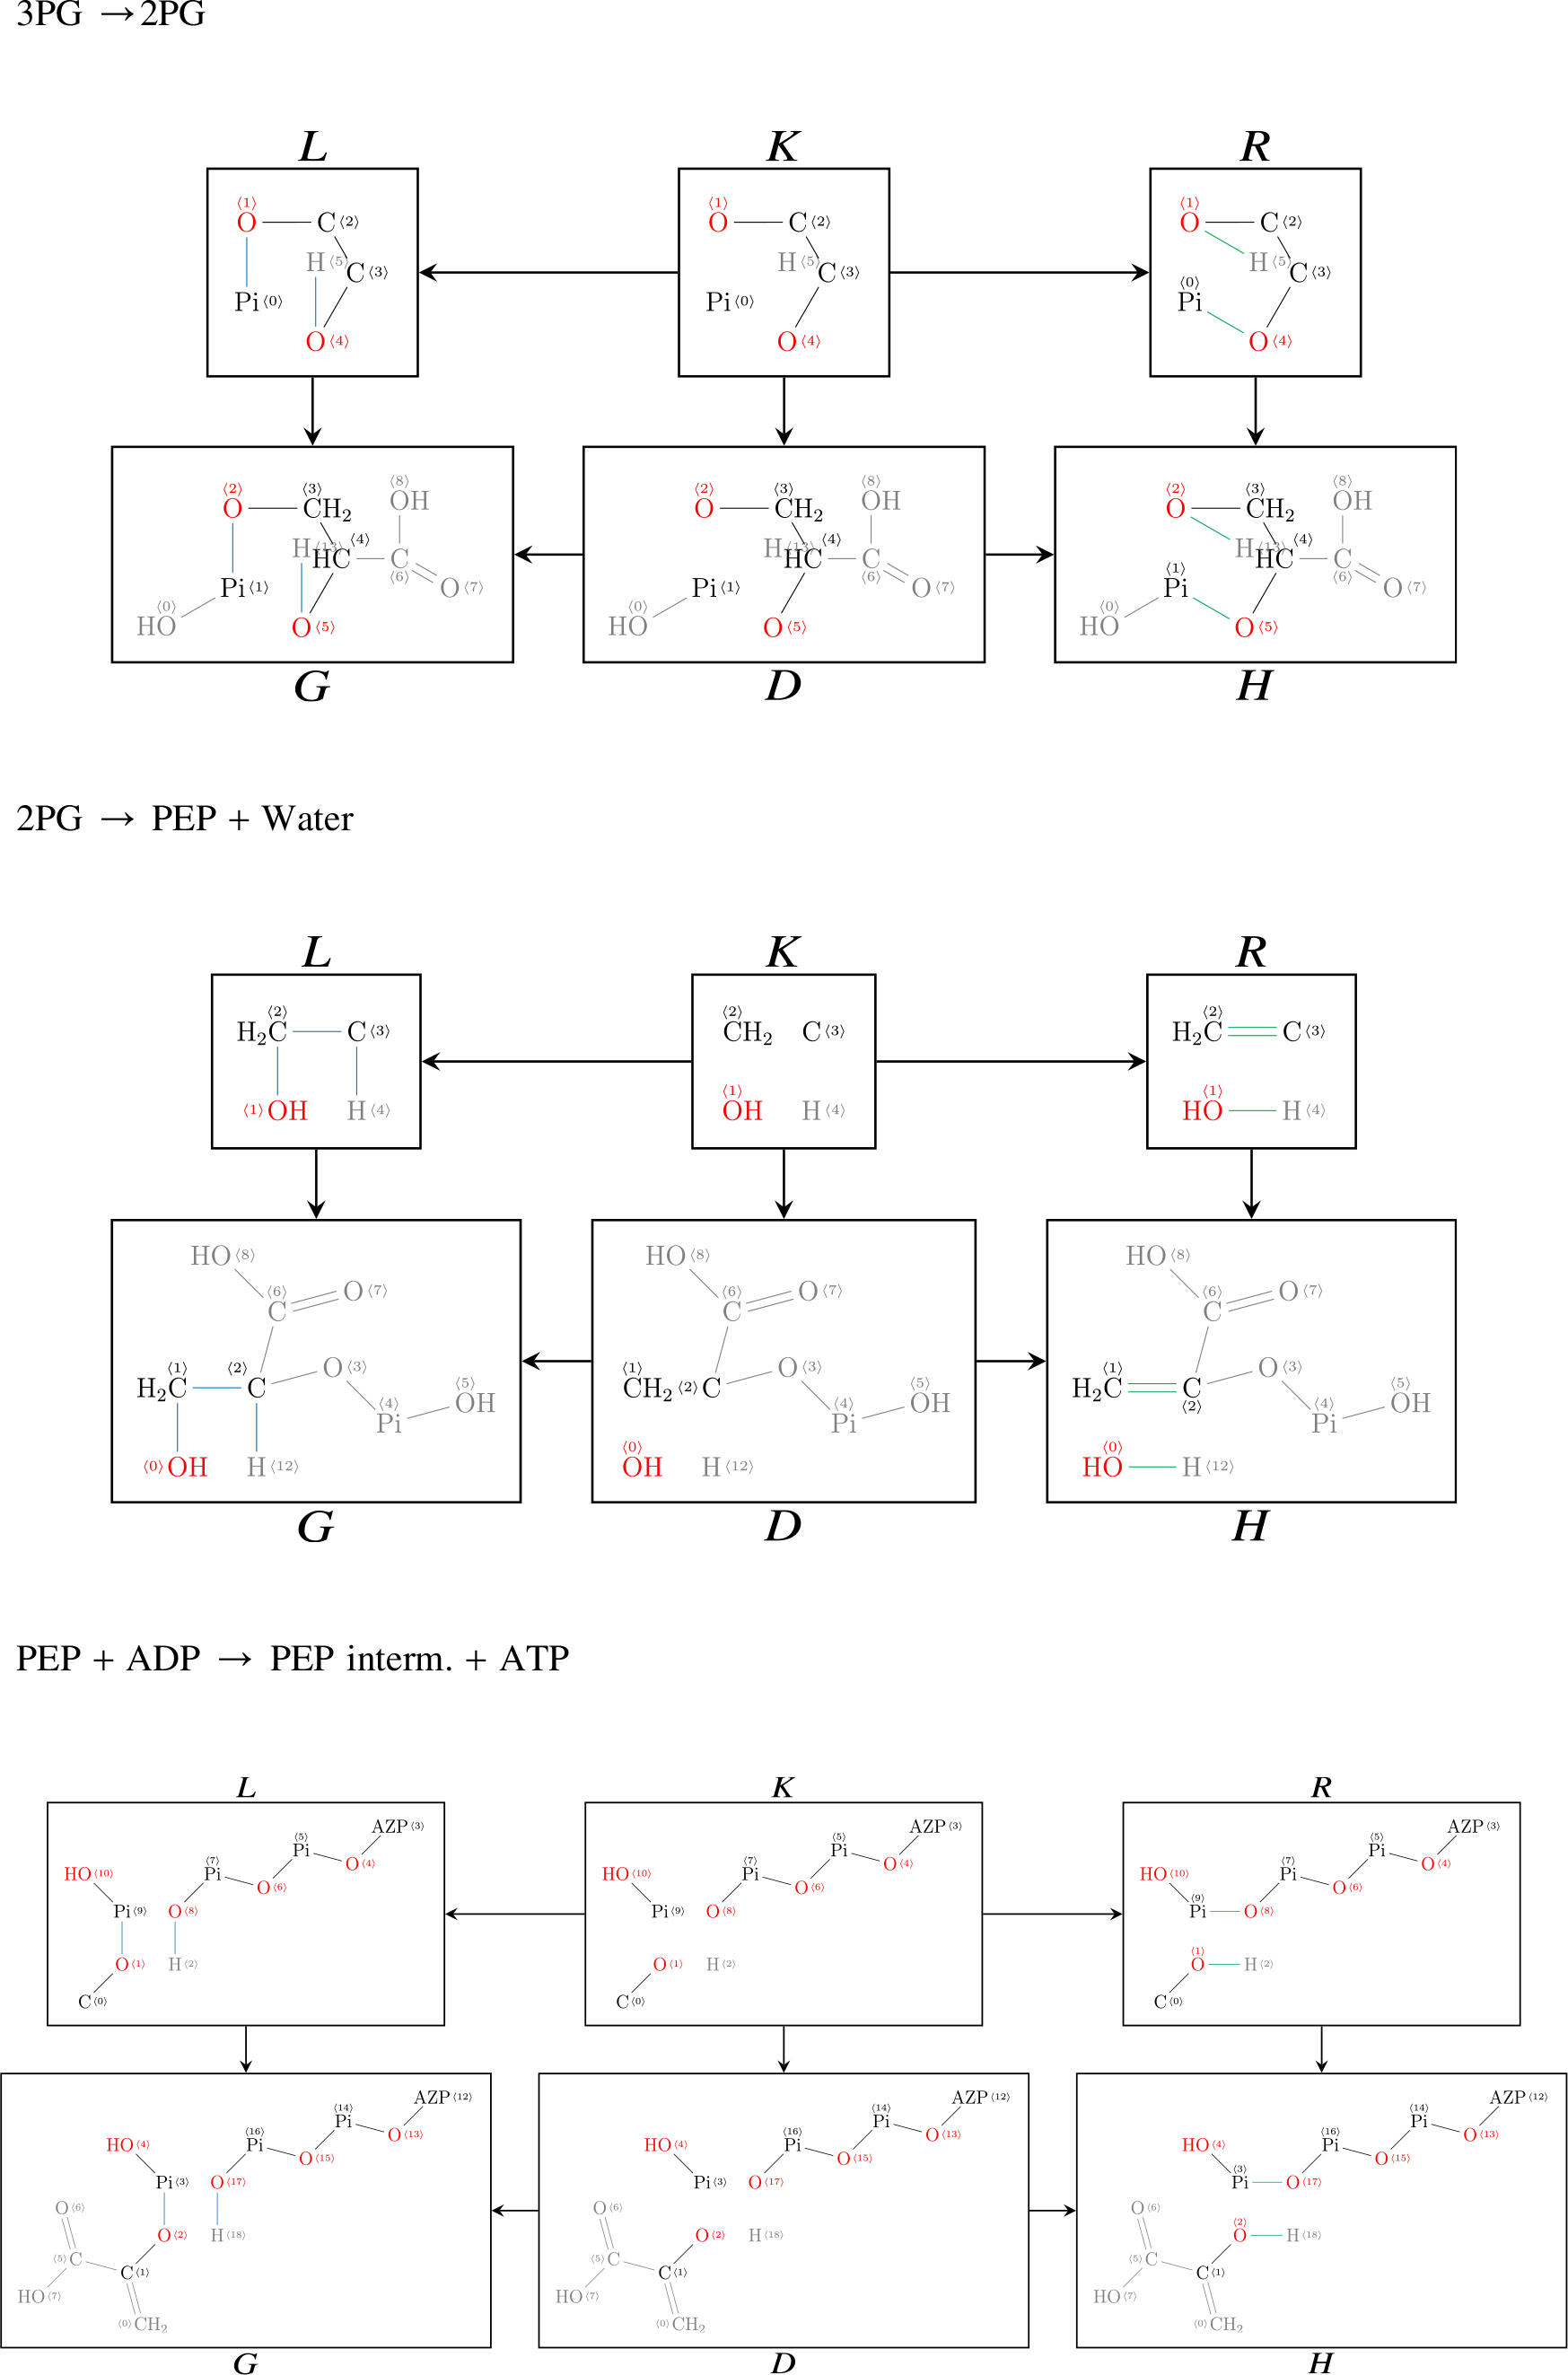
7.1. Direct derivations for EMP and ED
For completeness, we list in the following all DPO diagrams underlying the hypergraph of the EMP and ED pathways. Please note that the IDs of the atoms in graphs G and H correspond to each other, thereby specifying an atom–atom map and a corresponding transformation of the semigroup.


Footnotes
Author Disclosure Statement
The authors declare they have no competing financial interests.
Funding Information
This work is supported, in part, by the Independent Research Fund Denmark, Natural Sciences (Grant No. DFF-7014-00041).