
Abstract
ChIP-Seq blacklists contain genomic regions that frequently produce artifacts and noise in ChIP-Seq experiments. To improve signal-to-noise ratio, ChIP-Seq pipelines often remove data points that map to blacklist regions. Existing blacklists have been compiled in a manual or semiautomated way. In this article we describe PeakPass, an efficient method to generate blacklists, and demonstrate that blacklists can increase ChIP-Seq data quality. PeakPass leverages machine learning and attempts to automate blacklist generation. PeakPass uses a random forest classifier in combination with genomic features such as sequence, annotated repeats, complexity, assembly gaps, and the ratio of multimapping to uniquely mapping reads to identify artifact regions. We have validated PeakPass on a large data set and tested it for the purpose of upgrading a blacklist to a new reference genome version. We trained PeakPass on the ENCODE blacklist for the hg19 human reference genome, and created an updated blacklist for hg38. To assess the performance of this blacklist, we tested 42 ChIP-Seq replicates from 24 experiments using 10 ChIP-Seq quality metrics including relative strand coefficient, standardized standard deviation, and enrichment of reads in promoter regions. Using the blacklist generated by PeakPass resulted in a statistically significant improvement for nine of these metrics.
1. Introduction
ChIP-Seq is an experimental technique to determine protein–DNA interaction sites within the genome. During a ChIP-Seq experiment, fragments of DNA crosslinked to proteins are enriched by antibodies that bind to a protein of interest, and then isolated and sequenced. The resulting sequence reads are mapped to a reference genome, and clusters of mapped reads are used to infer potential protein binding sites. Typically, ChIP-Seq is used to identify epigenetic alterations such as histone modifications, and the binding sites of transcription factors and other DNA binding proteins.
ChIP-Seq experiments often suffer from data quality problems. A variety of ChIP-seq quality control and visualization tools have been developed. Examples include ChIPQC (Carroll et al., 2014), HiChIP (Yan et al., 2014), htSeqTools (Planet et al., 2012), and ChIPseeker (Yu et al., 2015); see Qin et al. (2016) for a comprehensive review. It has been observed that certain genomic regions frequently produce artifacts and noise in ChIP-Seq experiments. Such artifact regions are frequently associated with errors in the underlying genome assembly, sequence repeats, or genomic variability between different individuals, but often the exact cause of the observed artifacts remains elusive (Degner et al., 2009). Usually, problematic genome regions are stored in a blacklist, and data points that map to blacklist regions are excluded from further analyses. Blacklists are an important part of ChIP-Seq analysis pipelines, and they are usually created using a time-consuming semiautomated process (Kundaje, 2019).
There are only a few methods to automate ChIP-Seq artifact region lists. GreyListChIP uses a probability model to identify regions of ChIP-Seq input replicates that exhibit high signal. These regions are likely to contain artifact peaks in ChIP replicates. The authors suggest removing reads aligning to this “gray list” of high read depth regions before peak calling (Brown, 2019). A second tool called DangerTrack uses a regression model based on mappability features to predict blacklist regions. The authors observed a high correlation between DangerTrack scores and ENCODE blacklist regions, but so far, a validation using ChIP-Seq experiments is still missing (Dolgalev et al., 2017). Our PeakPass algorithm (Wimberley, 2018) uses a supervised learning approach: starting from artifact regions derived from the ENCODE blacklist, and a large set of genomic features, we apply feature selection in combination with classification to produce a new genome-wide blacklist. Subsequently, we evaluate the quality of our blacklist using a large number of ChIP-Seq experiments.
In this extended version of our article, we used the ChIPQC R package (Carroll et al., 2014) to measure 10 metrics that can be used to determine the quality of ChIP-Seq data and to assess the effectiveness of a blacklist treatment. Relative strand coefficient (RSC) is a signal-to-noise ratio estimate that is computed from the stranded cross-correlation plots as the ratio of correlation at the fragment length (signal) to correlation at read length (noise) (Carroll et al., 2014). A correlation spike at the read length is known as the “phantom peak,” and signals suboptimal RSC. Ramachandran et al. (2013) have shown that controlling for alignability during cross-correlation analysis reduces the phantom peak. Carroll and colleagues found that plotting cross-correlation of only duplicated reads results in both read length and fragment length correlation peaks. However, cross-correlation of reads in blacklist regions results in only a read length peak (Carroll et al., 2014). Therefore, the reduction of the phantom peak height after blacklist treatment is one metric to assess the effectiveness of a blacklist.
Normalized strand coefficient (NSC) is a related metric, which is defined as the ratio of correlation at the fragment length to the minimum correlation. Standardized standard deviation (SSD) is a measurement of variation of coverage between different genomic intervals. SSD is higher when there is a large difference in read counts between peaks and background regions (Planet et al., 2012). Artifact peaks often contain many more reads than nonartifact peaks and, therefore, contribute overproportionally to SSD. As a result, if blacklist treatment removes artifact reads, a decrease in SSD is expected. Nonredundant fraction (NRF) is the fraction of mapped reads that are the only reads mapped at a position to the number of stacked reads. Fraction of reads in peaks (FRiP) is the fraction of reads in the final set of called peaks to all other reads. Fraction of reads in promoter regions and the fraction of reads in transcripts are important metrics because transcription factor binding sites often occur in these regions (Koudritsky and Domany, 2008).
In the remaining parts of this article, we describe our PeakPass approach and illustrate how PeakPass can be used to update a previous blacklist (ENCODE hg19 blacklist) to a new genome version (hg38). Finally, we compare the newly generated blacklist with the corresponding ENCODE hg38 blacklist by computing performance metrics on multiple ChIP-Seq data sets downloaded from the ENCODE database (The ENCODE Project Consortium, 2012). Average RSC increased by 50% over the ENCODE hg38 blacklist when applying the PeakPass blacklist. We also measured a significant decrease in SSD, and an increase in both fraction of reads in promoter regions and fraction of reads in transcripts. Finally, we compare the repeat composition of the blacklists, and measure how many peaks from the ENCODE ChIP-Seq sets intersect with the new blacklist regions.
2. Methods
Starting from a small training set of artifact regions, PeakPass uses supervised learning (classification) to generate a blacklist that covers the entire genome. To identify a suitable classifier, we compared the performance of six algorithms: random forest (Ho, 1995), K-nearest neighbor (KNN) (Fix and Hodges, 1951), support vector machines (SVM) (Cortes and Vapnik, 1995) with radial and linear kernels, artificial neural networks (ANN) (Farley and Clark, 1954), and Naive Bayes (John and Langley, 2013) using a blacklist from an earlier human reference genome version (hg19). Each algorithm was tested on its ability to predict hg19 blacklist regions set aside from the training data; the random forest classifier outperformed all competitors (see the Results section) and was adopted as the PeakPass classification engine. Subsequently, we used PeakPass to predict a blacklist for the most recent genome version hg38. Many assembly errors and gaps in hg19 have been fixed in hg38, therefore, we expect the blacklist for hg38 to be significantly different. The new blacklist for hg38 was tested for its impact on ChIP-Seq quality metrics and called peaks.
We start by dividing the hg19 reference genome into windows of size 1 kbp. Subsequently, features were computed for each window as shown in Figure 1. If 70% or more of the window overlaps with an ENCODE blacklist region, the window is labeled as a blacklist region, otherwise the window is treated as a “normal” region. The resulting data set consist of 8517 blacklist regions and 2,566,611 normal regions.
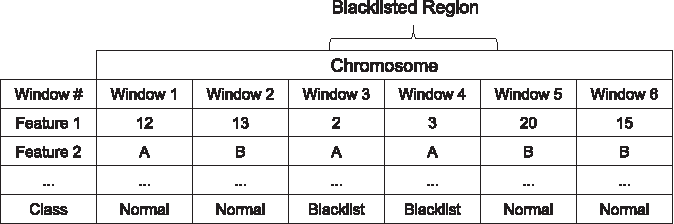
Computing features and class labels from genomic windows.
PeakPass uses a variety of genomic features to predict artifact regions. We use two alignability-based features [similar to DangerTrack (Dolgalev et al., 2017)]: alignability averaged across each window and the number of positions in the window with alignability <0.1. Alignability measures how often a certain k-mer sequence aligns to the genome. For a specific genomic interval of length k, the alignability is defined as the inverse of the number of different matches of the interval in the genome (Derrien et al., 2012). Similar to the Kundaje's blacklist candidate generator, PeakPass also uses ratio of multimapping loci to uniquely mapping loci. Repeat-based features include the number of RepeatMasker (Smit et al., 2013–2015) repeats that intersect the window and the number of softmasked base pairs. In addition, several complexity-based features (the number of unique 4-mers, number of 2-mer tandem repeats, and A, T, C, and G content), distance to the nearest gene, and distance to the nearest assembly gap are used.
Several features such as unique 3-mers, number of loci with alignability over 0.9, and monomer repeats were removed from the feature set because they were highly correlated with other features, and model performance did not decrease after their removal. In addition, we decided to not use the nearest assembly gap type and gap size features because they were not available for certain genome assemblies. The annotated repeat types also differed widely between organisms, so this feature was excluded as well. The final list of features we used and feature importance scores using random forest's out-of-bag feature importance estimate is given in Table 1.
PeakPass Features and Feature Importance Scores from Most Important to Least Important
We split the labeled data derived from the ENCODE hg19 blacklist into independent training and test data sets. The training data set was further subdivided into independent parts for hyperparameter tuning [through 10-fold cross-validation, parameters were selected to maximize AUCROC, tuning was performed with the caret library for R (Kuhn, 2008)], model training, and model comparison (through multiple iterations of subsampling). The optimal tuning parameters for random forest were mtry = 4 (number of features sampled at each split), ntree = 2000 (number of trees), nodesize = 1 (minimum observations in leaf nodes), and maxnodes = 10 (maximum number of leaf nodes per tree). Training sets were undersampled to 2000 observations of each class label. Using the test data set we evaluated the performance of the best classifier. All data sets were disjoint on both window location and blacklist item, this means that windows from the same blacklist item or genomic location cannot appear in both a training and corresponding validation or test set. Finally, we used the fully trained algorithm to predict a new blacklist for hg38.
Because Kundaje's blacklist indicates that some regions are blacklisted due to the presence of certain repeats types, the repeat composition of the PeakPass blacklist was measured (Kundaje, 2019). Each blacklist was intersected with the set of RepeatMasker repeats, and the frequency of each repeat type was computed. To normalize repeat frequencies between blacklists of different sizes, we report repeat frequency per kilobase.
Next, the blacklists were compared to determine their effect on the 10 ChIP-Seq quality metrics described previously. We selected 42 replicates from 24 transcription factor ChIP-Seq experiments from ENCODE that exhibited a phantom peak and evaluated them under different blacklist treatments. We selected replicates that exhibited a phantom peak. In addition, we made sure that the chosen replicates cover a large variety of target proteins, cell lines, and source laboratories. Our goal was to minimize bias, and to promote the generalizability of our blacklist. Additional details about the composition of the ChIP-Seq data are given in Table 2.
Composition of the ChIP-Seq Data Set Used to Validate PeakPass
Replicates from the following ENCODE experiment accession IDs were used:
Table 3 shows the NRF and PCR bottle-necking coefficient 1 (PBC1) composition of the ChIP-Seq data sets we used. We selected these metrics due to their association with ChIP-Seq artifacts. PBC1 is the number of mapped loci with one uniquely mapped read divided by the number of loci with one or more uniquely mapped reads. Quality thresholds and rating terminology used in the table are taken from the ENCODE website (ENCODE).
Nonredundant Fraction and PCR Bottle-Necking Coefficient 1 Composition of the ChIP-Seq Data Set Used to Validate PeakPass
NRF, nonredundant fraction; PBC1, PCR bottle-necking coefficient 1.
BAM files for the selected replicates were filtered using both the ENCODE and PeakPass blacklists; the resulting BAM files were sorted and indexed. RSC and NSC were measured using the cross-correlation implementation of the ENCODE pipeline. The results were stored in a CSV file. The ChIPQC R package (Carroll et al., 2014) was used to measure SSD, FRiP, NRF, and fraction of reads in both promoters and transcripts. We expect that both SSD and NRF will be affected by artifact regions that contain large number of stacked reads. The results for all metrics are grouped by treatment and stored into a single CSV file. Metrics were visualized using box plots and violin plots. We then used a one-tailed paired Holm's post hoc test to measure significance of the results (Holm, 1979). Results are given in Table 5.
p-Values for Changes in ChIP-Seq Quality Metrics by Treatment (Significant ≤0.05)
Finally, the blacklists are intersected with the peaks called by the ENCODE pipeline to measure the number of peaks that are filtered by the blacklists. IDR thresholded peak sets were downloaded from the ENCODE database when available. We report the percentage of called peaks that intersect with the PeakPass blacklist, as these peaks would be filtered by the blacklist.
PeakPass consists of a set of R, Python, and Bash scripts that can be executed in a Unix environment. Our feature extraction pipeline requires a FASTA file with the reference genome sequence, bed-files of assembly gaps, genes, and repeats, as well as bedGraph files with alignability information for each chromosome. The pipeline returns a CSV file with feature vectors for each 1 kbp window. The feature extraction pipeline can be used to generate feature vectors for model training and whole genome blacklist prediction. Once training and testing data have been generated, the classifyWholeGenome.sh script will train a random forest classifier and generate a bedGraph file that contains a blacklist precursor that assigns each window a score for its likelihood to be part of an artifact region. Finally, the createMergedBlacklist.sh script thresholds blacklist precursor windows and merges nearby regions based on user-provided parameters. The PeakPass algorithm, instructions, and the PeakPass hg38 blacklist can be downloaded from our GitHub repository: (https://github.com/ewimberley/peakPass).
3. Results
Table 4 compares model performance for different learning algorithms using 32 randomly sampled training and validation sets. Sensitivity and specificity are measured at a threshold of 0.5. We used AUC PR (area under the precision/recall curve) as our metric for model selection because of its good performance on imbalanced data (He, 2009). We also report AUCROC (area under the receiver operating characteristic curve). The standard deviation of each performance metric is shown in parentheses next to the mean of the measurement. Random forest was selected as the best performing model, and was benchmarked on the test set (286,446 1 kbp windows). The final model performance on the testing data set is shown in the last row of the given table.
Validation and Test Performance of the Different Classification Algorithms
ANN, artificial neural networks; AUC P/R, area under the precision/recall curve; AUROC, area under the receiver operating characteristic curve; KNN, K-nearest neighbor; SVM, support vector machine.
Our blacklist is considerably larger than the ENCODE blacklist: it contains 5078 regions, with an average length of 14,500 bp. In comparison, the ENCODE blacklist for hg38 contains 38 regions with an average length of 450 bp. Blacklist regions cluster around assembly gaps, Genome Reference Consortium (GRC) incidents, anomalous mappability regions, centromeres, and telomeres.
We observed that PeakPass greatly improves RSC, but has little impact on NSC. PeakPass treatment decreases both minimum and maximum cross-correlation. Example strand cross-correlation plots with different treatments are shown in Figure 2. The top plot (no treatment) has an RSC of 0.708, and the bottom plot (PeakPass treatment) has an RSC of 1.405. The ENCODE blacklist slightly increases the average RSC. By comparison, the PeakPass blacklist increases the average RSC by 50%. The ENCODE blacklist decreases both average SSD and SSD variance, but PeakPass has an even greater effect. PeakPass increased both fraction of reads upstream of the transcription start site (TSS) and in transcripts.
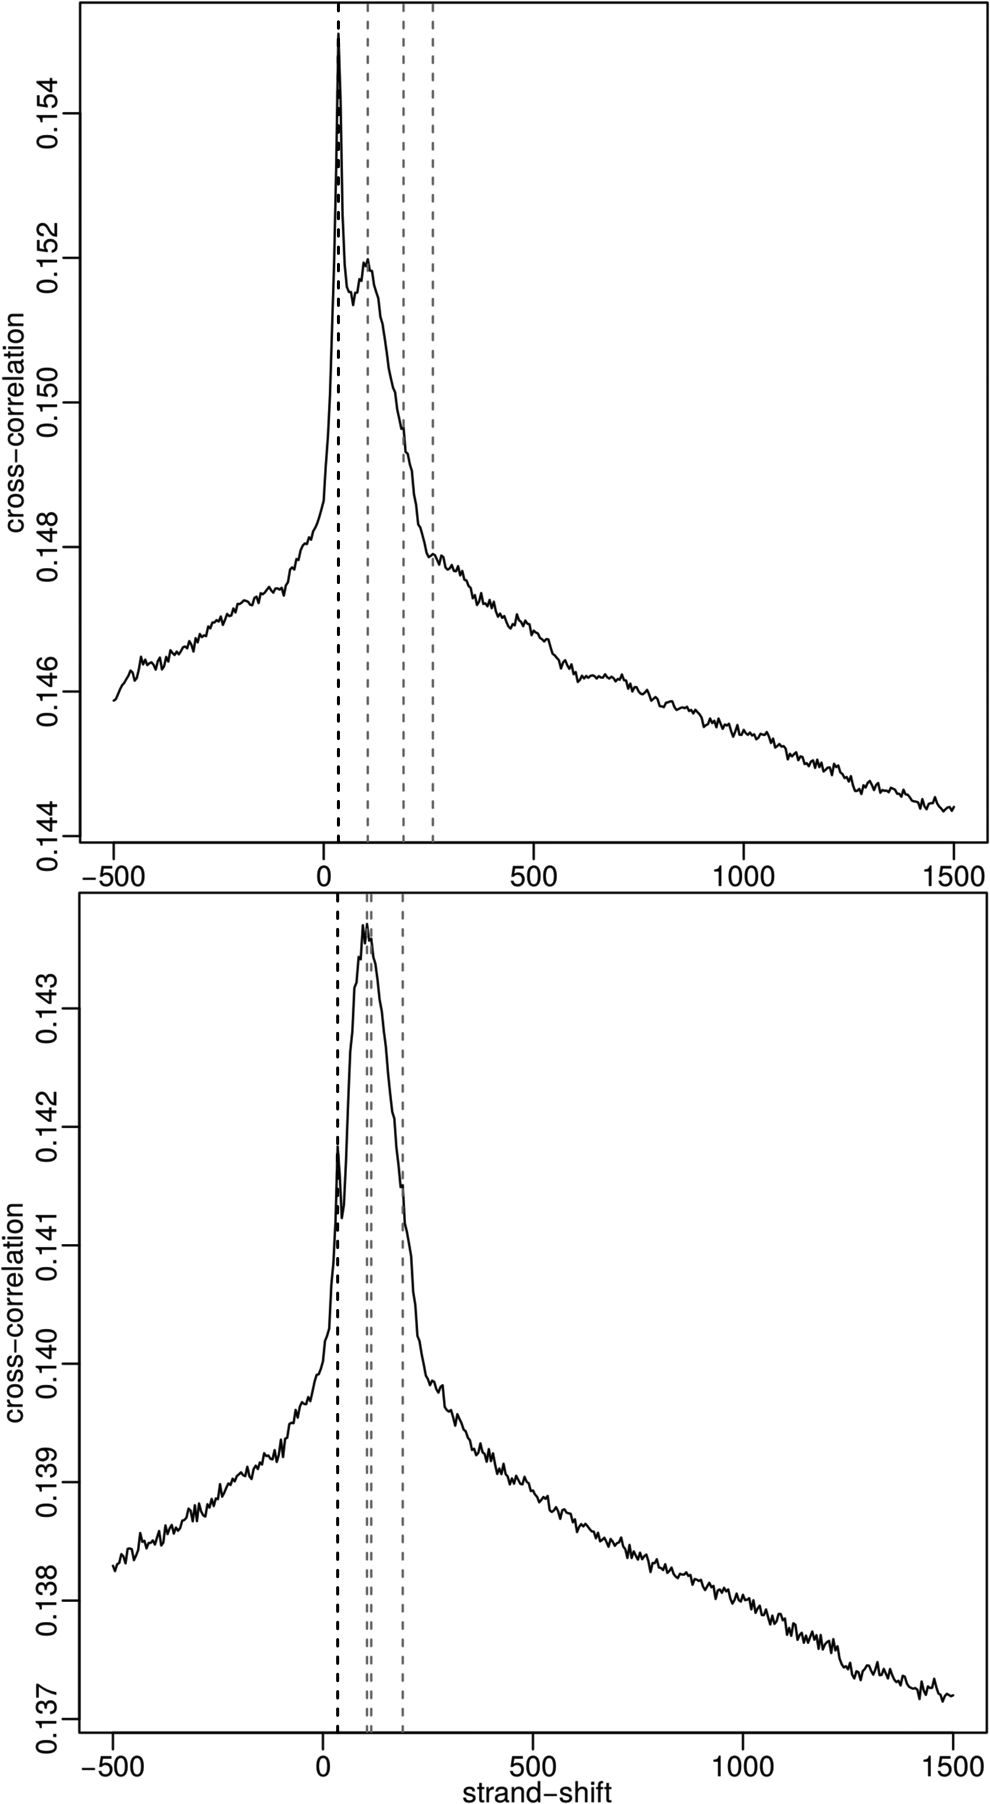
Strand cross-correlation plots for the ENCODE ENCFF900RPG replicate before PeakPass treatment (top) and after (bottom).
Figure 3 shows the change in quality metrics by treatment for the hg38 ChIP-Seq replicates by treatment. The hg38 ENCODE blacklist has little impact on RSC, fraction of reads in transcripts, and fraction of reads 500 bp to 2 kbp upstream of the TSS compared with the PeakPass blacklist. PeakPass results in a significant (p ≤ 0.05) difference for all four metrics in Figure 3.

ChIP-Seq metric distributions of 42 replicates with different blacklist treatments.
Table 5 contains the p-values for changes in the ChIP-Seq quality metrics we measured. For each metric, we report a p-value for the ENCODE blacklist versus control, PeakPass versus control, and PeakPass versus ENCODE. The “Hypothesis” column indicates the alternative hypothesis (whether the metric is hypothesized to increase or decrease after treatment). The “No treatment” column contains p-values when comparing the treatment with the control, and the “ENCODE” column contains the p-values when comparing PeakPass to the ENCODE blacklist. We selected a p-value threshold of 0.05. p-Values given in Table 5 below this threshold are shown in bold.
The first set of metrics (RSC, NSC, SSD, FRiP, and NRF) in Table 5 estimates signal-to-noise ratios. Both PeakPass and ENCODE blacklists show significant changes in RSC. Change in NSC is only significant after PeakPass treatment. The effect size of blacklisting on NSC is small. SSD and FRiP show significant changes for both blacklists; FRiP effect size was small. We observed no significant change in NRF. The rest of Table 5 gives metrics related to read enrichment in promoter and transcript regions (Frac. 500, Frac. 500–2000, Frac. 2000–20,000, Frac. transcripts, Frac. introns). Although p-values were significant across the board for these metrics, effect sizes varied. The increase in fraction of reads up to 500 bp upstream of the TSS was not noticeable on a boxplot. Effect sizes for enrichment of reads in the 500 bp to 2 kbp and 2 kbp to 20 kbp upstream regions were moderate. Surprisingly, there was a large increase in fraction of reads in both introns and all transcript regions.
For the replicates listed hereunder, treatment with PeakPass pushes the replicate over the ENCODE-recommended RSC threshold of 0.8 (Landt et al., 2012). After PeakPass treatment, these replicates could now be used in subsequent analysis steps. Publications using these replicates may want to attempt to reproduce their results using the PeakPass blacklist, and investigate differentially called peaks to reduce false positive peak calls.
Figure 4 shows the percentage of called peaks that overlap with the PeakPass blacklist. We took the conservatively called peaks from 25 experiments that contain replicates demonstrating a phantom peak and intersected them with the PeakPass blacklist. These intersecting peaks would be filtered out if the PeakPass blacklist was used. For most replicates, ∼0.1% of peaks would have been filtered by PeakPass.
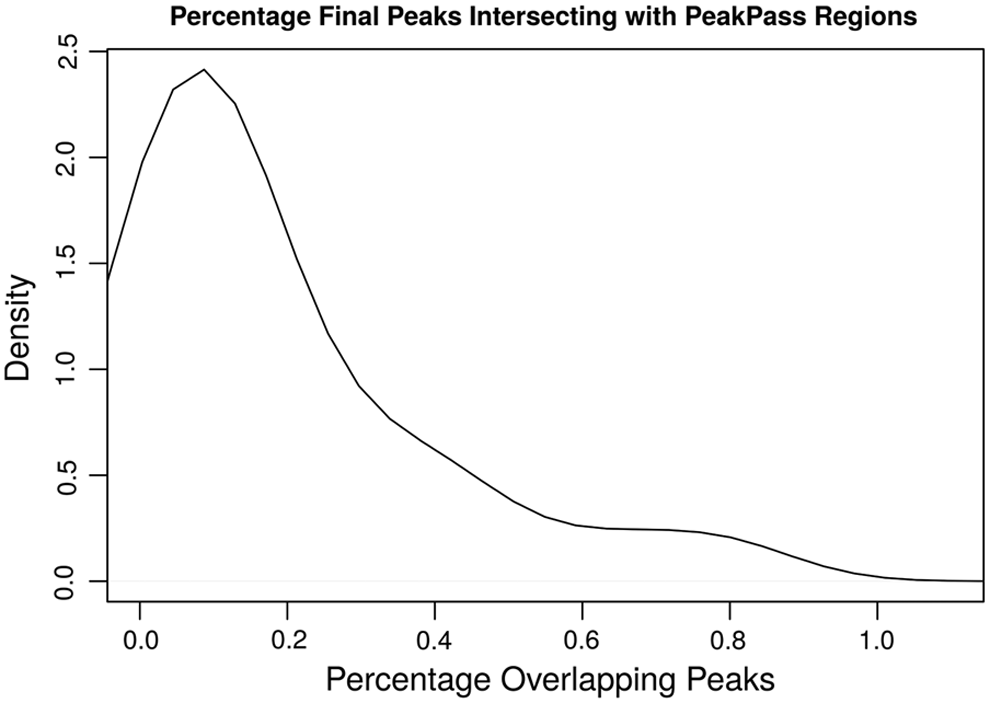
Percentage of final ChIP-Seq peaks that intersect with PeakPass blacklist regions.
Blacklist regions are associated with repeat elements (Kundaje, 2019). The number of repeats per kilobase was measured for both the ENCODE blacklist and the PeakPass-predicted blacklist as given in Table 6. Four of the top five repeats from the hg39 ENCODE blacklist are centromeric repeats, some of which are also enriched in the hg19 ENCODE blacklist (Altemose et al., 2014). The PeakPass blacklist contains fewer repeats per kilobase, but contains a larger variety of different repeat types (93 different repeat types in the PeakPass blacklist vs. 15 different repeat types in the ENCODE blacklist).
Relative Frequencies (Per kbp) of the Five Most Frequent Repeats in ENCODE and PeakPass Blacklists for hg38
4. Conclusion
ChIP-Seq experiments are often plagued by genomic regions that produce artifacts and noise. The underlying cause of this phenomenon is often unclear and, therefore, quality control is an important step in every ChIP-seq experiment. Our PeakPass algorithm uses classification to generate genome-scale blacklists that try to protect against problematic genomic regions. Owing to the extreme class imbalance, this task is challenging for most algorithms and we have compared six different classifiers to identify a suitable algorithm. The random forest classifier has outperformed the other classifiers in most of the assessed metrics, and it has shown the best performance for classifying genomic regions as blacklist regions using the features we selected. Hence, we have selected this algorithm as PeakPass' classification engine.
To evaluate the quality of PeakPass predictions, we have generated a blacklist for the current version of the human genome (hg38) and compared it with a corresponding ENCODE blacklist. The PeakPass blacklist is considerably larger and increases RSC above the ENCODE blacklist for hg38 by ∼50%. PeakPass also results in an enrichment of reads from 500 bp to 20,000 bp upstream of the TSS, and in transcripts. These metrics are particularly important, because transcription factor binding sites are highly likely to be in these regions. The ENCODE blacklist results in a decrease of average SSD, and PeakPass treatment increases this effect. This is likely due to the removal of regions with extremely high read depth. Overall, these results indicate an improvement of ChIP-Seq quality. However, not all data sets benefit equally from blacklisting. We have observed, not surprisingly, that data sets of lower quality show the highest improvements.
Both the PeakPass blacklist and ENCODE blacklist contain an enrichment of different types of genomic repeats. Although the ENCODE contains mostly satellite and centromeric repeats, the PeakPass blacklist contains more retrotransposons such as L1/LINE and Alu/SINE repeats. These types of retrotransposons are frequent in the human genome (Kojima, 2018).
Future avenues of research include validating PeakPass on histone ChIP-Seq experiments, and applying PeakPass cross-species. Another intriguing research direction focuses on a better understanding of the underlying causes of artifact regions. We hypothesize that alignability problems as well as highly polymorphic genomic regions are often responsible for the spurious ChIP-Seq peaks.
Footnotes
Acknowledgments
We thank Robert G. Franks and Miguel Flores-Vergara (both NC State University) for extremely valuable discussions and advice. We are grateful for the ENCODE data sets we used for validating PeakPass. These data were produced by Michael Snyder, Richard Myers, Sherman Weissman, Xiang-Dong Fu, Kevin Struhl, Bradley Bernstein, John Stamatoyannopoulos, Peggy Farnham, and Vishwanath Iyer.
Author Disclosure Statement
The authors declare they have no conflicting financial interests.
Funding Information
This study was supported, in part, by the National Science Foundation (Grant No. IOS-1355019).