




Abstract
Due to the current limitations of sequencing technologies, de novo genome assembly is typically carried out in two stages, namely contig (sequence) assembly and scaffolding. While scaffolding is computationally easier than sequence assembly, the scaffolding problem can be challenging due to the high repetitive content of eukaryotic genomes, possible mis-joins in assembled contigs, and inaccuracies in the linkage information. Genome scaffolding tools either use paired-end/mate-pair/linked/Hi-C reads or genome-wide maps (optical, physical, or genetic) as linkage information. Optical maps (in particular Bionano Genomics maps) have been extensively used in many recent large-scale genome assembly projects (e.g., goat, apple, barley, maize, quinoa, sea bass, among others). However, the most commonly used scaffolding tools have a serious limitation: they can only deal with one optical map at a time, forcing users to alternate or iterate over multiple maps. In this article, we introduce a novel scaffolding algorithm called OMGS (Optical Map-based Genome Scaffolding) that for the first time can take advantages of multiple optical maps. OMGS solves several optimization problems to generate scaffolds with optimal contiguity and correctness. Extensive experimental results demonstrate that our tool outperforms existing methods when multiple optical maps are available and produces comparable scaffolds using a single optical map.
Introduction
Genome assembly is a fundamental problem in genomics and computational biology. Due to the current limitations of sequencing technologies, the assembly is typically carried out in two stages, namely contig (sequence) assembly and scaffolding. Scaffolds are arrangements of oriented contigs with gaps representing the estimated distance separating them. The scaffolding process can vastly improve the assembly contiguity and can produce chromosome-level assemblies. Despite significant algorithmic progress, the scaffolding problem can be challenging due to the high repetitive content of eukaryotic genomes, possible mis-joins in assembled contigs, and the inaccuracies of the linkage information.
Genome scaffolding tools either use paired-end/mate-pair/linked/Hi-C reads or genome-wide maps. The first group includes scaffolding tools for second generation sequencing data, such as Bambus (Pop et al., 2004; Koren et al., 2011), GRASS (Gritsenko et al., 2012), MIP (Salmela et al., 2011), Opera (Gao et al., 2011), SCARPA (Donmez and Brudno, 2012), SOPRA (Dayarian et al., 2010), and SSPACE (Boetzer et al., 2010) and the scaffolding modules from assemblers ABySS (Simpson et al., 2009), SGA (Simpson and Durbin, 2012), and SOAPdenovo2 (Luo et al., 2012). Since the relative orientation and approximate distance between paired-end/mate-pair/linked/Hi-C reads are known, the consistent alignment of a sufficient number of reads to two contigs can indicate their relative order, their orientation, and the distance between them. An extensive comparison of scaffolding methods in this first group of tools can be found in Hunt et al. (2014).
The second group uses genome-wide maps such as genetic maps (Tang et al., 2015), physical maps, or optical maps. According to the markers provided by these maps, contigs can be anchored to specific positions so that their order and orientations can be determined. The distance between contigs can also be estimated with varying degree of accuracy depending on the density of the map.
The optical mapping technologies currently on the market (e.g., BioNano Genomics Irys systems and OpGen Argus) allow computational biologists to produce genome-wide maps by fingerprinting long DNA molecules (up to 1 Mb), using nicking restriction enzymes (Samad et al., 1995). Linear DNA fragments are stretched on a glass surface or in a nanochannel array, and then the locations of restriction sites are identified with the help of dyes or fluorescent labels. The results are imaged and aligned to each other to map the locations of the restriction sites relative to each other. While the assembly process for optical molecules is highly reliable, there is clear evidence that a small fraction of the optical molecules is chimeric (Jiao et al., 2017).
A few scaffolding algorithms that use optical maps are available. SOMA appears to be the first published tool that can take advantage of optical maps, but it can only deal with a nonfragmented optical map (Nagarajan et al., 2008). The scaffolding tool proposed in Saha and Rajasekaran (2014) was used for two bacterial genomes Yersinia pestis and Yersinia enterocolitica, but the software is no longer publicly available. In the last few years, Bionano optical maps have become very popular and have been used to improve the assembly contiguity in many large-scale de novo genome assembly projects (e.g., goat, apple, barley, maize, quinoa, and sea bass) (Pendleton et al., 2015; Bickhart et al., 2017; Daccord et al., 2017; Mascher et al., 2017). To the best of our knowledge, the main tools used to generate scaffolds using Bionano optical maps are
Both
Problem Definition
The input to the problem is the genome assembly to be scaffolded (represented by a set of assembled contigs) and one or more optical maps (represented by a set of sets of genomic distances). We use
An optical map is composed by a set of optical molecules, each of which is represented by an ordered set of positions for the restriction enzyme sites. As said, optical molecules are obtained by an assembly process similar to sequence assembly, but we will reserve the term contig for sequenced contigs. We use
A series of practical factors make the problem of scaffolding nontrivial. These factors include imprecisions in optical maps (e.g., mis-joins introduced during the assembly of the optical map) (Jiao et al., 2017), unreliable alignments between contigs and optical molecules, and multiple inconsistent anchoring positions for the same contigs. As a consequence, it is appropriate to frame this scaffolding problem as an optimization problem.
We are now ready to define the problem. We are given an assembly represented by a set of contigs C, a set of optical map molecules M, and a set of alignments
Methods
As said, our proposed method is composed of two phases: scaffold detection and gap estimation. In the first phase, contigs are grouped into scaffolds, and the order of contigs in each scaffold is determined. In the second phase, distances between neighboring contigs assigned to scaffolds are estimated. The pipeline of the proposed algorithm is illustrated in Figure 1.
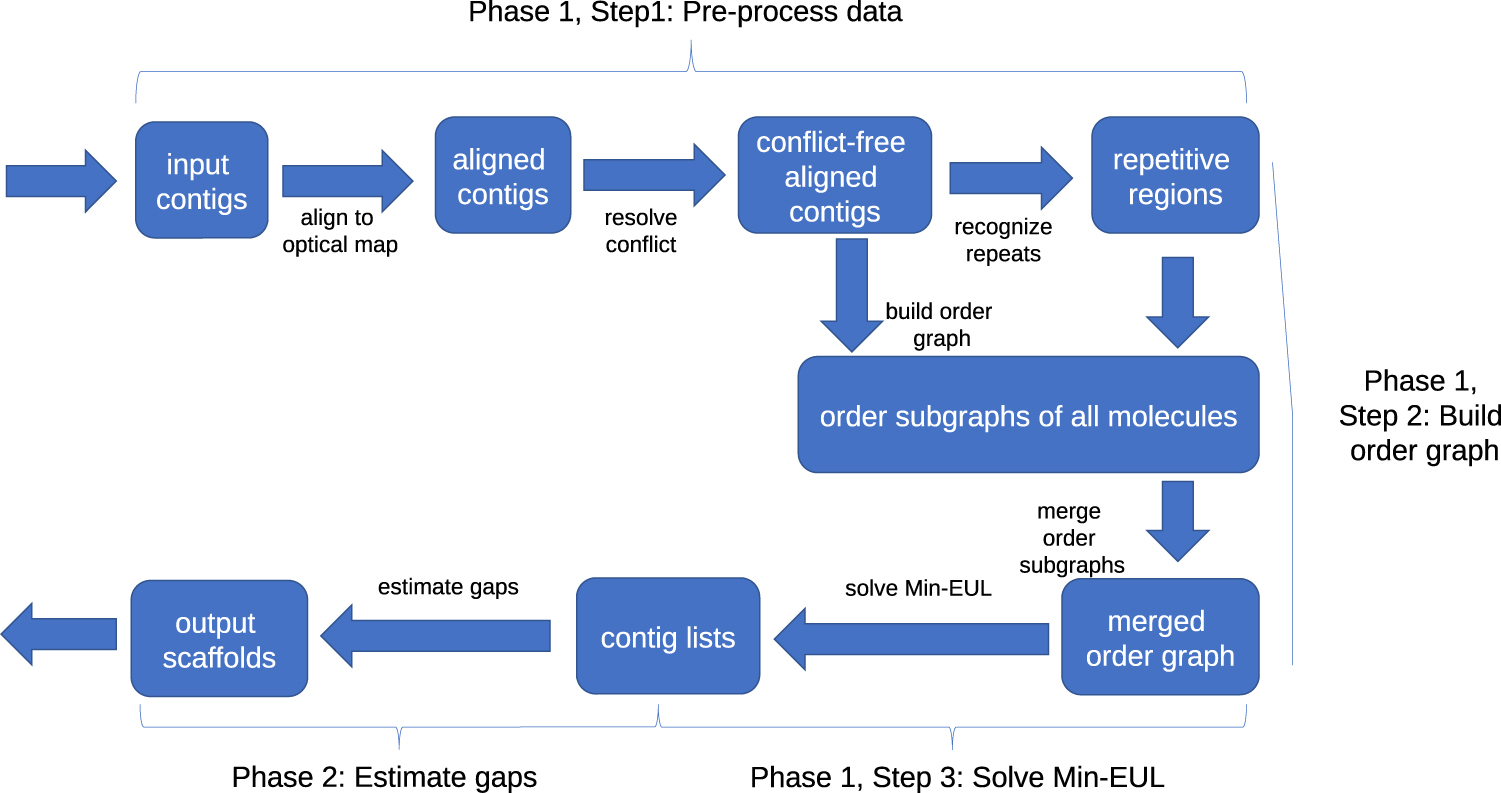
Pipeline of the proposed algorithm.
Phase 1 has three major steps. In Step 1, we align in silico-digested chimeric-free contigs to the optical maps (e.g., for a Bionano optical map, we use
Building the order graph
The order graph O is a directed weighted graph, in which each vertex represents a contig. Given two contigs ci and cj aligned to an optical molecule o with alignments ai and aj, we create a directed edge
Directed edge
We recognize repetitive regions in optical molecules based on the distribution of restriction enzyme sites. For a molecule o with n sites, let mi be the coordinate of the ith site for
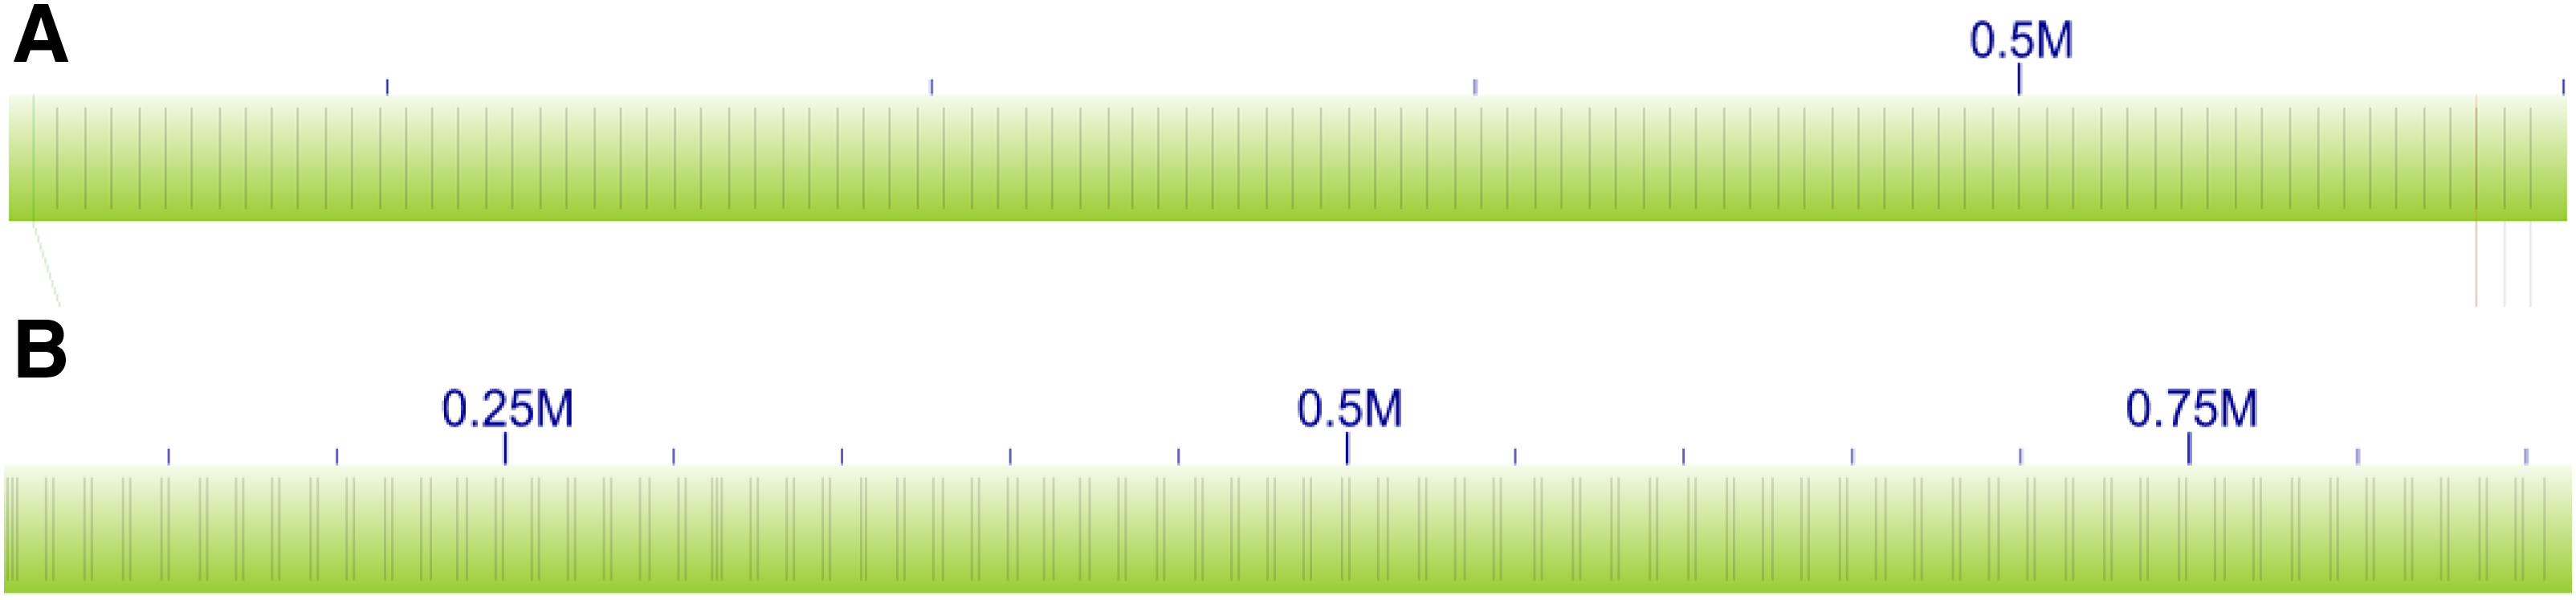
Examples of single-site repetitive region
In our statistical test we assume that the values in the distance lists that belong to repetitive regions are independent and identically distributed as a Gaussian. We further assume that each specific distance list (
By maximizing
Then, we carry out the test on the statistic
for
defined when
Once the order graph of each optical molecule is built, we connect all the order graphs, which share the same contigs using the association graph introduced in Pan et al. (2018). The association graph is an undirected graph in which each vertex represents an optical molecule, and an edge indicates that the two molecules share at least one contig aligned to both of them. We use depth first search (DFS) to first build a spanning forest of the association graph. Then, we traverse each spanning tree and connect the corresponding order subgraph to the final order graph. Every time we add a new graph, new vertices and new edges might be added. If an edge already exist, the weights of the new edges are added to the weights of existing edges.
Once the order graph O is finalized, we generate the ordered sequence of contigs in each scaffold. In the ideal case, each connected component Oi of O is a directed acyclic graph (DAG) because the genome is one-dimensional and the order of any pair of contigs is unique. In practice however, Oi may contain cycles caused by the inaccuracy of the alignments and mis-joins in optical molecules. To convert each cyclic component Oi into a DAG, we solve the
We then break each DAG Gi of connected component Oi into subgraphs as follows. In each subgraph, we require the order of every pair of vertices to be uniquely determined by the directed edges. This allows us to uniquely determine the order of the contigs for each scaffold. The formal definition of this optimization problem is as follows.
In Theorem 1 below, we show that the Minimum Edge Unique Linearization (
Proof. First, we show that
Now we show that
Given the complexity of
Proof. For sake of contradiction, we assume that
As said,
Phase 2: estimating gaps
Let
In the ideal case, dj should be a sample of a single li (i.e.,
Where
Finally, we add
Experimental Results
We compared OMGS against KSU
Experimental results on cowpea
Cowpea is a diploid with a chromosome number
In addition to standard contiguity statistics (N50*, L50 † ), total assembled size, and scaffold length distribution, we determined incorrect/chimeric scaffolds by comparing them against the high-density genetic map available from Muñoz-Amatriaín et al. (2017). We BLASTed 121-bp long design sequence for the 51,128 genome-wide single nucleotide polymorphisms (SNPs) described in Muñoz-Amatriaín et al. (2017) against each assembly, then we identified which contigs had SNPs mapped to them, and what linkage group (chromosome) of the genetic map those mapped SNPs belonged to. Chimeric contigs were revealed when their mapped SNPs belonged to more than one linkage group. The last line of Tables 1 and 2 reports the total size of contigs in each assembly for which (i) they have at least one SNP mapped to it and (ii) all SNPs belong to the same linkage group (i.e., likely to be nonchimeric).
Comparing Optical Map-Based Genome Scaffolding, SewingMachine, and HybridScaffold on a Cowpea Assembly Using One or Two Optical Maps
Comparing Optical Map-Based Genome Scaffolding, SewingMachine, and HybridScaffold on a Cowpea Assembly Using One or Two Optical Maps
Numbers in boldface highlight the best N50 and scaffold consistency with the genetic map for one map (BspQI and BssSI) or two maps (“A+B” refers to the use of map A followed by map B, “A&B” refers to the use of both maps at the same time).
HS,
Comparing Optical Map-Based Genome Scaffolding, SewingMachine, and HybridScaffold on a Cowpea Assembly Using Optical Maps Corrected by Chimericognizer
Numbers in boldface highlight the best N50 and scaffold consistency with the genetic map for one map (BspQI and BssSI) or two maps (“A+B” refers to the use of map A followed by map B, “A&B” refers to the use of both maps at the same time).
As said, the three scaffolding tools were run on a chimera-free assembly of cowpea described above using two available Bionano Genomics optical maps (the first obtained using the BspQI nicking enzyme, and the second obtained with the BssSI nicking enzyme). Since
Table 1 shows that when using a single optical map, OMGS can generate comparable or better scaffolds than
We also compared the performance of OMGS,
D. melanogaster has four pairs of chromosomes: three autosomes and one pair of sex chromosomes. The fruit fly's genome is about 139.5 Mb. We downloaded three D. melanogaster assemblies generated in Solares et al. (2018) (https://github.com/danrdanny/Nanopore_ISO1). The first assembly (295 contigs, total size 141 Mb, N50 = 3 Mb) was generated using
As said, all tools were run with default parameters, with the exception of OMGS' minimum confidence, which was set at 20 (default is 15). To evaluate the performance of OMGS,
Table 3 reports the main statistics for the three D. melanogaster scaffolded assemblies. Even with one map, OMGS' scaffolds are better than
Comparing Optical Map-Based Genome Scaffolding, SewingMachine, and HybridScaffold on Three Drosophila melanogaster Assemblies (Produced by Miniasm, Canu, and Dbg2Olc) Using the BspQI Optical Map
Comparing Optical Map-Based Genome Scaffolding, SewingMachine, and HybridScaffold on Three Drosophila melanogaster Assemblies (Produced by Miniasm, Canu, and Dbg2Olc) Using the BspQI Optical Map
Numbers in boldface highlight the best N50 and the best scaffold consistency with the reference genome.
We presented a scaffolding tool called OMGS for improving the contiguity of de novo genome assembly using one or multiple optical maps. OMGS solves several optimization problems to generate scaffolds with optimal contiguity and correctness. Experimental results on V. unguiculata and D. melanogaster clearly demonstrate that OMGS outperforms
Footnotes
Author Disclosure Statement
The authors declare they have no competing financial interests.
Funding Information
This work was supported, in part, by National Science Foundation grants IIS-1814359, IOS-1543963, IIS-1526742, and IIS-1646333, the Natural Science Foundation of China grant 61772197, and the National Key Research and Development Program of China grant 2018YFC0910404.