
Abstract
Whole-genome bisulfite sequencing (WGBS) provides a precise measure of methylation across the genome, yet presents a challenge in identifying differentially methylated regions (DMRs) between different conditions. Many methods have been developed, which focus primarily on the setting of two-group comparison. We develop a DMR detecting method MethCP for WGBS data, which is applicable for a wide range of experimental designs beyond the two-group comparisons, such as time-course data. MethCP identifies DMRs based on change point detection, which naturally segments the genome and provides region-level differential analysis. For simple two-group comparison, we show that our method outperforms developed methods in accurately detecting the complete DMR on a simulated data set and an Arabidopsis data set. Moreover, we show that MethCP is capable of detecting wide regions with small effect sizes, which can be common in some settings, but existing techniques are poor in detecting such DMRs. We also demonstrate the use of MethCP for time-course data on another data set after methylation throughout seed germination in Arabidopsis.
Introduction
DNA methylation is an important epigenetic mechanism for regulation of gene expression. Methylation is a process by which methyl groups are added to DNA cytosine (C) molecules. The methylation of promoter sites, in particular, is negatively correlated with gene expression while methylation in gene bodies is positively correlated with gene expression. Whole-genome bisulfite sequencing (WGBS) allows for precise measurement of DNA methylation across the genome. In brief, when DNA is treated with bisulfite, the unmethylated cytosines are converted to uracil (U), leaving methylated cytosines unchanged. Sequencing of bisulfite-treated DNA and mapping of the sequenced reads to a reference genome then provide a quantification of the level of methylation at each cytosine. Methylation occurs in three different contexts: CG, CHG, and CHH (where H corresponds to A, T, or C). We just refer to methylation of individual cytosine nucleotides.
In the analysis of BS-Seq data, a common interest is to identify regions of the genome where methylation patterns differ across populations of interest. Such regions are called differentially methylated regions (DMRs). Identifying DMRs are generally considered preferable than detection of individually differentially methylated cytosines (DMCs) from both statistical and biological perspectives (Teschendorff and Relton, 2018). DNA methylation shows strong local patterns, and it is believed that region-level differences are more biologically important. Because of the low coverage and the fact that nearby cytosines usually have similar levels, combining them into regions substantially improves statistical power and lowers the false discovery rate. For the downstream analysis, reporting regions also reduce the redundancy.
A number of methods have been developed to identify regions from BS-Seq data that show differential methylation between two groups of samples [see (Shafi et al., 2018) for a detailed review]. One common strategy is to perform a test at every cytosine that appropriately accounts for the proportions and then use these significant results to determine the DMRs. For example, methylKit (Akalin et al., 2012) performs either a logistic regression test or Fisher's exact test per-cytosine; RADMeth (Dolzhenko and Smith, 2014) uses a β-binomial regression, and a log-likelihood ratio test; DSS (Feng et al., 2014; Wu et al., 2015; Park and Wu, 2016) uses a Bayesian hierarchical model with β-binomial distribution to model the proportions and tests for per-cytosine significance with a Wald test. Other methods use the local dependency between neighboring cytosines to improve their per-cytosine test. BSmooth (Hansen et al., 2012) and BiSeq (Hebestreit et al., 2013) both use local likelihood regression to estimate an underlying methylation curve, and then test for differences in the smoothed methylation ratios between populations. HMM-DM (Yu and Sun, 2016a,b) and HMM-Fisher (Sun and Yu, 2016; Yu and Sun, 2016a) both use Hidden Markov Models along the genome to account for the dependency between cytosines. For many of these methods, the region is often either predefined or determined by merging adjacent DMCs based on specific criteria such as distance.
Another approach is to directly segment the methylation levels to find DMRs. The method metilene (Jühling et al., 2016) uses a modified circular binary segmentation (CBS) algorithm with statistics based on the mean differences in methylation ratios between two groups. The segments are tested for significance using Kolmogorov–Smirnov or Mann–Whitney U tests until the test results do not improve or the number of cytosines is too small.
We, too, propose a segmentation approach, MethCP, for finding DMRs from BS-Seq data. MethCP uses as input the results of a per-cytosine test statistic, like one of the methods already described, uses this input to segment the genome into regions, and then identifies which of those regions are DMRs. Our method, therefore, takes into account the coverages and biological variance between samples. Furthermore, all of the previously mentioned methods, including existing segmentation methods, are developed for simple two-group comparisons, and are not straightforward to extend to more general experimental designs. MethCP, on the other hand, can be used in a wide variety of experimental designs.
We show through simulations that our method more accurately identifies regions differentially methylated between groups, as compared with competing methods. We illustrate the performance of MethCP on experimental data and show that its behavior on experimental data mirrors that of the simulations. We further demonstrate the flexibility of MethCP for use beyond the two-group setting by applying it to a time-course study.
Methods
MethCP assumes as input the results of a per-cytosine test of significance, such as those mentioned previously in the introduction. The main steps of MethCP are to (1) segment the test statistics into regions of similar values and then (2) assign a p-value per region as to whether the region is a DMR.
Let Tk,
In brief, binary segmentation methods involve testing over all of the possible breakpoints (cytosines) for whether there is a change in the mean of T at location
The number of computations required for the segmentation is
The underlying purpose of the segmentation step is to segment the differential region from the undifferentiated regions. After the completion of the segmentation, it remains to determine which of these segmented regions correspond to significant DMRs, rather than their surrounding undifferentiated regions. To classify these regions, we use meta-analysis principles to aggregate the per-cytosine statistics and obtain one single statistic per region, to which we apply significance tests.
We assume that for each cytosine, the calculated statistic Tk can be written as
where the weights wk signify the contribution of cytosine k. Typically in meta-analysis applications, wk is set to be
A test statistic for a region found after segmentation is, therefore, calculated by
In the standard meta-analysis, the individual Tk is often assumed to be independent so that the estimated variance of
In the setting of methylation analysis, we have noted that the individual loci statistics are not independent. Even so, we show through simulation study (Section 3.1) that in using this estimate of
The mentioned approach relies on input statistics that are Gaussian. This can be limiting, since methods often produce other types of statistics, such as Fisher's exact test implemented by methylKit and log-likelihood ratio test from RADMeth. For this reason, we give a further adaptation in MethCP so as to be applicable for any cytosine-based parametric statistics that result in valid p-values. Let
where Φ is the cumulative distribution function of standard Gaussian. MethCP then performs CBS on the zi's to segment the genome.
Region-level statistics can be obtained by aggregating p-values using Fisher's combined probability test (Fisher, 1934) or Stouffer's weighted Z-method (Stouffer et al., 1949; Whitlock, 2005). Namely, for a region i with a set of cytosines Si, let
where wk can be chosen to be constant or given by coverage Ck. We test
To quantify the performance of the methods or similarity of DMR sets detected by different methods, we need to define some measures for whether a region was successfully detected. One simple solution is just to calculate measures of specificity and sensitivity based on the percentage of whether individual cytosines were correctly called to be in a DMR. However, since our goal is to detect regions, this is unsatisfactory. Thus, we extend the specificity and sensitivity to region detection problem. Our framework of evaluation is closely related to supervised measures such as directional Hamming distance and segmentation covering in the image segmentation literature (Huang and Dom, 1995; Pont-Tuset and Marques, 2016). Specifically, to determine whether a detected region is considered a true or false positive (FP), we set a parameter
Furthermore, we see that some DMR methods are biased toward longer or shorter regions (Section 3), which can make comparing methods difficult. To account for different biases of regions found (in the following, we refer to number of cytosines in a region as the length of the region), we calculate the percentage overlap between a detected region and a true region using three different denominators: that of the detected region, that of the true region, and that of the union of the detected and true regions. The three measures can be interpreted as the local measures of precision, recall, and Jaccard index. The first two allowed us to distinguish as to whether methods detected a high percentage of the true regions, versus if a high proportion of the detected regions were truly DMRs. The local Jaccard index allows us to measure the similarity between detected and true regions symmetrically.
We demonstrate our definitions using the local measure of precision—that is, the overlap is determined by the proportion of the detected region that intersects the truth. Denote the detected and true regions set as
where
The mentioned formulas for TP can be extended to local measure of recall or Jaccard index by adjusting the denominator in Equation (6), from
Simulation study
In this section, we applied our method as well as five representative methods (Shafi et al., 2018) BSmooth, HMM-Fisher, DSS, methylKit, and metilene on simulated data with two population groups. Our method, MethCP, was run using the statistics of both DSS and methylKit as input (hereinafter referred to as MethCP-DSS and MethCP-methylKit). We evaluated their performances with the measures described in Section 2.2. The data simulation procedure and details of applying these methods can be found in “B” in Appendix.
A simulation for comparing two population groups
Figure 1 shows the summary of the length of the DMRs detected by the six methods using the default significance level (or test statistic thresholds); we also show the distribution of the lengths of true regions. MethCP and metilene give the closest length distribution to that of the true regions. Although we shortened the smoothing window compared with the default, BSmooth and DSS detect much larger regions. In contrast, HMM-Fisher and methylKit both detect small fragmented regions.
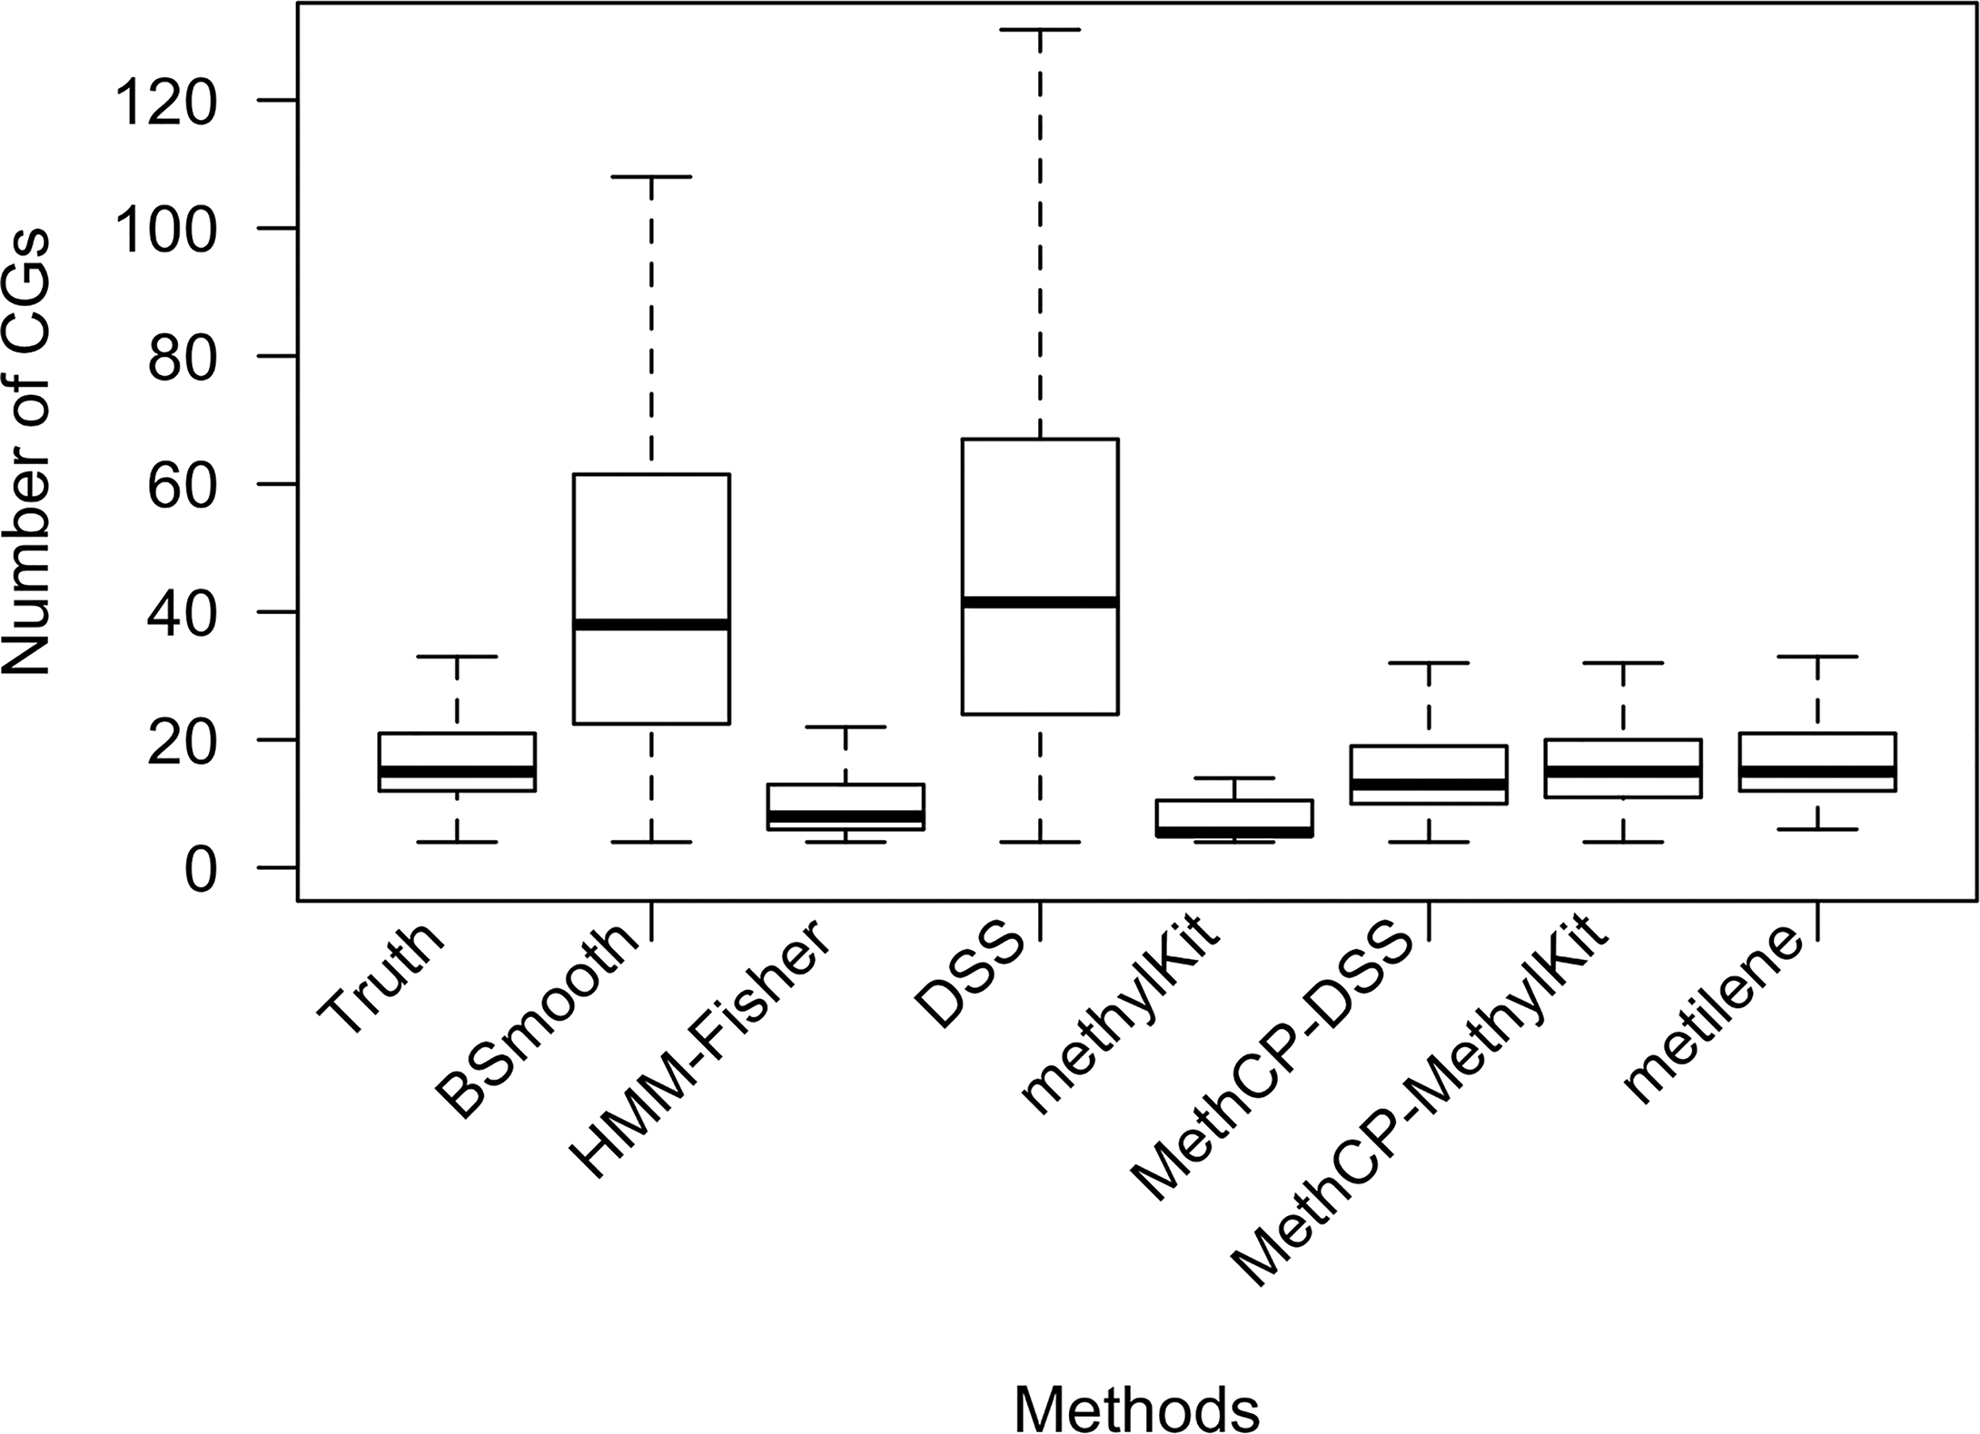
Boxplot of number of CpGs in the DMRs. Number of CpGs in the true DMRs and in the DMRs detected by the seven methods compared for the simulated data. DMRs, differentially methylated regions.
To evaluate the accuracy of the methods on the simulated data, we plot the receiver operating characteristic (ROC) curve for both the local precision (Fig. 2a) and the local recall (Fig. 2b). The local precision requires that a large percentage of the detected region overlaps a true DMR (easier for shorter detected regions and conservative methods), whereas the local recall requires that a large percentage of the true region be overlapped by a detected region (easier for longer detected regions).

ROC curve: method comparison on the simulated data. FPR versus TPR as we change the parameter α for
MethCP-DSS and MethCP-methylKit detect highly similar regions despite using different test statistics as input. For small α, MethCP and metilene achieve the highest TPR across all of the methods. And both
HMM-Fisher and methylKit exhibit the opposite behavior, calling fewer and smaller regions significant, but as a result not obtaining good coverage of the true regions. The DMRs identified by these two methods are generally a subset of the true regions as indicated by the high values of
However, in addition to assessing their overall sensitivity and specificity, we can consider whether the methods actually control the FPR at the desired level, and here we can see an even stronger difference between metilene and MethCP. In particular, for Figure 2a and b, the sold portions of the precision–recall curves indicate where the cutoff was due to the p-value cutoff being <0.05, meaning that control of the FPR at level 0.05 would be indicated by solid portion of the curve not extending beyond the true FPR of 0.05 given in the x-axis. For metilene, however, the solid curve continues beyond true FPR of 0.1 (see “Unzoomed” metilene plot), indicating that metilene is not accurately controlling the FPR. MethCP, in contrast, does not have this property, and is quite conservative, despite having a higher TPR than the other methods.
Recent studies (Eichten and Springer, 2015; Leenen et al., 2016; Breton et al., 2017) have shown that small-magnitude effect sizes are functionally important for DNA methylation and are associated with specific phenotypes. Furthermore, in plants, there exist other contexts of methylation other than CpG pairing (CHG and CHH methylation), where the baseline levels can be much lower, and hence their changes are also much smaller in scale, usually <10%. However, related discoveries have been hampered by a lack of DMR-calling tool addressing this issue (Eichten and Springer, 2015; Breton et al., 2017). We now show through a simulation study that MethCP is the only method of those we consider that is capable of accurately detecting regions with small (<10%) changes in DNA methylation. In fact, none of the DMR detection methods we consider here, other than metilene, even identify any regions with methylation differences <10%, so we focus our comparison only on metilene. We simulated data sets with DMRs that have 2.5%, 5%, 10%, and 20% changes in methylation, and their lengths vary from 25 methylation cytosines to 400 cytosines. As shown in Figure 3, MethCP achieves a high TPR while keeping the FPR low. MethCP consistently has higher TPR and lower FPR throughout the range of values.
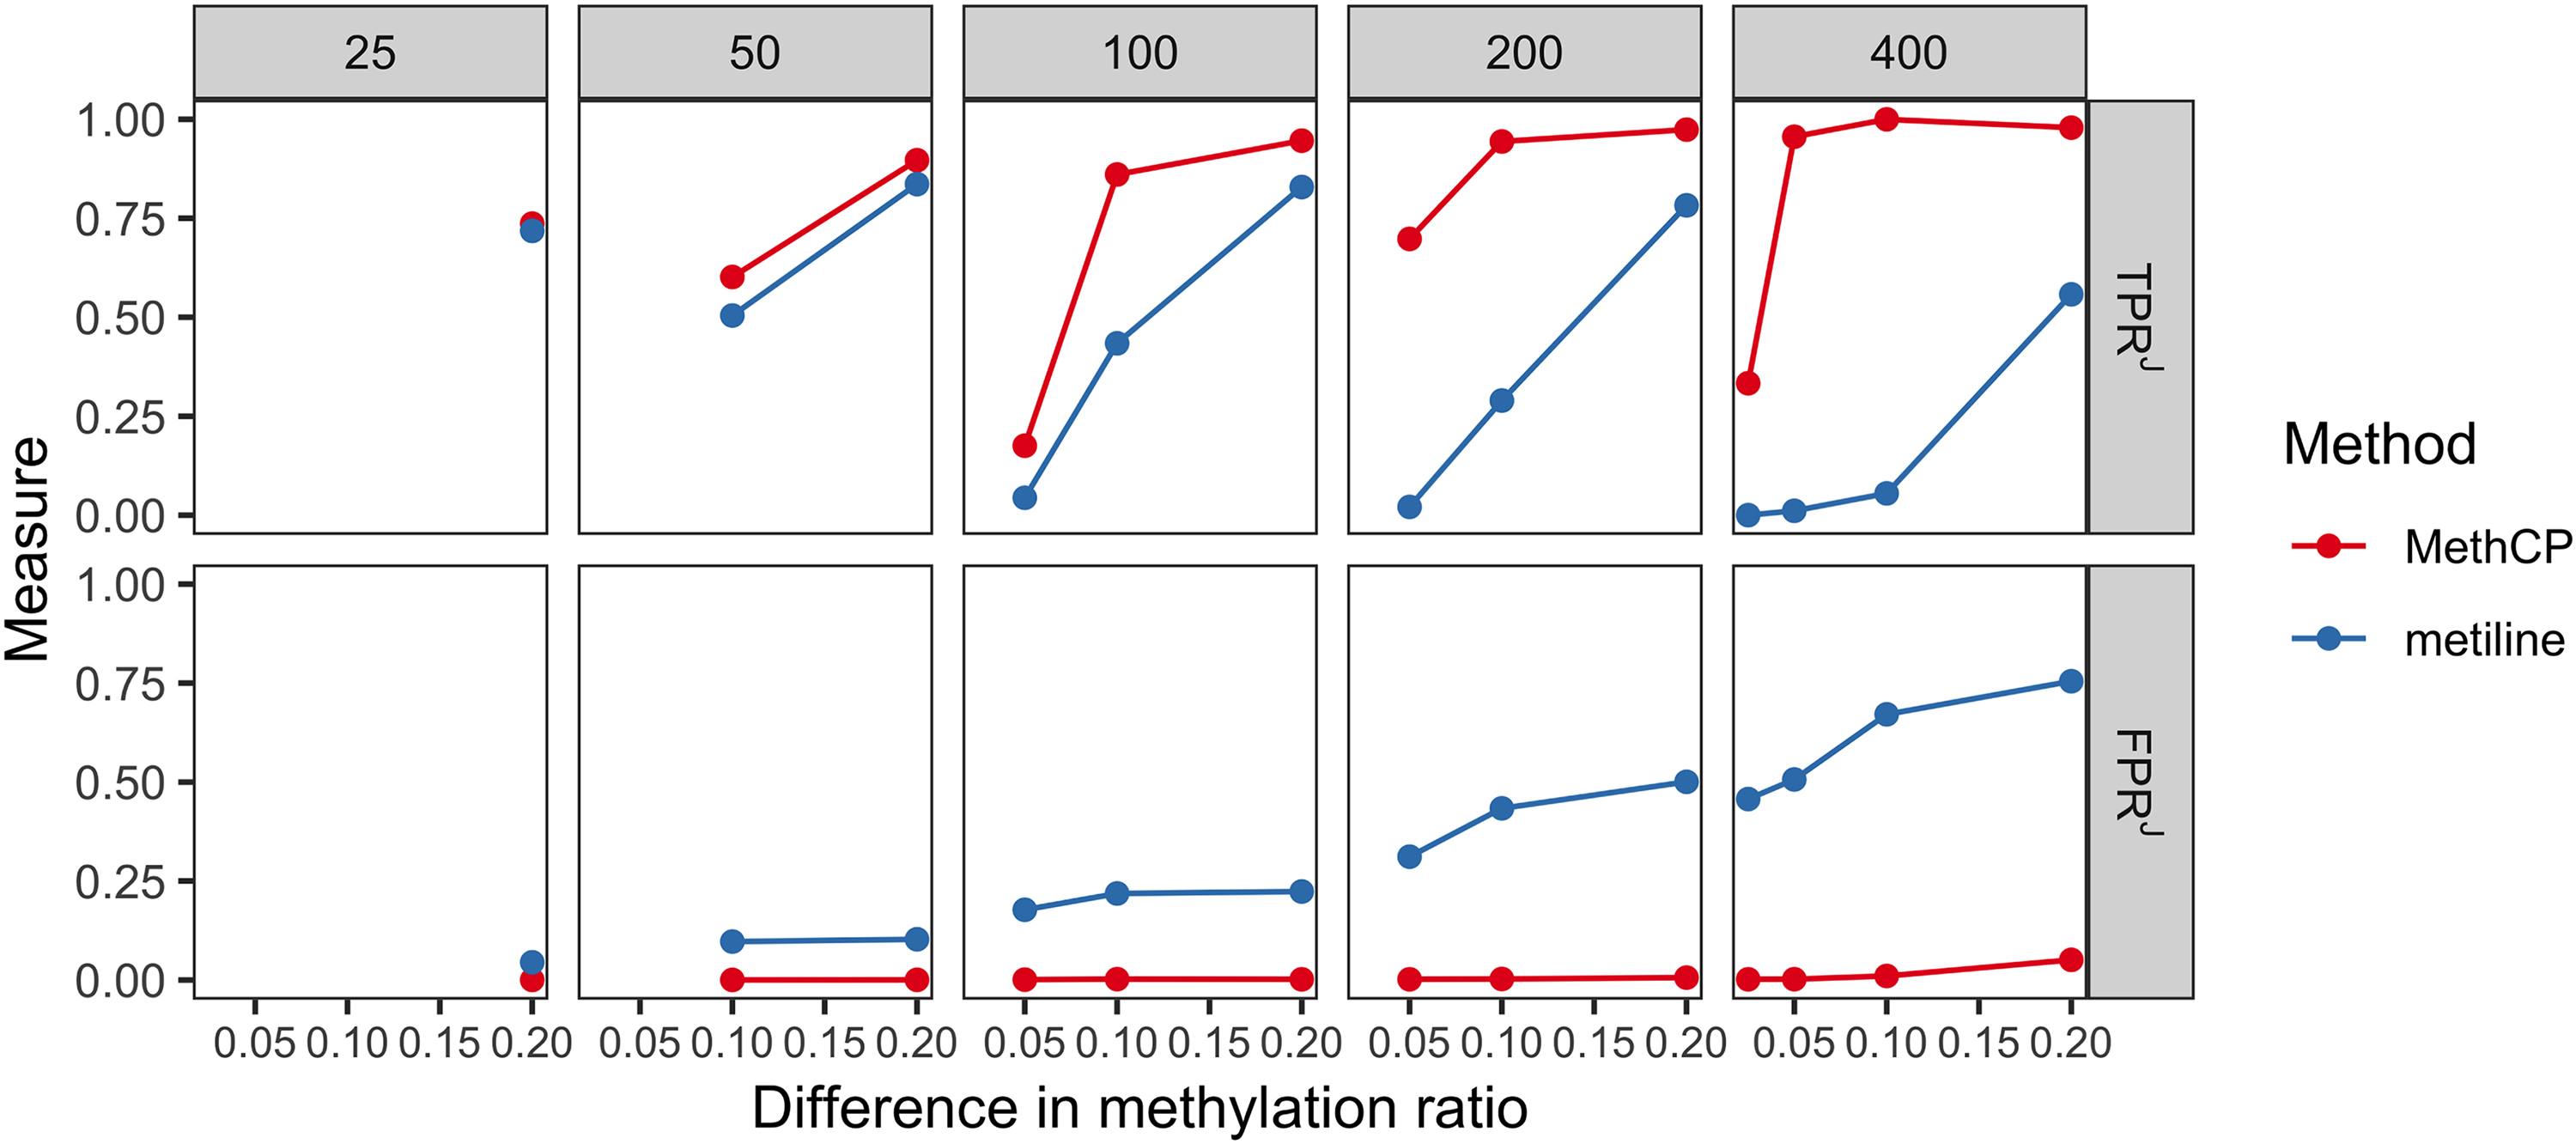
A comparison between metilene and MethCP for the small effect size simulation. Upper panel shows
To further illustrate the performance of MethCP on real data sets, we consider their performance on actual WGBS data set. We do not have WGBS with actual ground truth (i.e., knowledge of where DMR regions are and are not located), so we use a data set with a relatively large number of replicates that allow us to use permutation methods to give some idea of the performance of the tests; we combine this with a consideration of whether the important features seen in our simulation results are mimicked in real data. We use a WGBS on Arabidopsis Thaliana [(Coleman-Derr and Zilberman, 2012), Gene Expression Omnibus (GEO) accession number GSE39045] that contained six biological replicates each of a wild-type control line and an H2A.Z mutant line.
Figure 4a shows the boxplot of the size of the DMRs detected (i.e., number of CpGs) under significance level 10−2 and FDR-corrected level 10−2. We see that the sizes of the regions are mostly fairly consistent across the different significance levels, and that the relative sizes between methods resemble that of the simulated data. Namely, DSS and BSmooth detect large regions, HMM-Fisher and methylKit identified small regions, and MethCP-DSS and MethCP-methylKit identified highly similar regions despite different test statistics they use. metilene, stands out as sensitive to the significance level, with smaller required significance levels resulting in more small regions being reported (and HMM-Fisher finds no DMRs at more stringent significance levels).

To compare the FPs produced by six methods, we create a null data set, that is, one with no region of cytosines different between the two groups, by randomly assigning the six controls into two groups of three. Individual differences between the mean methylation levels, combined with the fact that nearby sytosines have similar methylation levels in a sample, meaning that by chance there are regions of cytosines that are different between the two random groups. Therefore, we further permute the data in two different ways to create null data sets that have no DMRs between the two groups. The first method permutes the sequencing counts (methylated and unmethylated count pairs) across the samples for each CpG position (Permutation 1). The second method permutes the cytosine positions but keeps the sample labels, thus breaking any residual spatial signal between neighboring CpGs (Permutation 2). Figure 4 shows the number of DMRs and proportion of CpGs detected by each method. In both permutations, MethCP has a small number of DMRs relative to the other methods. Indeed for the second permutation, MethCP detects 0 DMRs. For the first permutation, only HMM-Fisher finds fewer, but HMM-Fisher also appears to have less power in detecting the real differences, Figure 4b. If we further consider how well MethCP assigns individual cytosines correctly to DMRs (i.e., its ability to detect DMCs), then MethCP also results in fewer false assignments of individual cytosines than the other methods, which is surprising since it is not a DMC method.
We would note that despite detecting fewer FP DMRs in our permutation analysis, MethCP still remains competitive, as compared with the other methods, in terms of the number of DMRs it finds on the real data (Fig. 4b), indicating that it is not suffering from a lack of power. Both DSS and methylKit find more regions, but we see from our permutation analysis that DSS and methylKit tend to find many more FPs than MethCP. Furthermore, the regions found by methylKit are small (Fig. 4a), suggesting that like in the simulations methylKit may be missing or fragmenting large parts of the true DMRs.
A strength of MethCP is that it is flexible for a wide variety of experimental designs, because it only requires an appropriate per-cytosine test statistic, which can be calculated by standard tests on a per-cytosine basis. We demonstrate this utility on a seed germination data set from A. thaliana ((Kawakatsu et al., 2017), GEO accession number GSE94712). The data are generated from tracking over time germinating seeds after the dry seeds are given water. Two experimental conditions are considered: wild-type plants (Col-0) and ros1, dml2, and dml3 triple demethylase mutants plants (rdd). ROS1, DML2, and DML3 are closely related DNA demethylation enzymes that mainly act in vegetative tissues. Two replicates were collected at each of 0–4 days after introduction of water (DAI), resulting in six time points, including the dry seed.
The original authors did not conduct a DMR analysis between these groups. Rather they did a two-group test of the overall methylation levels by grouping together the summarized methylation ratios and testing for the difference in distributions at each time point. They saw a modest overall increase between the two groups at each time point. We perform a DMR analysis with MethCP by fitting per CpG a linear model on the arcsine-transformed methylation ratios and choosing the statistic Tk to be the difference between the time coefficient of Col-0 and rdd groups. Appendix Figure A1 shows the histogram of DMR length. Unlike the length distribution given in Section 3.2, we detect some very large DMRs with small changes of methylation over time. Our ability to pick up both small and long regions gives us the ability to see multiple effects. We see the overall general increase, reported by the authors, represented by the long regions of small increase (Fig. 5, regions in black). But we also detect some smaller regions with an opposite pattern of decrease in methylation in the mutant samples (Fig. 5, regions in gray).

Heatmap of DMRs for the seed germination data set. Heatmap of average methylation levels in the DMRs detected. Here we show the results for CpG context. For each condition and each DMR, we subtract the ratios by the average dry seed methylation ratios, so that the heatmap better shows the changes with time. We annotate the DMRs with >200 CpGs as large regions.
We proposed a method MethCP for identifying DMRs. We presented the results of MethCP-methylKit and MethCP-DSS on simulated and real data sets. And we showed that MethCP gives better accuracy and a lower number of FPs than existing methods. We also show that MethCP is the only method that detects large DMRs with small effect sizes, which is prevalent in DMR methylation data. Other than comparing two groups, we presented an example of a time-course study with MethCP. Our framework is in principle flexible for general experimental design, assuming that an appropriate single-cytosine test statistic can be calculated. Thus the method can be expanded immediately to more complicated situations, such as comparing multiple groups or measurements of methylation status over time or developmental progression.
Software Availability
The package MethCP has been submitted to Bioconductor, and is currently available at https://github.com/boyinggong/MethCP
Footnotes
Author Disclosure Statement
The authors declare they have no conflicting financial interests.
Funding Information
This study was supported, in part, by a DOE BER grant, DE-SC0014081.