
Abstract
Waterborne diseases are present major health problems to humanity especially in rural communities where many individuals belong to the lower socioeconomic classes (SECs). The impacts of introducing waterborne disease control measures for such communities are investigated by considering a waterborne disease model. The model is extended by introducing treatment of infected individuals and water purification as control measures. The possible benefits of considering these control measures for the various SECs are investigated. Further analyses show how different degrees of control impact the rate at which waterborne diseases are spread across SECs. The disease control model is validated by using it to study the cholera outbreak in Haiti.
1. Introduction
Waterborne diseases present major health problems to humanity. These diseases are mostly found in rural communities where there is limited access to clean drinking water and sanitation. Approximately 1.1 billion people worldwide do not have access to clean water (WHO, 2013b). Statistics also reveal that ∼700,000 children die every year due to diarrhea caused by unsafe drinking water and poor sanitation (UNICEF, 2012). The major causes of waterborne diseases include unclean drinking water, dirty environments, and poor hygiene (WHO, 2013a). A significant number of deaths due to waterborne disease infections could be prevented through effective control measures such as accessibility to clean drinking water, better hygiene practices, and provision of adequate sanitation facilities (WHO, 2013a). The use of mathematical models that incorporate control measures such as vaccination, quarantine, water purification, and treatment of infected individuals have been explored theoretically (Lucas et al., 2005; Zaman et al., 2008; Miller Neilan at al., 2010; Kara and Batabyal, 2011; Mwasa and Tchuenche, 2011; Sanches et al., 2011; Tchuenche et al., 2011; Collins and Duffy, 2016; Collins and Govinder, 2016).
In reality, individuals in any community belong to various socioeconomic classes (SECs). Considering socioeconomic status or SEC in developing mathematical models for studying the dynamics of waterborne diseases are expected to yield improved results. Studies have shown that socioeconomic status or SEC can have an impact on the spread of waterborne diseases (Hove-Musekwa et al., 2011; Root et al., 2013; Collins et al., 2015). This is correlated to the facts that individuals in a lower SEC are known for reasons of poverty, malnutrition, and poor sanitation to have no or little access to clean water as well as poor living standards. In contrast, individuals in a higher SEC are known to have better living standards, cleaner living environments, a better quality of education, better jobs with higher incomes, and unlimited access to clean drinking water. Based on these explanations, it is expected that individuals in a lower SEC will be more exposed to waterborne diseases, whereas those in a higher SEC will be less exposed to waterborne diseases.
Studies that show the importance of SECs include the work of Collins et al. (2015) that developed a waterborne disease model and used it to investigate the effects of SECs on waterborne disease dynamics. Hove-Musekwa et al. (2011) investigated the effects of malnutrition in the spread of cholera using a mathematical model. Other studies that have investigated the dynamics of waterborne diseases can be found in Capasso and Paveri-Fontana (1979), Codeco (2001), Pourabbas et al. (2001), Ghosh et al. (2004), Hartley et al. (2006), King et al. (2008), Tien and Earn (2010), Hove-Musekwa et al. (2011), Mukandavire et al. (2011a, 2011b), Sanches et al. (2011), Robertson et al. (2013), and Collins and Govinder (2014). The aforementioned studies have contributed significantly toward the ongoing research in waterborne disease dynamics and control. As far as we know, the impact of control measures (water purification and treatment of infected individuals) on the dynamics of waterborne disease for a multiple socioeconomic community have not yet been explored. The goal of this study is to investigate the effects of control measures (treatment and water purification) on the waterborne disease dynamics for a multiple socioeconomic community.
2. Model Development
In this section, we consider an SEC model for a waterborne disease proposed by Collins et al. (2015). We extend the model by introducing two waterborne disease control measures: water purification and treatment to obtain
The meanings of variables and parameter in Equation (1) can be found in Tables 1 and 2, respectively. We use the subscript 1 to represent the lower socioeconomic class (SEC 1), whereas the subscript 2 is used to represent the higher socioeconomic class (SEC 2).
Meaning of Variables
SEC, socioeconomic class.
Meaning of Parameters
To conduct the dynamical system analysis of Equation (1), we nondimensionalized the model. The nondimensionalized version of the model is obtained by making the following assumptions:
where
The initial conditions for the Equation (2) are as follows:
3. Model Analyses
In this section, we conduct dynamical system analyses of Equation (2) with the aim of improving our understanding of the dynamics and control measures of waterborne diseases for a multiple socioeconomic community (i.e., lower SEC and higher SEC) where there is a waterborne disease outbreak.
3.1. Basic reproduction number
Mathematically, Equation (2) has a unique disease-free equilibrium
Equation (3) depends totally on the rate of migration
where
where
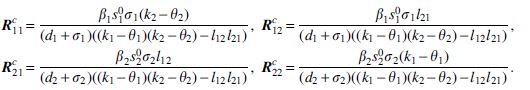
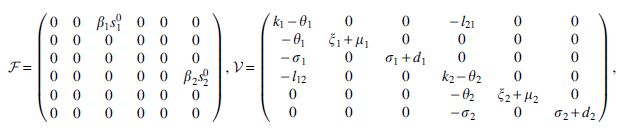
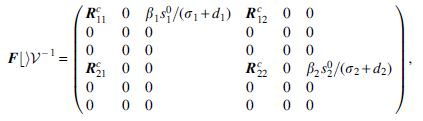
Mathematically, the basic reproduction number  can be determined as the dominant eigenvalue of the next-generation matrix
  . Thus, we obtain as

In the absence of any waterborne disease control measure, the basic reproduction number becomes

where
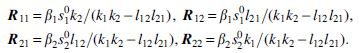
Clearly,

and this shows that introducing control measures have an effect in reducing the number of secondary infections.
Suppose that

where

Algebraically, we can show that

In contrast, if

where
Mathematically, we can also show that

The inequalities (Eq. 8) and (Eq. 10) suggest that introducing either water purification or the treatment of infected individuals to a multiple socioeconomic community with a waterborne disease outbreak results in a greater reduction in the spread of infection as compared with when no control measure is introduced. However, the case when two control measures are introduced simultaneously gives better results.
3.2. The type reproduction number
The type reproduction number  for a waterborne disease Equation (2) represents the expected number of secondary infections produced by an infected individual in a susceptible SEC i over his/her lifetime in the presence of treatment and water purification (Robertson et al., 2013). The proper control effort required to eradicate the spread of infection while targeting control on one particular SEC while having no control over reducing the spread of the disease in another SEC can be determined using the type reproduction number (Roberts and Heesterbeek, 2003; Heesterbeek and Roberts, 2007).
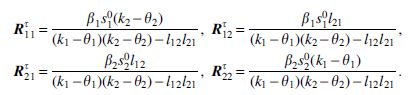
Using the methods in Roberts and Heesterbeek (2003) and Heesterbeek and Roberts (2007), the type reproduction number  associated with the SEC 1 of the waterborne disease Equation (2) can be determined as

provided that  . By a similar method, the type reproduction number
  for SEC 2 is

provided that  .
.
When no control measure is introduced, the type reproduction numbers  and
and  for the SEC 1 and SEC 2, respectively, becomes

Clearly

The inequality (Eq. 14) shows that considering waterborne disease control measures (water purification and treatment) have significant effects in decreasing the rate of secondary infections in either SECs within a community.
When treatment is not considered (i.e.,  and
and  for SEC 1 and SEC 2, respectively, become

Similarly, when water purification is not considered (i.e.,  and
and  for SEC 1 and SEC 2, respectively, become

Mathematically,

These inequalities support the aforementioned results in that the multiple control (treatment and water purification) is optimal, followed by either water purification or treatment and using no control is the worst in reducing waterborne disease infections in a multiple socioeconomic community. More detailed analyses using numerical simulations will be considered to gain further insight into the impact of control measures on the dynamics of waterborne diseases in a multiple socioeconomic community.
4. Numerical Simulations
Numerical simulations are used to support the results obtained analytically. In particular, we numerically explore the effects of control measures on waterborne dynamics for a multiple SEC community. The values of the parameter estimates used for the numerical simulations can be found in Table 3 with references where possible.
Parameter Values for Numerical Simulations
Figure 1 illustrates the possible differences in the dynamics of lower SEC and higher SEC for both infected and susceptible individual. As indicted in the figure, the lower SEC has a higher proportion of infected individuals compared with the higher SEC. These results agree with our analytical predictions and other findings in the literature (see, e.g., Hove-Musekwa et al., 2011). The higher SEC has a higher proportion of susceptible individuals than the lower SEC. The results of our model agree with intuitive expectations, suggesting that it can be used to study and make predictions for real-life situations where a waterborne disease outbreak occurs.
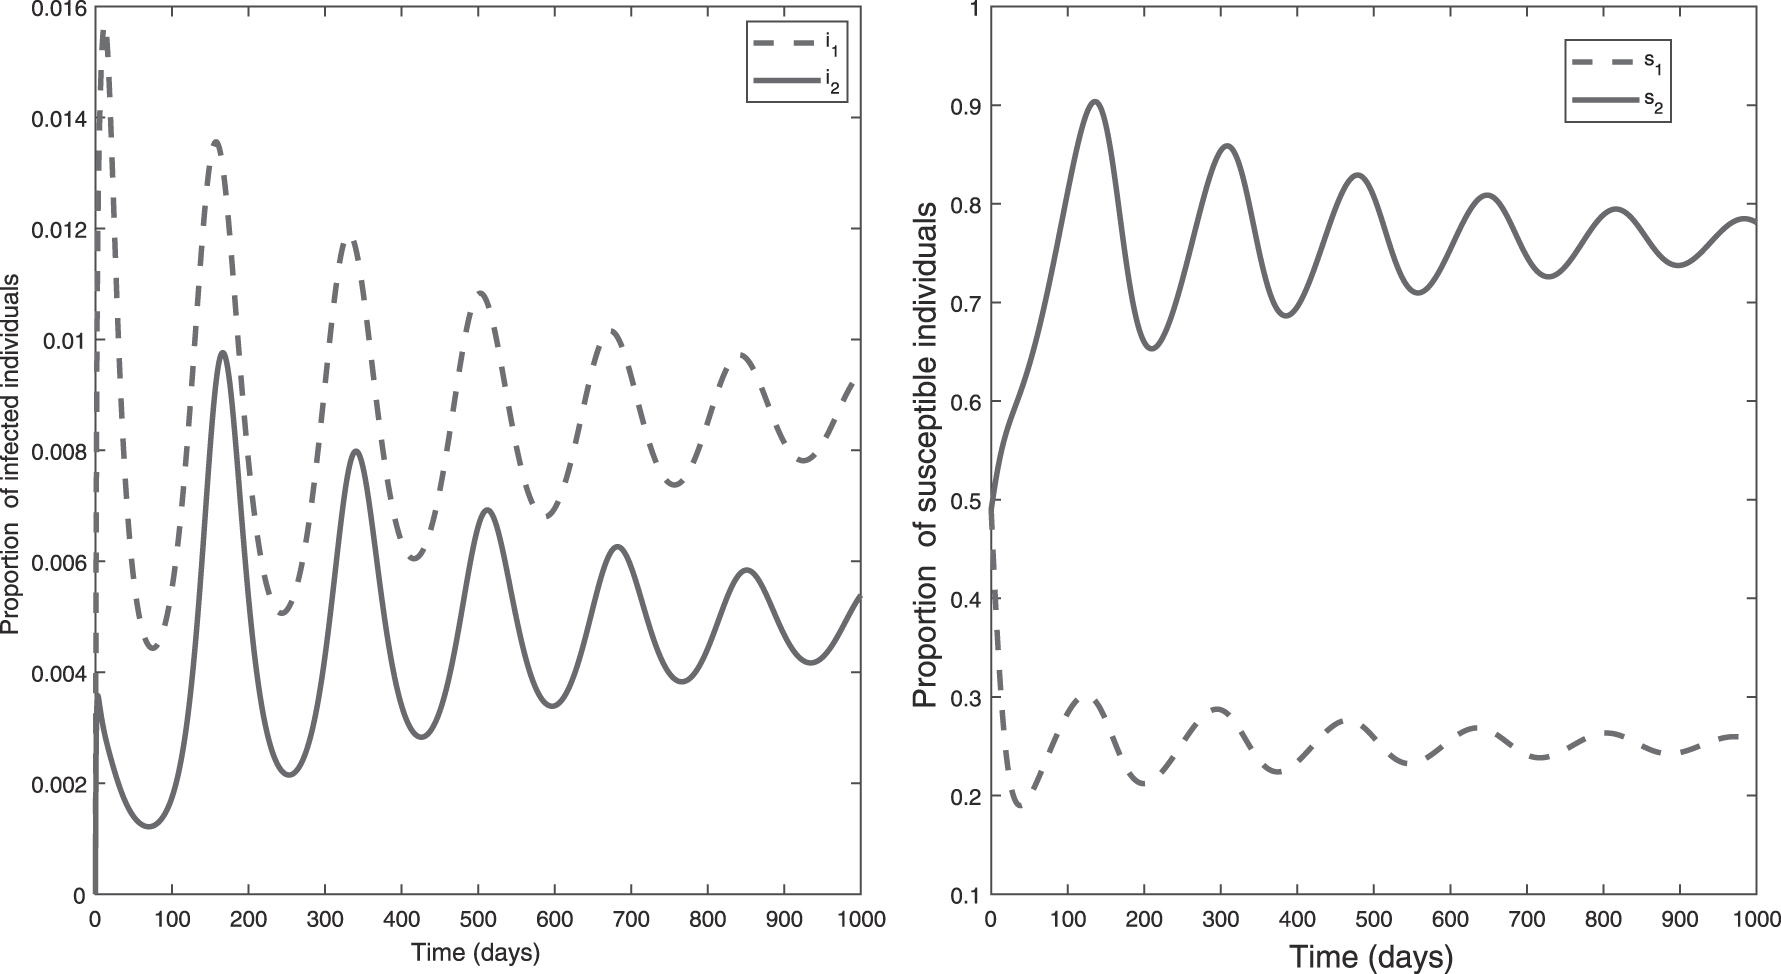
Plot showing the differences in the dynamics of a lower SEC and a higher SEC for both infected and susceptible individuals. SEC, socioeconomic class.
The impact of treatment on decreasing waterborne disease infections across the two SECs is explored by plotting the infected class for various values of treatment rate (Fig. 2). For a more accurate comparison of the impact of treatment across the two SECs, we first consider equal treatment rates for the two SECs. From Figure 2, an increase in treatment rate decreases the infected population across the two SECs. From the figure, introducing equal treatment rates across the two SECs results in faster eradication of infections in the higher SEC. For instance, considering a treatment rate of
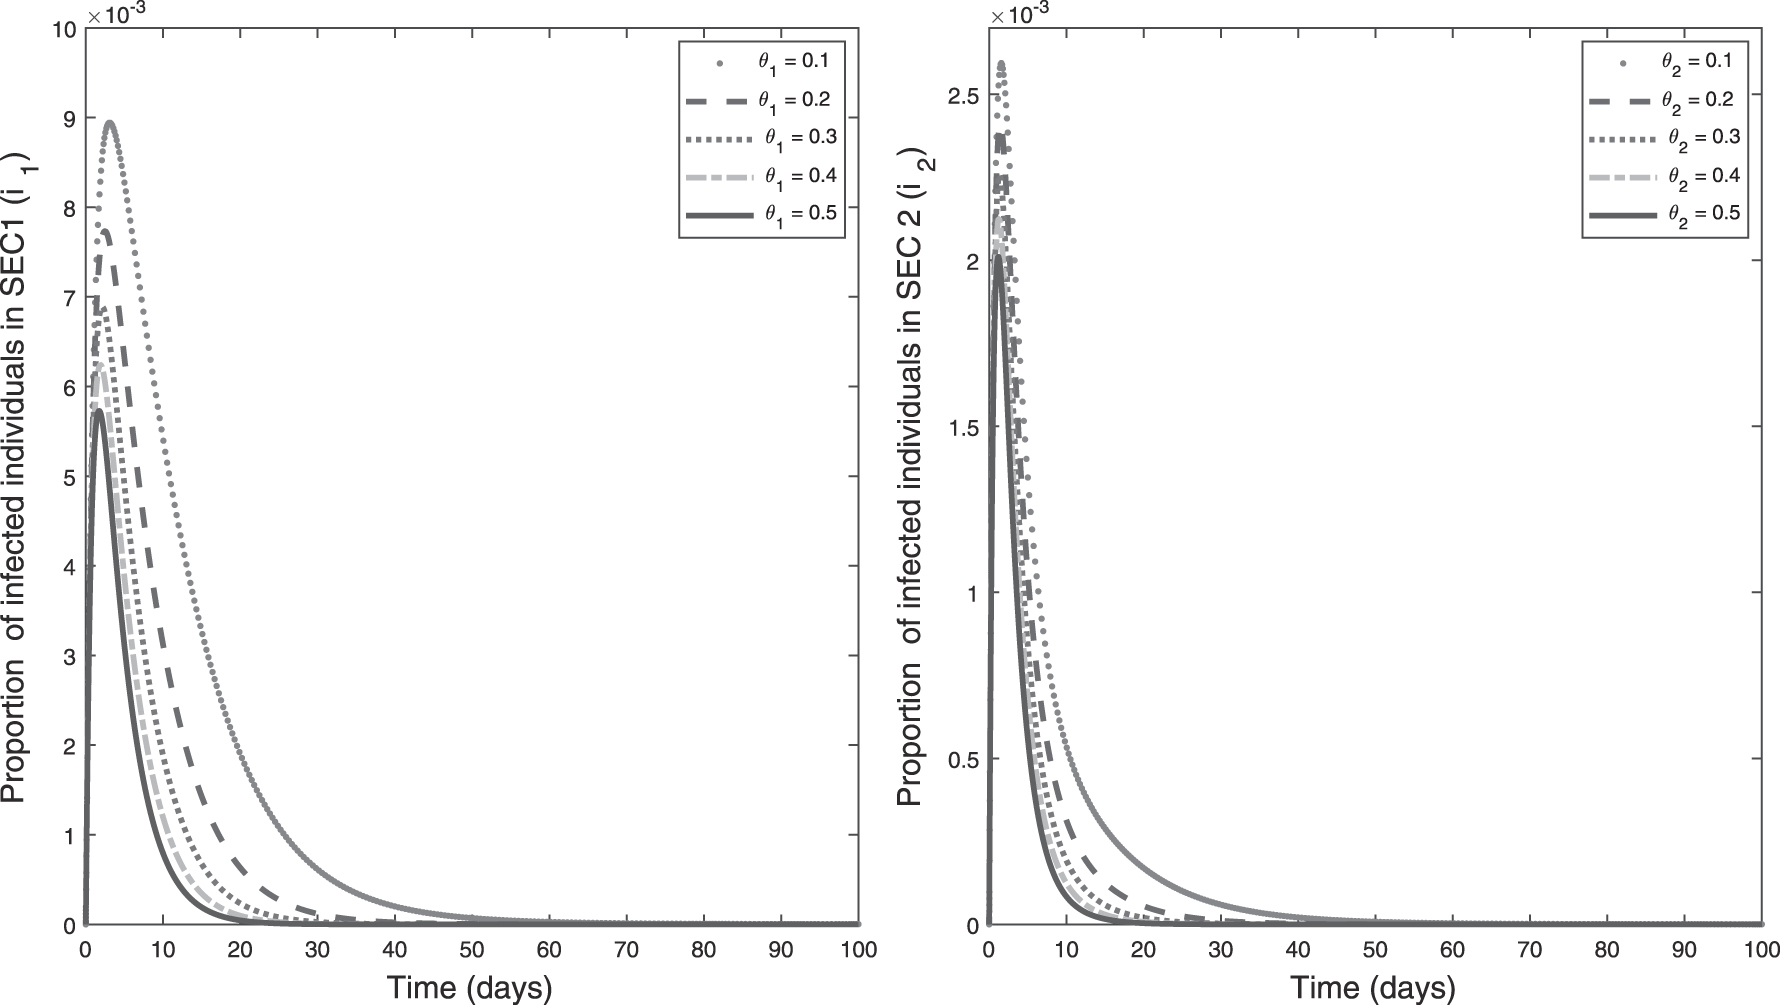
Plot showing the impact of treatment on a lower SEC and a higher SEC.
The impact of water purification on decreasing waterborne disease infections across the two SECs is also explored by plotting the infected class for various values of water purification control parameter (Fig. 3). From the figure, an increase in water purification decreases infections across the two SECs. To compare the impact of water purification on the two SECs, we consider equal water purification control for the two SECs. Introducing equal water purification control across the two SECs yields a better result in eradication of infections in the higher SEC (Fig. 3). This shows that the two SECs will also require different water purification effort to completely eradicate infections.

Plot showing the impact of water purification on a lower SEC and a higher SEC.
Figure 4 illustrates the effects of different control measures on lower SEC and higher SEC. These results show that introducing waterborne disease control measures have significant effects in decreasing waterborne disease infections across the two SECs. For the lower SEC, introducing water purification yields better results in decreasing infections as compared with treatment as a control. Based on these findings, introducing water purification as a control measure is highly recommended in a lower SEC. In contrast, for the higher SEC, treatment of infected individuals has a greater impact than water purification in decreasing the spread of the disease. Therefore, effective treatment of infected individuals is highly recommended as a control measure for decreasing waterborne disease infections in higher SECs. For both classes, we discover from the figure that the multiple control yields the best results. Thus, the multiple control is the best control and should be considered whenever a waterborne outbreak occurs in any SEC. However, if the community cannot afford multiple control measures, our results suggest that a lower SEC should consider water purification, whereas the higher SEC should consider treatment. These results agree with intuitive expectation. Thus, our model can be used to study and make prediction in a real-life situation where waterborne disease occurs in a multiple SEC community.
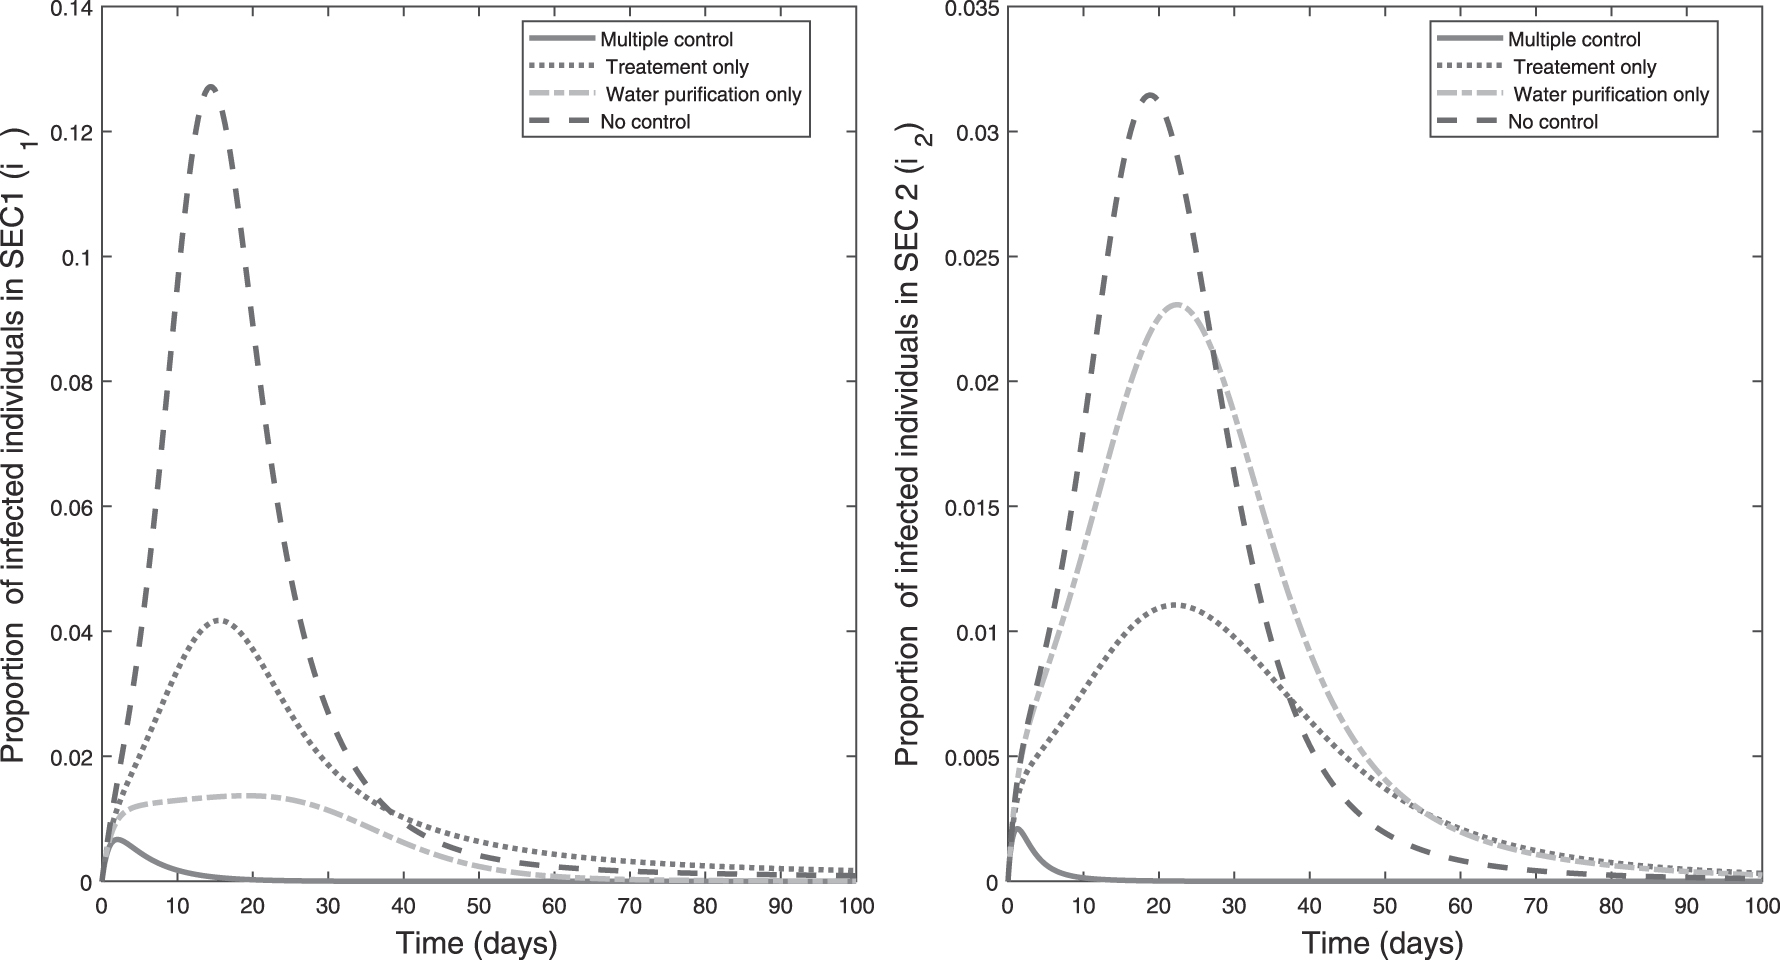
Plot showing the effects of different control measures [treatment only, water purification only, or multiple control (treatment + water purification)] on a lower SEC and a higher SEC.
Also from Figure 4, ∼13% of the lower SEC are infected with a waterborne disease, whereas <4% of the higher SEC are infected with the disease. These results support our earlier findings that individuals in the lower SEC are more exposed to waterborne disease infections than those in higher SEC. Based on these findings, it will be more effective to focus appropriate control measures for each SEC according to their levels of exposure to waterborne disease.
5. A Case Study of the Haiti Cholera Outbreak
The 2010 cholera outbreak in Haiti is considered as a realistic case study to validate our Equation (2). Even though the real data available to us from the cholera outbreak in Haiti do not give the exact information on socioeconomic status of individuals, which is needed to use our model, we still use these data to illustrate how our model can be used to investigate cholera outbreaks, as well as make future predictions of these outbreaks in cholera endemic communities with multiple SECs. According to the Haitian Ministry of Public Health and Population (MSPP), a cholera outbreak was confirmed in Haiti on October 21, 2010 (Mukandavire et al., 2013; MSPP Haiti, 2013) and by August 4, 2013, about 669,396 cases and 8217 deaths had been reported since the outbreak began (CDC, 2013a). In this study, we consider the number of reported hospitalized cholera cases in Haiti from October 30, 2010 to December 24, 2012.
Haiti is divided into 10 administrative departments (governing regions) and the capital Port-au-Prince. According to the MSPP data, the cumulative number of reported cholera hospitalizations for each department, from October 30, 2010 to December 24, 2012, are given in Figure 5 (MSPP Haiti, 2013). From the figure, the Nord have the greatest number of reported cases followed by Artibonite then Port-au-Prince, whereas the department of Nippes has the smallest number of reported hospitalized cases. Since, our model is rescaled, we need to rescale this population size so that we can fit it with our model. To rescale the population size for each department the regional populations reported in 2009, before the outbreak started, is used (CDC, 2013b). This population size for each department is given in Table 4.

A plot showing the cumulative reported hospitalized cholera cases in each department in Haiti from October 30, 2010 to December 24, 2012.
Population of Departments in Haiti as at 2009
Scaling using the population sizes in Table 4 gives the proportions of cumulative reported hospitalized cholera cases shown in Figure 6 (the per capita cases in each department). Previous research has shown that individuals in lower SECs are more exposed (greater per capita cases) to cholera, whereas those in higher SEC are less exposed (smaller per capita cases) to the disease. Based on this understanding, we assume that the department with the highest per capita cases of cholera represent a lower SEC, whereas the department with the smallest per capita cases of cholera represents a higher SEC. Note, this does not mean that everybody in the lower socioeconomic department have a low socioeconomic status and vice versa, but due to a lack of real data, we have taken this definition to enable us use the available data to validate our model.
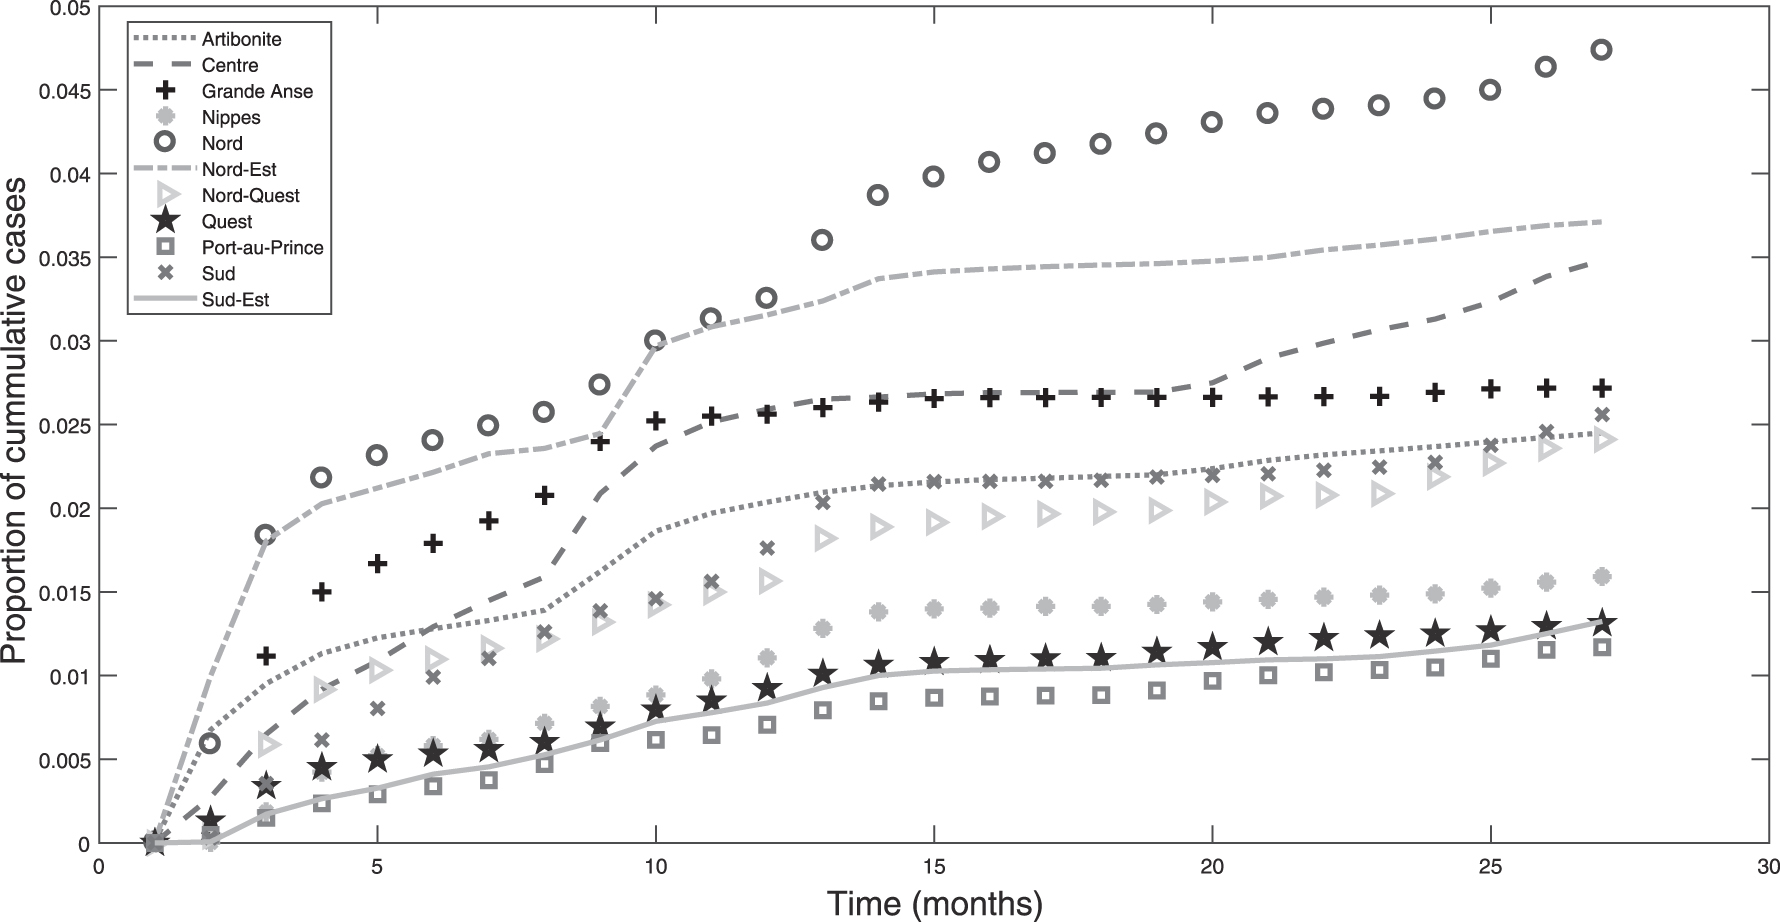
A plot showing the proportion of cumulative reported hospitalized cholera cases in each department in Haiti from October 30, 2010 to December 24, 2012.
From Figure 6, we discover that the department has the highest per capita cases of cholera with ∼5% of cumulative cases. Based on our assumption Nord is a lower socioeconomic department. From the same figure the capital of the Haiti (Port-au-Prince) has the smallest per capita cases of cholera with ∼1% of cumulative cholera cases. Again based on our assumption Port-au-Prince is a higher socioeconomic department. For the capital of the country (Port-au-Prince) to have on average a population with a higher socioeconomic status agrees with expectations. This is because the capital of a country is often characterized with better infrastructure, higher standards of living, better economic conditions, more access to clean water, and so on, which are the characteristics of higher socioeconomic conditions. Also, this is exacerbated in Haiti as the country is extremely poor overall.
Using Port-au-Prince as the higher socioeconomic department and Nord as the lower socioeconomic department, we fit our model to the real data (i.e., proportion of cumulative reported hospitalized cholera cases for these two departments). In fitting the model to the data, the parameters
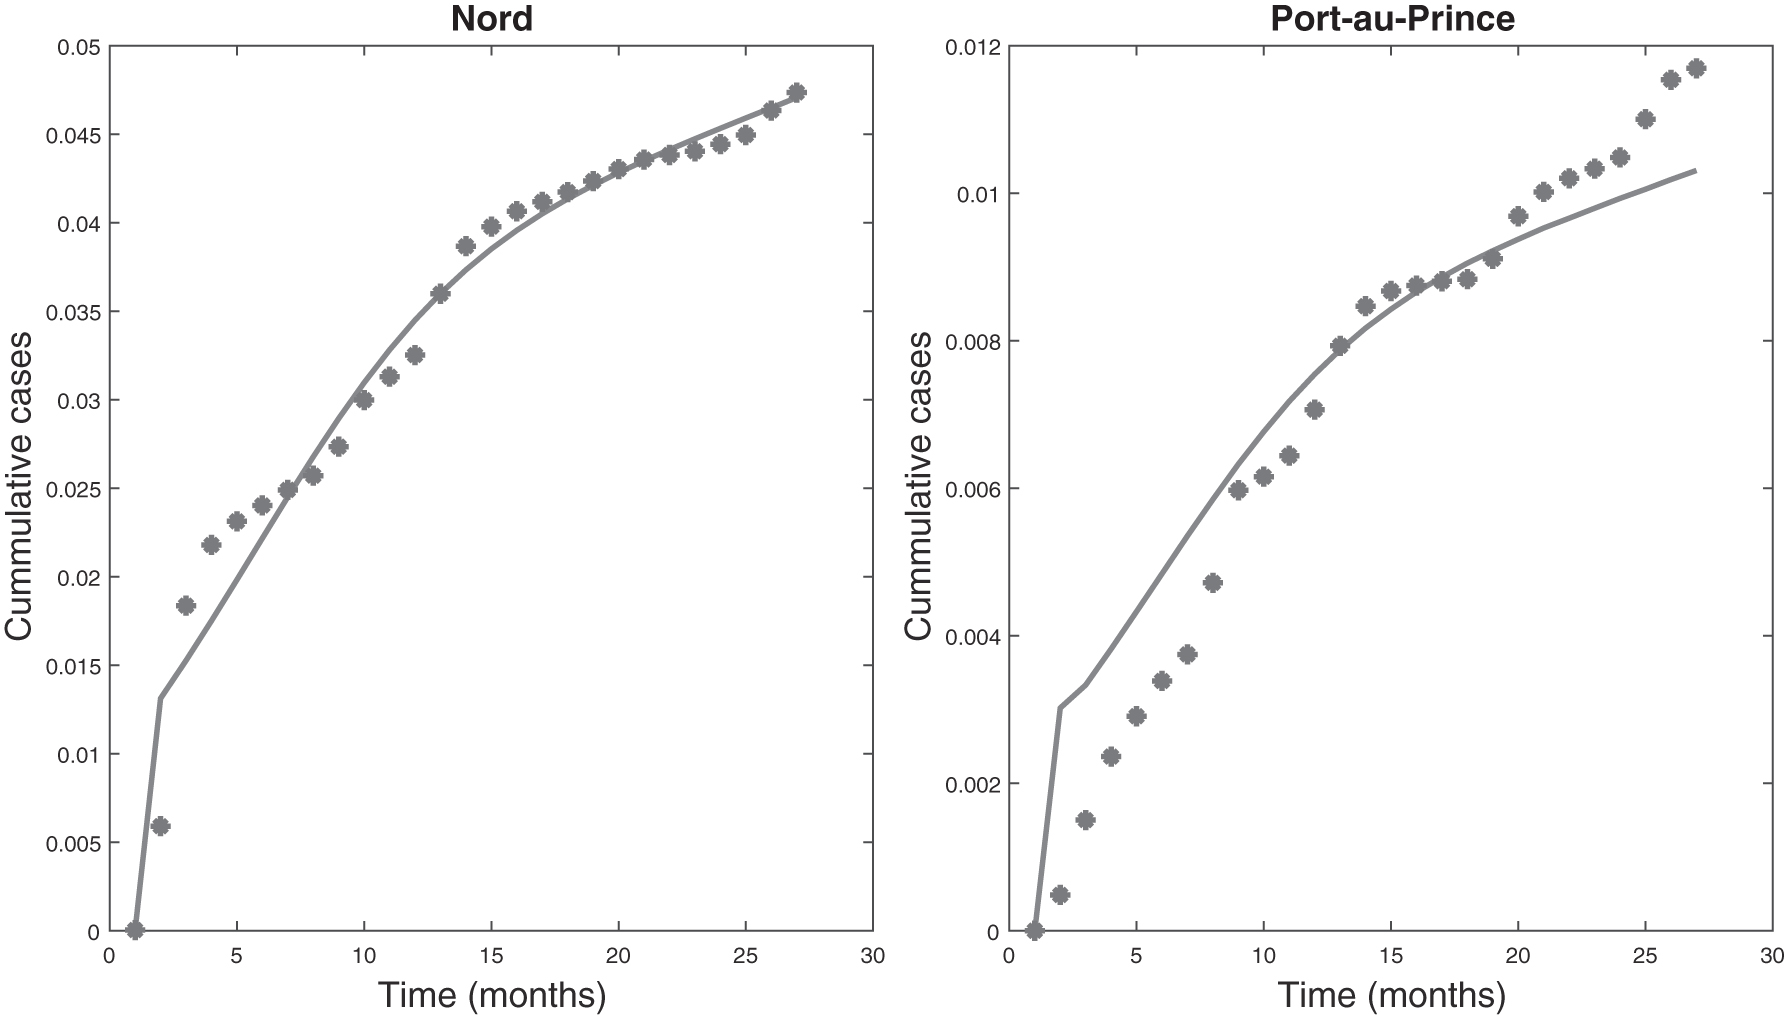
Model fitting of the proportion of cumulative reported cholera cases for Nord (lower socioeconomic department) and Port-au-Prince (higher socioeconomic department) from October 30, 2010 to December 24, 2012. The bold lines represent the model fit and the block represents the reported cases in Haiti.
6. Discussion
The impact of SEC on the dynamics of waterborne diseases has been explored theoretically in a number of studies; however, to our knowledge none of these investigate the impact of control measures on the dynamics of waterborne diseases for a multiple SEC community. This study investigated the impact of control measures in decreasing waterborne disease infections for a community comprising individuals in two SECs (a lower SEC and a higher SEC). For this investigation we used a mathematical model for waterborne disease with SEC formulated by Collins et al. (2015) and extended hereby introducing water purification and treatment as control measures. The possible impacts of these control measures for a multiple SEC community were analyzed. The results of the analyses revealed that introducing either of the control measures (water purification or treatment) has a large impact in decreasing waterborne disease infections for both the two SECs. However, multiple control (i.e., a situation when water purification and treatment are introduced at the same time) has the greatest impact in decreasing waterborne disease infections across the two SECs in the community.
The impact of treatment and water purification in decreasing waterborne disease infections across the two SECs was also explored. It was discovered that introducing equal treatment rates across the two SECs will result in faster eradication of infections in the higher SEC. For instance, considering treatment rate
Numerical simulation using parameter estimates reveal that water purification can be a better single control measure for reducing waterborne disease infections in the lower SEC, whereas treatment can be a better control measure for reducing waterborne disease infections in the higher SEC. These results agree with intuitive expectations. For instance, waterborne diseases are endemic in lower socioeconomic communities, so water purification is expected to yield better results than treatment because it reduces the number of susceptible individuals and consequently reduces the number of infected individuals. For the higher SEC, the waterborne disease is not endemic as they have access to clean water, so prompt treatment is expected to yield better results.
Our analyses and results are dependent to some extent on the particular parameter estimates. However, the results illustrate the possible importance of taking into consideration SEC when developing control measures for waterborne diseases. For all our numerical simulations the lower SECs have a greater number of infected individuals than the higher SECs. Overall, the results of our analyses agree with intuitive expectations for waterborne disease dynamics. Thus, this model could be used to study and/or contain an actual outbreak of waterborne disease in a multiple SEC community. The model in this study considers only two SECs, but in reality it is possible to have more than two SECs in a community. This will be taken into consideration in our future studies.
Finally, we validated our model by using it to study the cholera outbreak in Haiti. By considering the department with the least per capita cases of cholera, which is capital of Haiti (Port-au-Prince) as the higher socioeconomic department and the department with the greatest per capita cases of cholera, which is Nord as the lower socioeconomic department, we fit our model to the real data (i.e., proportion of cumulative reported hospitalized cholera cases for these two departments). The model gives a good fit for both departments, but it is better for Nord. The results of the model fittings demonstrate that our model could be used to study and make predictions on cholera outbreaks in Haiti and other multiple socioeconomic communities where waterborne diseases are endemic.
Overall this study illustrates the possible importance of considering SEC when designing systems to prevent and control waterborne diseases. This finding is especially true for poorer economies where budgets are likely to be tighter. This study also illustrates the possible use of models in these systems processes.
Footnotes
Acknowledgments
The authors are grateful to Dr. J. Tien, Ohio State University, and his research group, for providing them with the Haiti data to validate their model.
Author Disclosure Statement
The authors declare they have no conflicting financial interests.
Funding Information
The authors received no external funding for this research.