
Abstract
High-dimensional mass cytometry (Cytometry by Time-Of-Flight; CyTOF) is a multiparametric single-cell approach that allows for more than 40 parameters to be evaluated simultaneously, opening the possibility to dissect cellular heterogeneity and elucidate functional interactions between different cell types. However, the complexity of these data makes analysis and interpretation daunting. We created High-throughput Population Profiler (HiPPO), a tool that reduces the complexity of the CyTOF data and allows homogeneous clusters of cells to be visualized in an intuitive manner. Each subpopulation is mapped to the Population Analysis Database (PANDA), an open-source, manually curated database containing protein expression profiles for selected markers of primary cells, allowing for cell type abundance in the analyzed samples to be monitored. Custom cell definitions can be submitted for targeted identifications. All cell clusters, regardless of their annotation status, are available for further analyses. HiPPO also conducts nonparametric tests to determine whether differences in protein expression levels between conditions are significant. HiPPO strikes a balance between diagnostic power and computational burden. Its minimal computational footprint allows for subpopulations in a heterogeneous sample to be identified and quantified quickly.
1. Introduction
The human organism is estimated to contain more than 37 trillion cells, which can be grouped into almost 200 heterotypic cell lineages by differences in their protein expression profiles and activation of signaling pathways (Bianconi et al., 2013). This variability allows multicellular organisms to assume different phenotypic states in isogenic genomes. Physiological processes are often regulated by the interaction and mutual dependency of different cell types. Thus, many biological processes can only be studied in complex heterogeneous cell mixtures and depend on analytical methods that are able to quantify cellular features at single-cell resolution.
With the advent of Cytometry by Time-Of-Flight (CyTOF), tools and algorithms are being developed to enumerate and quantitatively characterize diverse aspects of cellular behavior in millions of individual cells (Bendall et al., 2012, 2014; Levine et al., 2015; Van Gassen et al., 2015; Samusik et al., 2016). Currently, CyTOF technology allows for the quantification of more than 40 simultaneous parameters at single-cell resolution. A primary challenge is to visualize the underlying data generated. This is often achieved by taking advantage of dimensionality reduction approaches.
Spanning-Tree Progression Analysis of Density-Normalized Events (SPADE) was the first multistep algorithm explicitly dedicated for reducing the multidimensionality of mass cytometry data (Qiu et al., 2011; Chen and Kotecha, 2014). Though being a powerful method for translational investigations, SPADE has limitations. The minimum-spanning tree is a rigid graphical representation that can prevent similar cell clusters from positioning correctly to form a structure that recaptures the underlying biology reliably. In addition, the density-dependent down-sampling has a stochastic nature that prevents the graphs from being deterministic.
Visualization of t-Distributed Stochastic Neighbor Embedding (viSNE) is another popular method that illustrates the structure of high-dimensional data without implementing a clustering process (Amir et al., 2013). The computational burden of this method makes its application to large datasets difficult. Further, subtle differences in cell populations can be masked.
A second challenge in the analysis of mass cytometry data is represented by the stratification of cellular events into homogeneous subpopulations (clusters) according to the expression of selected markers. PhenoGraph (Levine et al., 2015) models the tSNE high-dimensional space, producing a nearest-neighbor graph. Each cell is then represented by a node and connected by a set of edges to its most similar cells. Dense regions (clusters) are then detected by searching for sets of highly interconnected nodes.
X-shift algorithm (Samusik et al., 2016) constructs a weighted k-nearest-neighbor density estimation (kNN-DE) graph. Similar to PhenoGraph, clusters of cells are detected by looking at the graph density. Repeating the procedure allows the optimal number of clusters to be determined without the risk of under-clustering or over-fragmentation of the data.
CITRUS provides an unsupervised and automated process to identify cellular populations showing the best correlation with experimental endpoints previously uploaded by the user (Bruggner et al., 2014). CITRUS manages two or more sets of cytometry data, automatically defining cellular populations and calculating cluster characteristics.
Despite their key features, these methods still do not explore the nature of identified clusters of cells.
We developed High-throughput Population Profiler (HiPPO) to visualize the global structure of cytometry data and to allow users to conduct comparative analyses. HiPPO identifies homogeneous cell populations in a heterogeneous mixture by linking to a purpose-built manually curated Population Analysis Database (PANDA) of protein expression profiles for selected markers of primary cells. For each experiment, the expression distribution curves for each marker are discretized and the multidimensional expression profile for single cells is transformed into a bi-dimensional structure. Cell clusters that are statistically different between differing experimental conditions are identified by applying the Kolmogorov–Smirnov nonparametric test (KS-test) (Massey, 1951) to evaluate the variation of protein expression levels for any identified population.
2. Methods
2.1. HiPPO workflow
HiPPO implements a four-stage approach to identify and characterize homogeneous subpopulations in a heterogeneous mixture. It also evaluates changes for selected markers, among multiple experimental conditions (Fig. 1).

Conceptual overview of HiPPO. Starting from mass cytometry data, intensity curves are globally normalized between 0 and 1 and binned. Discretized expression profiles are then compared with the annotated profiles in PANDA, and events are assigned to known and unknown populations. When multiple samples are provided, HiPPO evaluates changes in protein expression among different experimental conditions. The mass cytometry scheme in the figure has been taken from Bendall et al. (2012). HiPPO, High-throughput Population Profiler; PANDA, Population Analysis Database.
2.1.1. Normalization
To adjust for signal variations (shift in functionality range) through different markers in the same sample, we perform a global scaling on the expression values, to range between 0 and 1 as:
2.1.2. Binning
The binning process aims at reducing the complexity of the data, minimizing the loss of information. To discretize the continuous data, the Freedman-Diaconis (FD) rule (Freedman and Diaconis, 1981) was applied to calculate the optimal number of bins:
where: IQR = interquartile range for the distribution curve of feature x; n = number of elements that compose the distribution curve.
To compute the number of bins that best fit the majority of mass cytometry experiments, we applied the FD rule to 46 mass cytometry experiments extracted from the Gene Expression Omnibus (Clough and Barrett, 2016), comprising a total of 1480 markers. From this, the optimal Nbins was 90. To elucidate whether the experimental technique could generate any bias, we repeated the procedure of FD calculation on 1,480,000 (103 × ) random density distributions (Supplementary Fig. S1).
2.1.3. Categorization
Discretized profiles are compared with manually curated entries in PANDA to identify well-described cell populations inside the sample. This step differentiates between clear-cut and ambiguous situations. In clear-cut scenarios, the profiles identified by HiPPO comprise a perfect overlap to those described in PANDA. In an ambiguous condition, HiPPO provides the user with a list of putative identified cell populations within the sample. Clusters of events that do not overlap with any of the curated cells in the database are assigned to an “unknown population” category and split further based on their expression profile.
2.1.4. Comparative analysis
HiPPO evaluates changes in expression of selected markers across multiple experimental conditions. Intensity distribution curves for the same marker in different samples can differ in terms of shape, number of peaks, height, and degree. It has been shown that gene and protein expression data are generally not normally distributed (Shokirov, 2013). As such, to compare the cumulative relative frequency distributions of two markers, HiPPO applies the nonparametric Kolmogorov
where: n = number of events composing the markers distribution curve; F(xi) is related to the cumulative frequency distribution.
2.2. Annotation of cell expression profiles in PANDA
PANDA is a manual-curated database that annotates primary cells with their characteristic marker protein expression values. Every feature links to the literature and reports the experimental evidence that supports the curated element. Although other manually curated resources of cell markers for single cells are already available (Cook et al., 2019; Franzén et al., 2019; Zhang et al., 2019), PANDA is a resource tailored to link seamlessly with HiPPO. Moreover, the curation procedure is conducted by experts in flow-cytometry and mass-cytometry analyses.
Currently, PANDA annotates 79 different cell types involved in the immune response and in muscle regeneration in Homo sapiens, Mus musculus, Rattus norvegicus, and Gallus gallus. This information covers more than 300 different markers curated from 180 publications.
2.2.1. Data selection
Manuscripts reporting the characterization of intracellular and surface expression profiles of well-defined cells are selected from PubMed (Canese and Weis, 2013) for manual evaluation. Expression values, flow cytometry scatterplots, and other types of experimental evidence are critically reviewed for the annotation of marker profiles. The curator capture details about the cell types, the tissue, and organism. Next, a dynamic table is filled with the Uniprot identifiers of the markers, their expression, and a list of PubMed IDs (PMIDs) that support the captured entry.
2.2.2. Ontology
PANDA aims at capturing expression profiles of selected markers in primary cells by integrating multiple layers of information. As such, a well-defined, accepted, standard is not yet available. We define mapping standards as follows: protein names to the Uniprot database (The UniProt Consortium, 2017), primary cell names to Cell Line Ontology (Sarntivijai et al., 2014), tissues and organs to BRENDA (Scheer et al., 2010), and species to NCBI taxid (Federhen, 2011). Where specific cell names are absent, they are added manually by curators along with associated information (description, hierarchy, and external references).
Cells that are in a particular state (i.e., quiescent, activated, proliferating) or that belong to several tissues or organisms are represented as distinct entities because of differences in expression levels for specific markers. Proteins are reported as UniProt Accession IDs. The last portion contains curated PMID. Data can be viewed through the website or downloaded as a comma-separated (CSV) file.
2.2.3. Curation
The data curation process is based on the manual retrieval and interpretation of expression data from the literature and focuses on capturing relationships between primary cells and the expression profiles of their markers. It starts with the selection of manuscripts reporting molecular characterization, mainly by flow cytometry experiments, of intracellular and surface proteins of functionally characterized and (relatively) homogeneous cell populations. The second phase is the actual “data interpretation”: Sentences, expression values, flow cytometry, scatterplots, and other types of information are critically reviewed, and marker profiles are categorized.
To this aim, a list of guidelines has been prepared to simplify the procedure:
High/very high levels when the protein has been reported to be used as a lineage marker or it has a key role in cellular function; Low/null when the absence of protein is strictly associated to a determined cellular phenotype.
When scatterplots or other quantitative data are available, the standard procedure to interpret flow-cytometry data is applied (Herzenberg et al., 2006).
3. Results
3.1. HiPPO characterizes activated satellite cells in healthy and dystrophic mice
Here, we present the ability of HiPPO to comprehensively characterize satellite cells (SCs) in skeletal muscle and detect variations in expression of Stat3, involved in their activation and lineage progression.
We generated a mass cytometry data set of skeletal muscle mononuclear populations from hind limb muscle from healthy and age-matched dystrophic (mdx) mice (Supplementary Data). A phenotyping panel of 15 metal-tagged cell surface antibodies and 8 metal-tagged antibodies against intracellular and signaling antigens was used (Supplementary Table S1). Single-cell measurements of three individual samples for each condition were obtained.
3.1.1. Identification of known cell population in muscle
The hierarchical circle tree produced by HiPPO (Fig. 2A) captures the cell heterogeneity of the muscle tissue. Moreover, using PANDA, HiPPO efficiently identifies most known resident cells (Table 1). In agreement with previous studies (Spada et al., 2016) and the physiology of the skeletal muscle regeneration (Yin et al., 2013; Dumont et al., 2015), the percentage of macrophages and SCs increases between healthy and dystrophic conditions (Fig. 2B). Fibro-adipogenic progenitors (FAPs) do not show a significant increase, which may be associated with the early progression state in the mdx mice. FAPs have a role in the muscle regeneration process after injuries but they can also contribute to the fibrotic degeneration of skeletal muscle, in pathological conditions (Joe et al., 2010; Judson et al., 2017). In terms of abundance, they reach the highest peak in 4 days after the injury and return to baseline levels after 7–9 days whereas in pathological conditions this process is longer (Bentzinger et al., 2013).
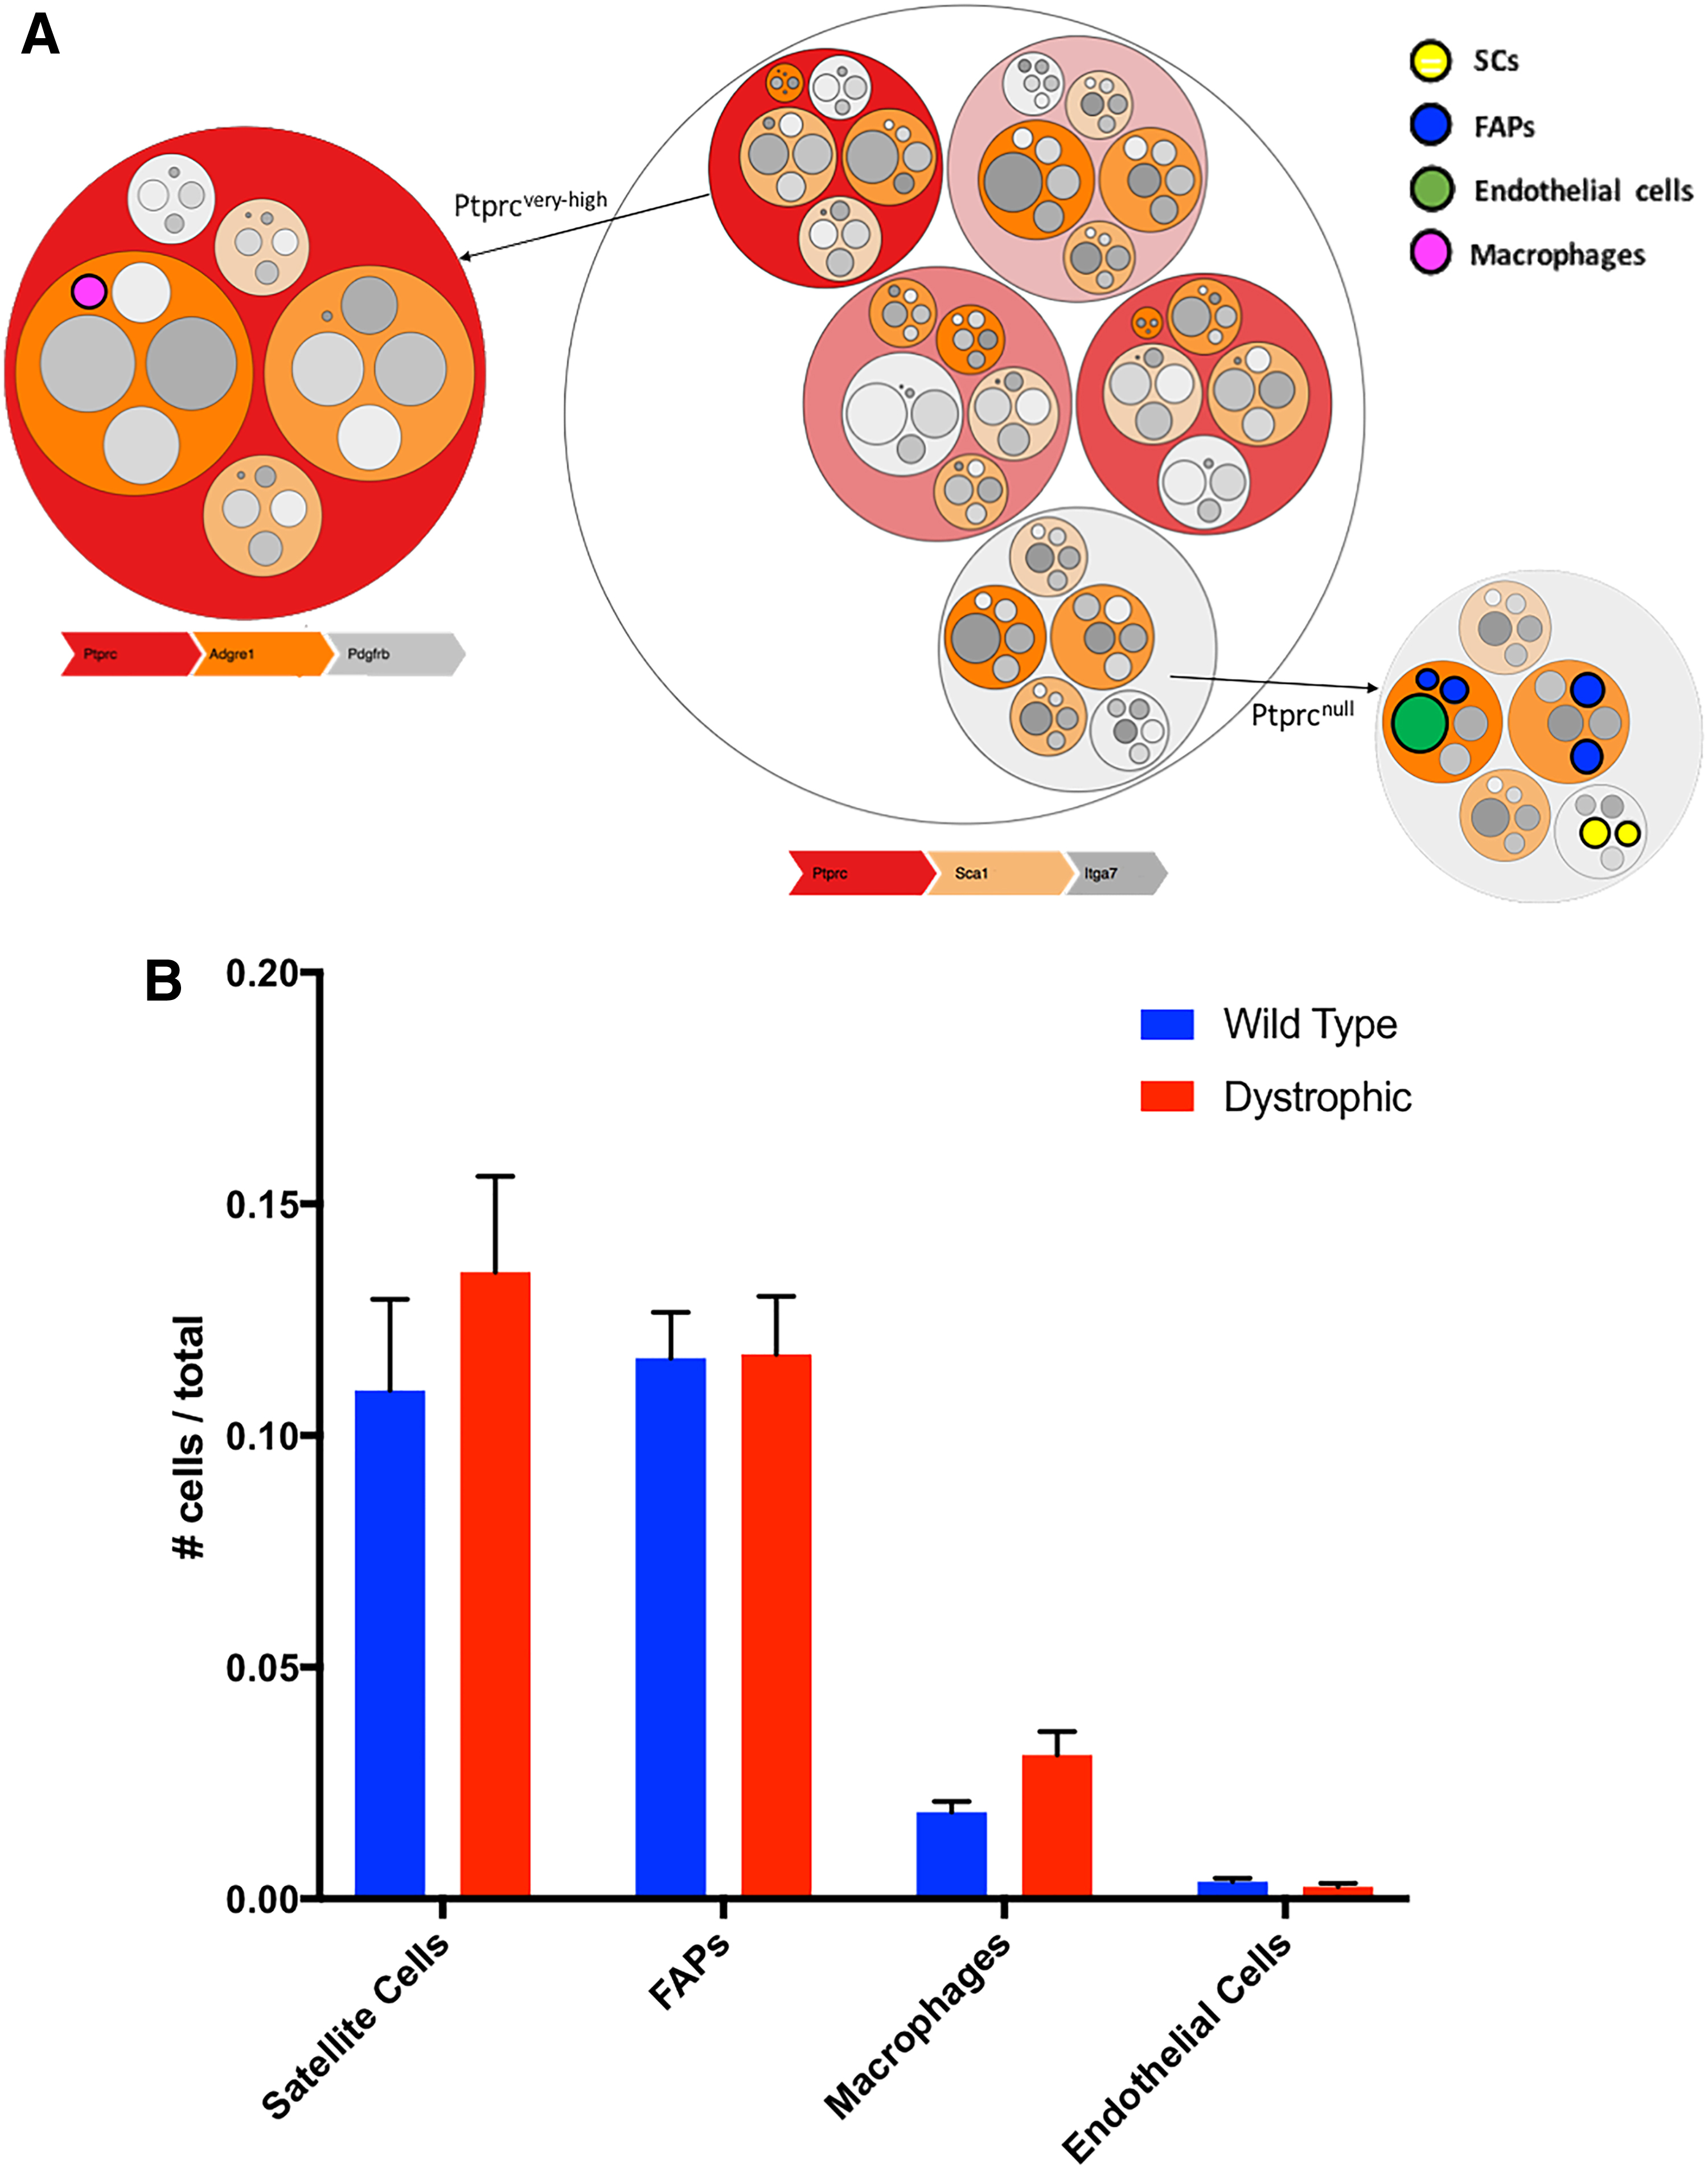
Identification of mononuclear cell populations in the muscle.
Expression Profiles for Cells Resident in the Skeletal Muscle
The signs represent the presence (+) or absence (
EC, endothelial cells; FAP, fibro-adipogenic progenitors; M, macrophages; SC, satellite cells.
3.1.2. Detection of expansion stimuli in SCs
Unlike other widely used tools, HiPPO allows users to infer whether the expression of selected markers in one experimental group is statistically different from those of another group by implementing a signed KS-test. HiPPO's KS-test was applied to detect changes in Stat3 and Stat1 expression, both of which are correlated to the expansion of SCs after injury (Tierney et al., 2014). HiPPO shows high capability in detecting these alterations (Fig. 3), despite the low amount of detectable proteins and insignificant variations being generated.

Analysis of Stat1 and Stat3 levels in satellite cells in healthy and dystrophic mice. The results are presented as a combination of a bar plot and a violin plot. The bars of the plot are positive when the level of a marker increases from the one condition to another. This evaluation is performed by comparing the markers' distribution median values (violin plot). The length of the bar is proportional to the distance between markers' distributions. A statistical significance is calculated by multiple tests on randomly generated distributions.
3.1.3. Detection of rare populations
The regeneration of skeletal muscle requires a complex interplay between SCs and other interstitial cells whose activity is regulated by the inflammatory environment of the damaged tissue. In dystrophic conditions, muscles are subjected to continuous damage due to their structural instability. In this context, the regenerative response is replaced by the infiltration of fibrotic and fat tissues. The involvement of Cd34 in muscle regeneration in acute or chronic muscle injuries has a key role in modulating stem cell activity (Alfaro et al., 2011). FAPs cells in dystrophic conditions express higher levels of Cd34, contributing to fat cell formation and accumulation in skeletal muscle (Arrighi et al., 2015). For this reason, their characterization assumes a fundamental role in understanding this chronic, degenerative pathology.
HiPPO was able to detect and quantify the population of FAPs in healthy and mdx mice (Fig. 4). We compared our findings with results from manual gating, viSNE, and SPADE. The methods agreed that the total number of FAPs was not affected between healthy and pathological conditions. All methods were able to detect an increase in Cd34+ FAPs in dystrophic conditions relative to their healthy counterparts (Fig. 4A) and this is further confirmed by the KS-test implemented by HiPPO (Fig. 4B).
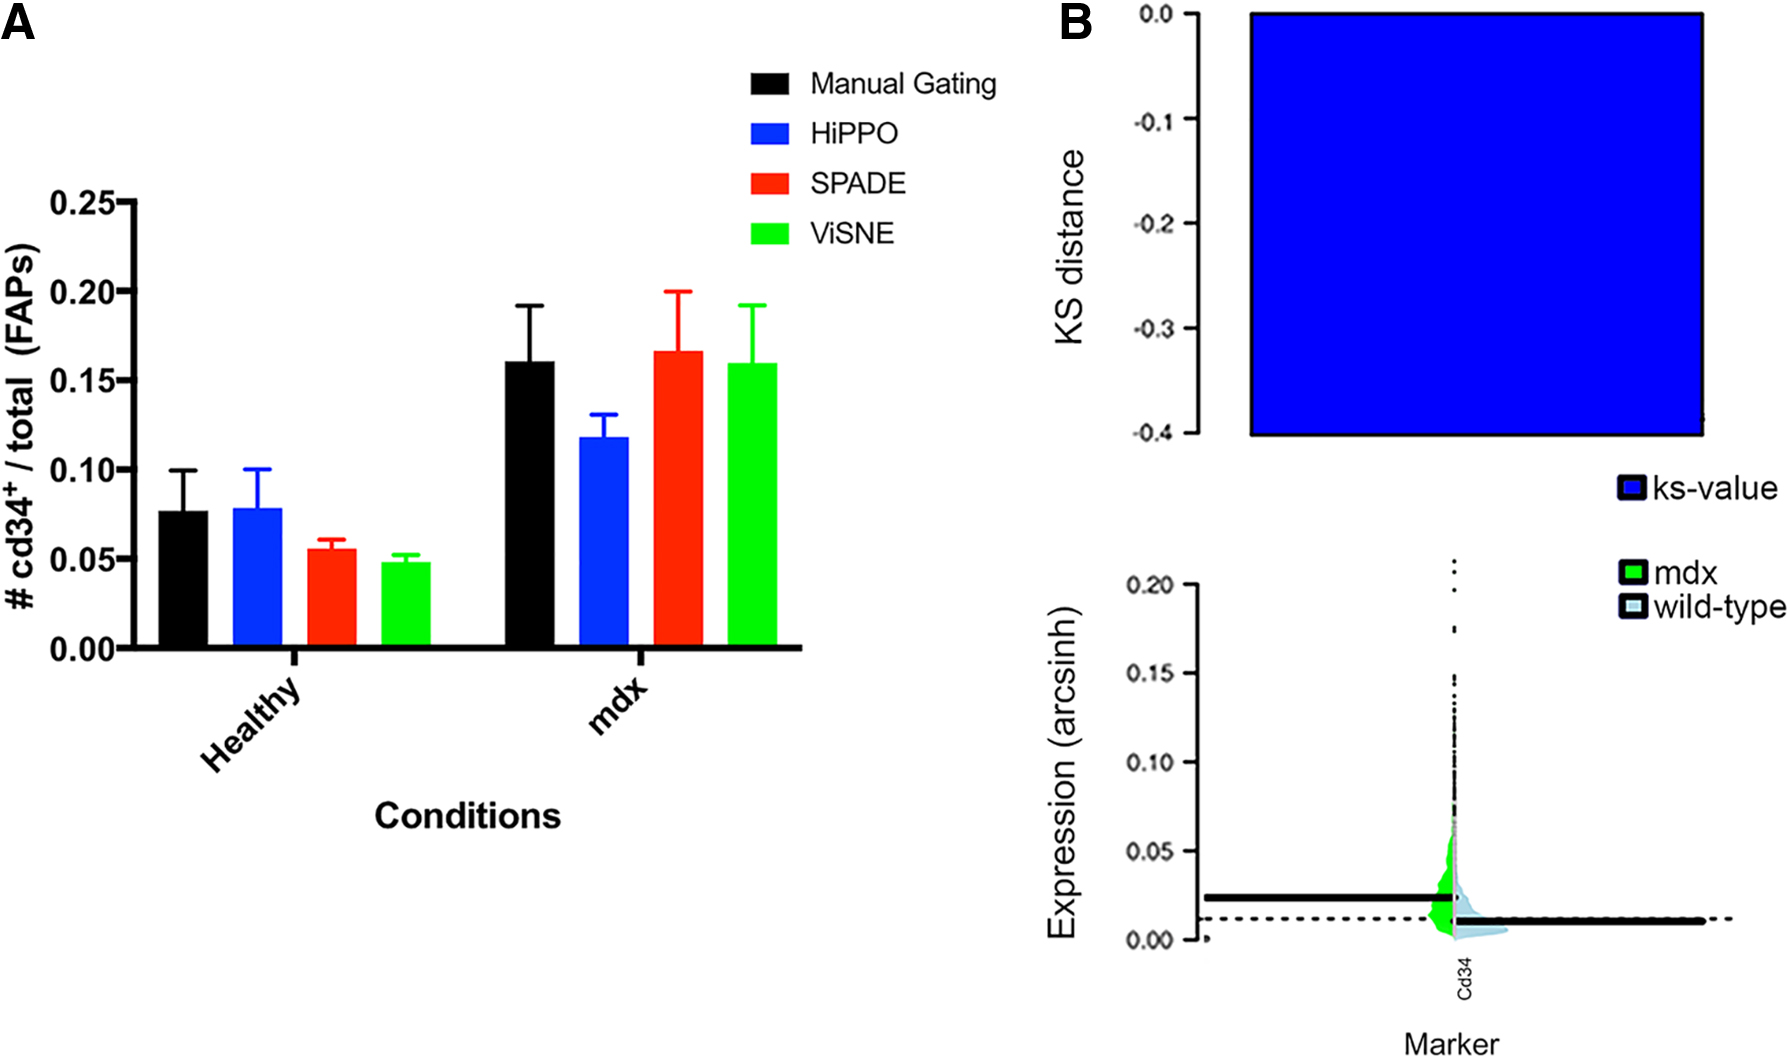
Analysis of Cd34+ FAPs in healthy and dystrophic conditions.
3.2. Comparison with other leading tools
3.2.1. Computational burden
The computational speed of HiPPO, relative to SPADE and viSNE, was tested by using a synthetic dataset. These ad hoc mass cytometry files were generated artificially on an increasing number of events (1, 2, 3, 3.5, 7 × 10⁵). Time of execution for scaling and binning processes was recorded. For the range of events tested, HiPPO shows a linear grade of complexity, whereas viSNE is quadratic in the number of data points (Hinton, 2008). As such, HiPPO was consistently faster than SPADE and viSNE in this test (Fig. 5).
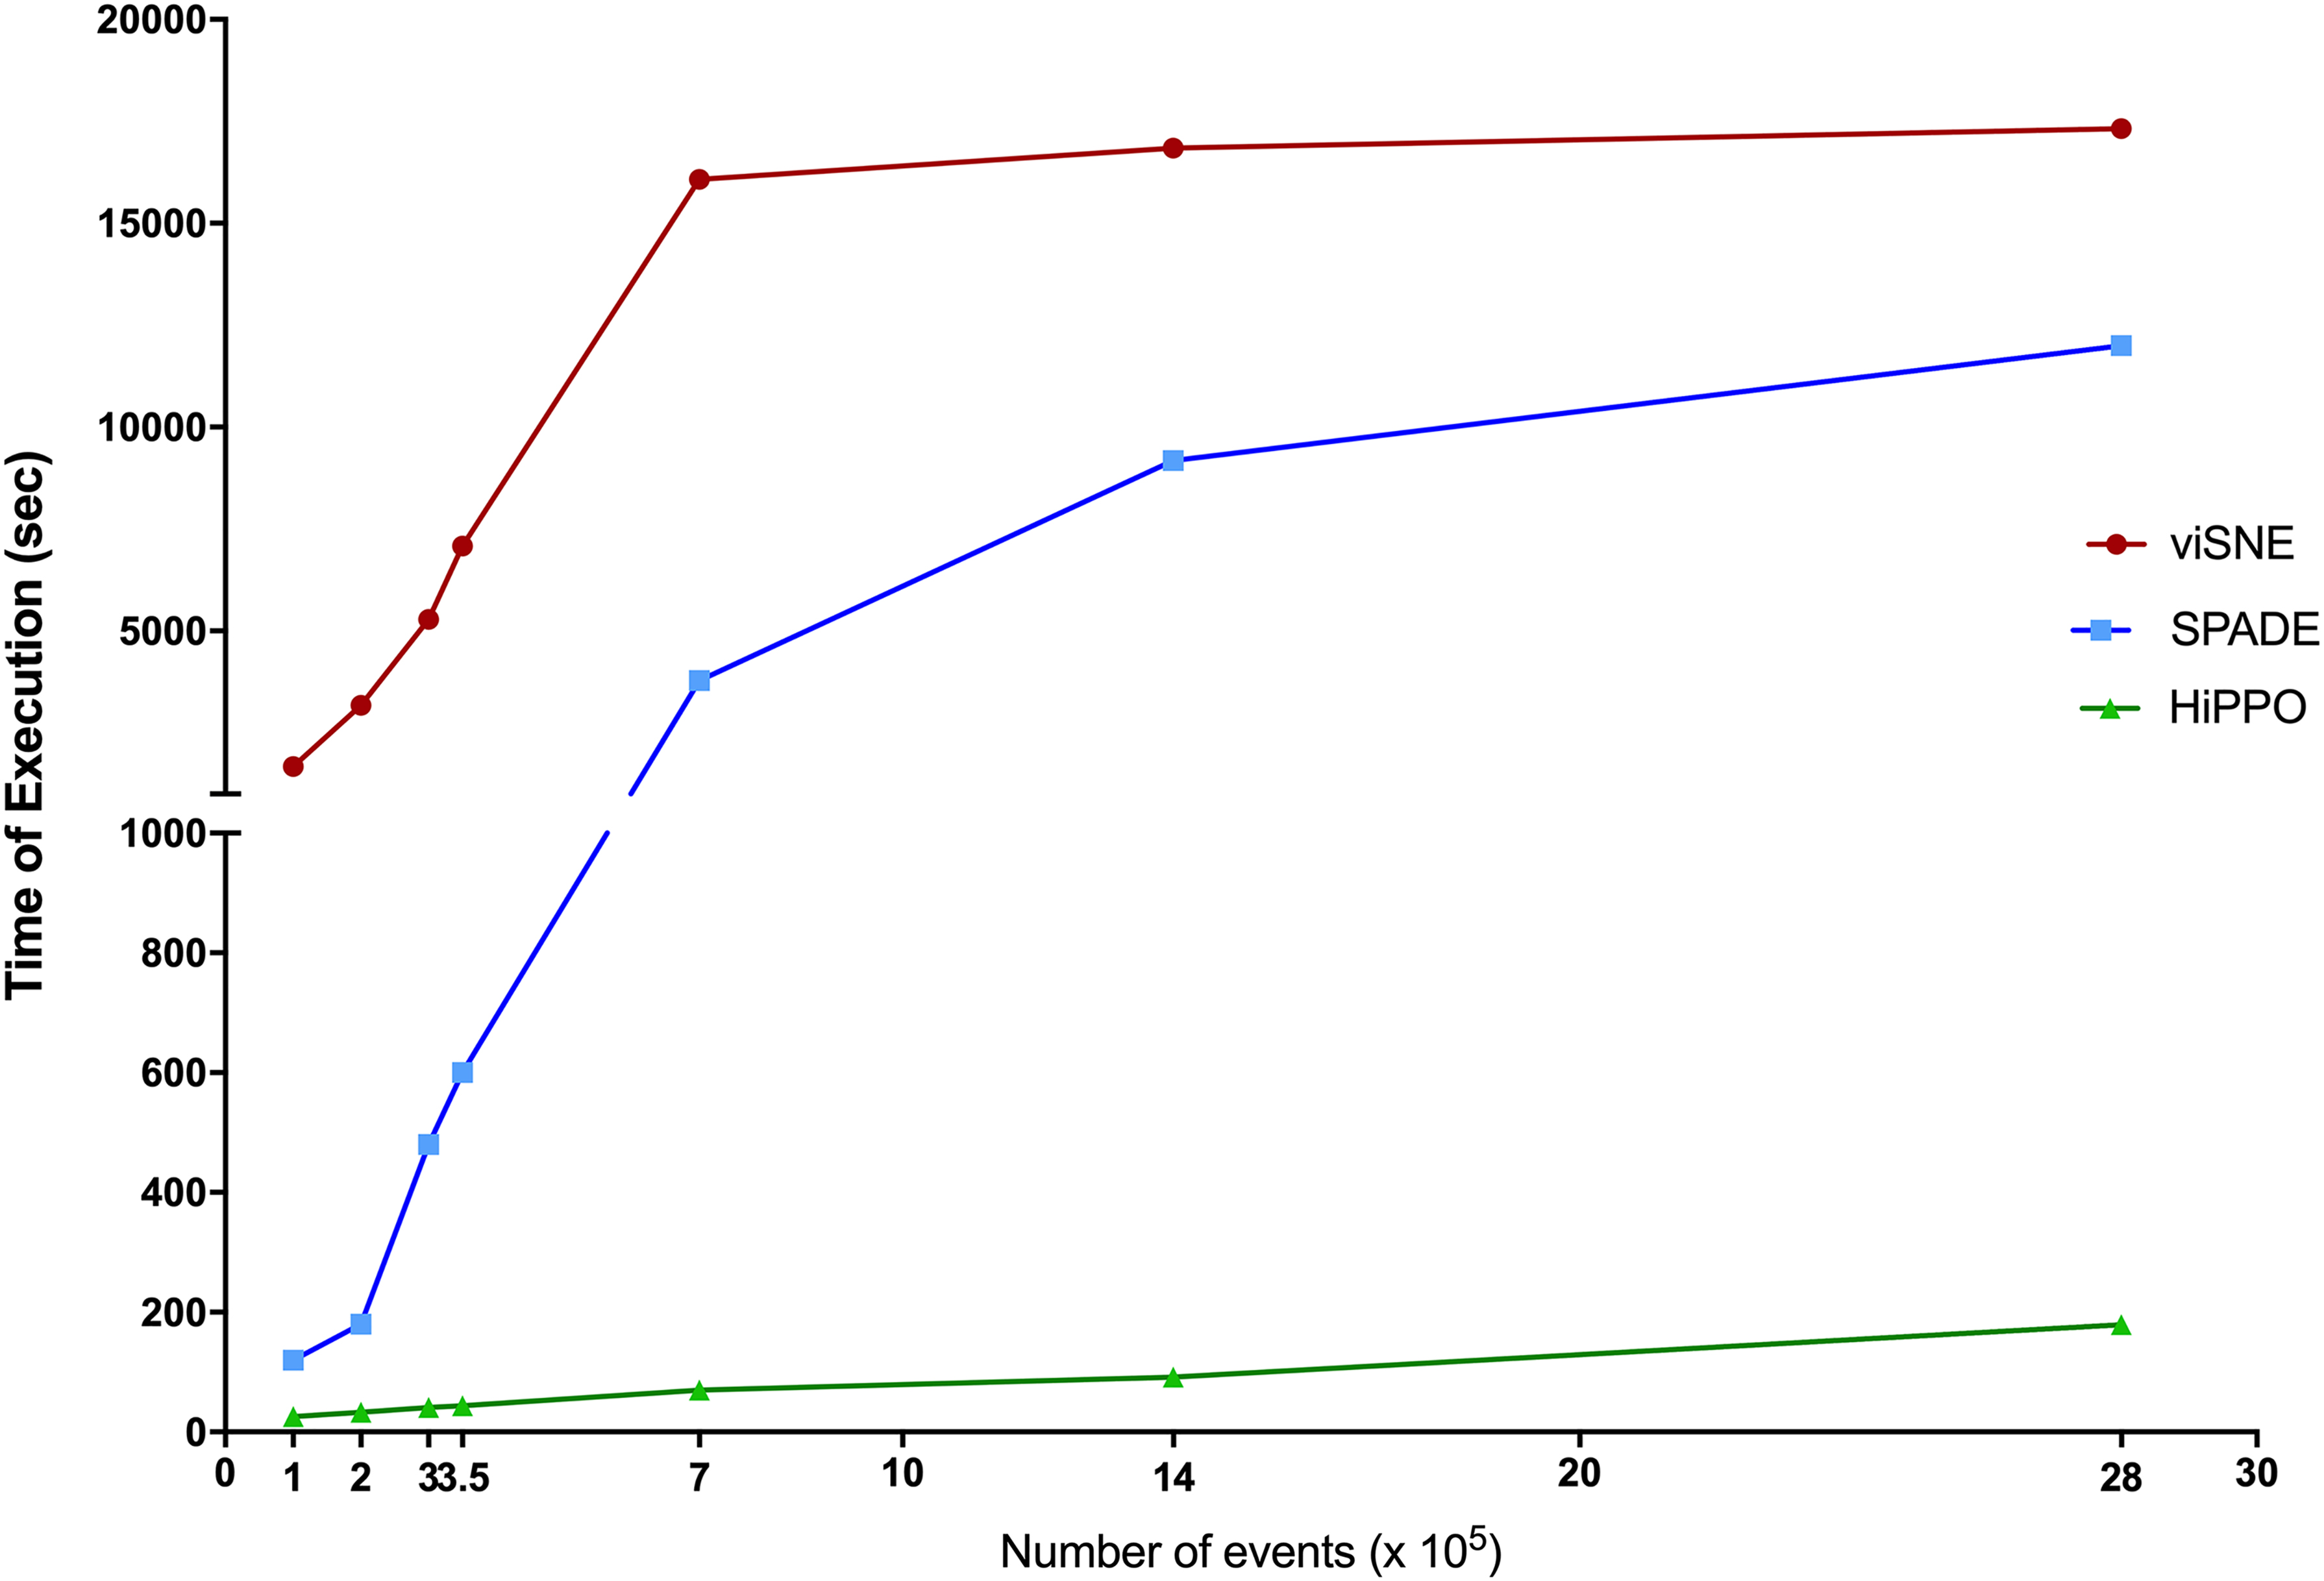
The computational speed of HiPPO is higher than its counterparts. HiPPO is able to analyze artificially generated mass cytometry files comprising 700,000 events in less than 1.5 minutes. Overall, HiPPO performs ∼50 × faster than SPADE and 150 × faster than viSNE in the visualization and clustering phases.
3.2.2 Reconstruction of cell populations within healthy bone marrow
HiPPO, SPADE, and viSNE were compared for their ability to identify a set of immune cells in healthy bone marrow samples, based on comparisons to the manual gating results reported in the literature (Qiu et al., 2011) (Table 2 and Fig. 6). The significance on differences among methods cannot be calculated because biological replicates were not provided by authors, but it seems that the simplicity of the approach implemented by HiPPO does not compromise its ability to quantify known populations.
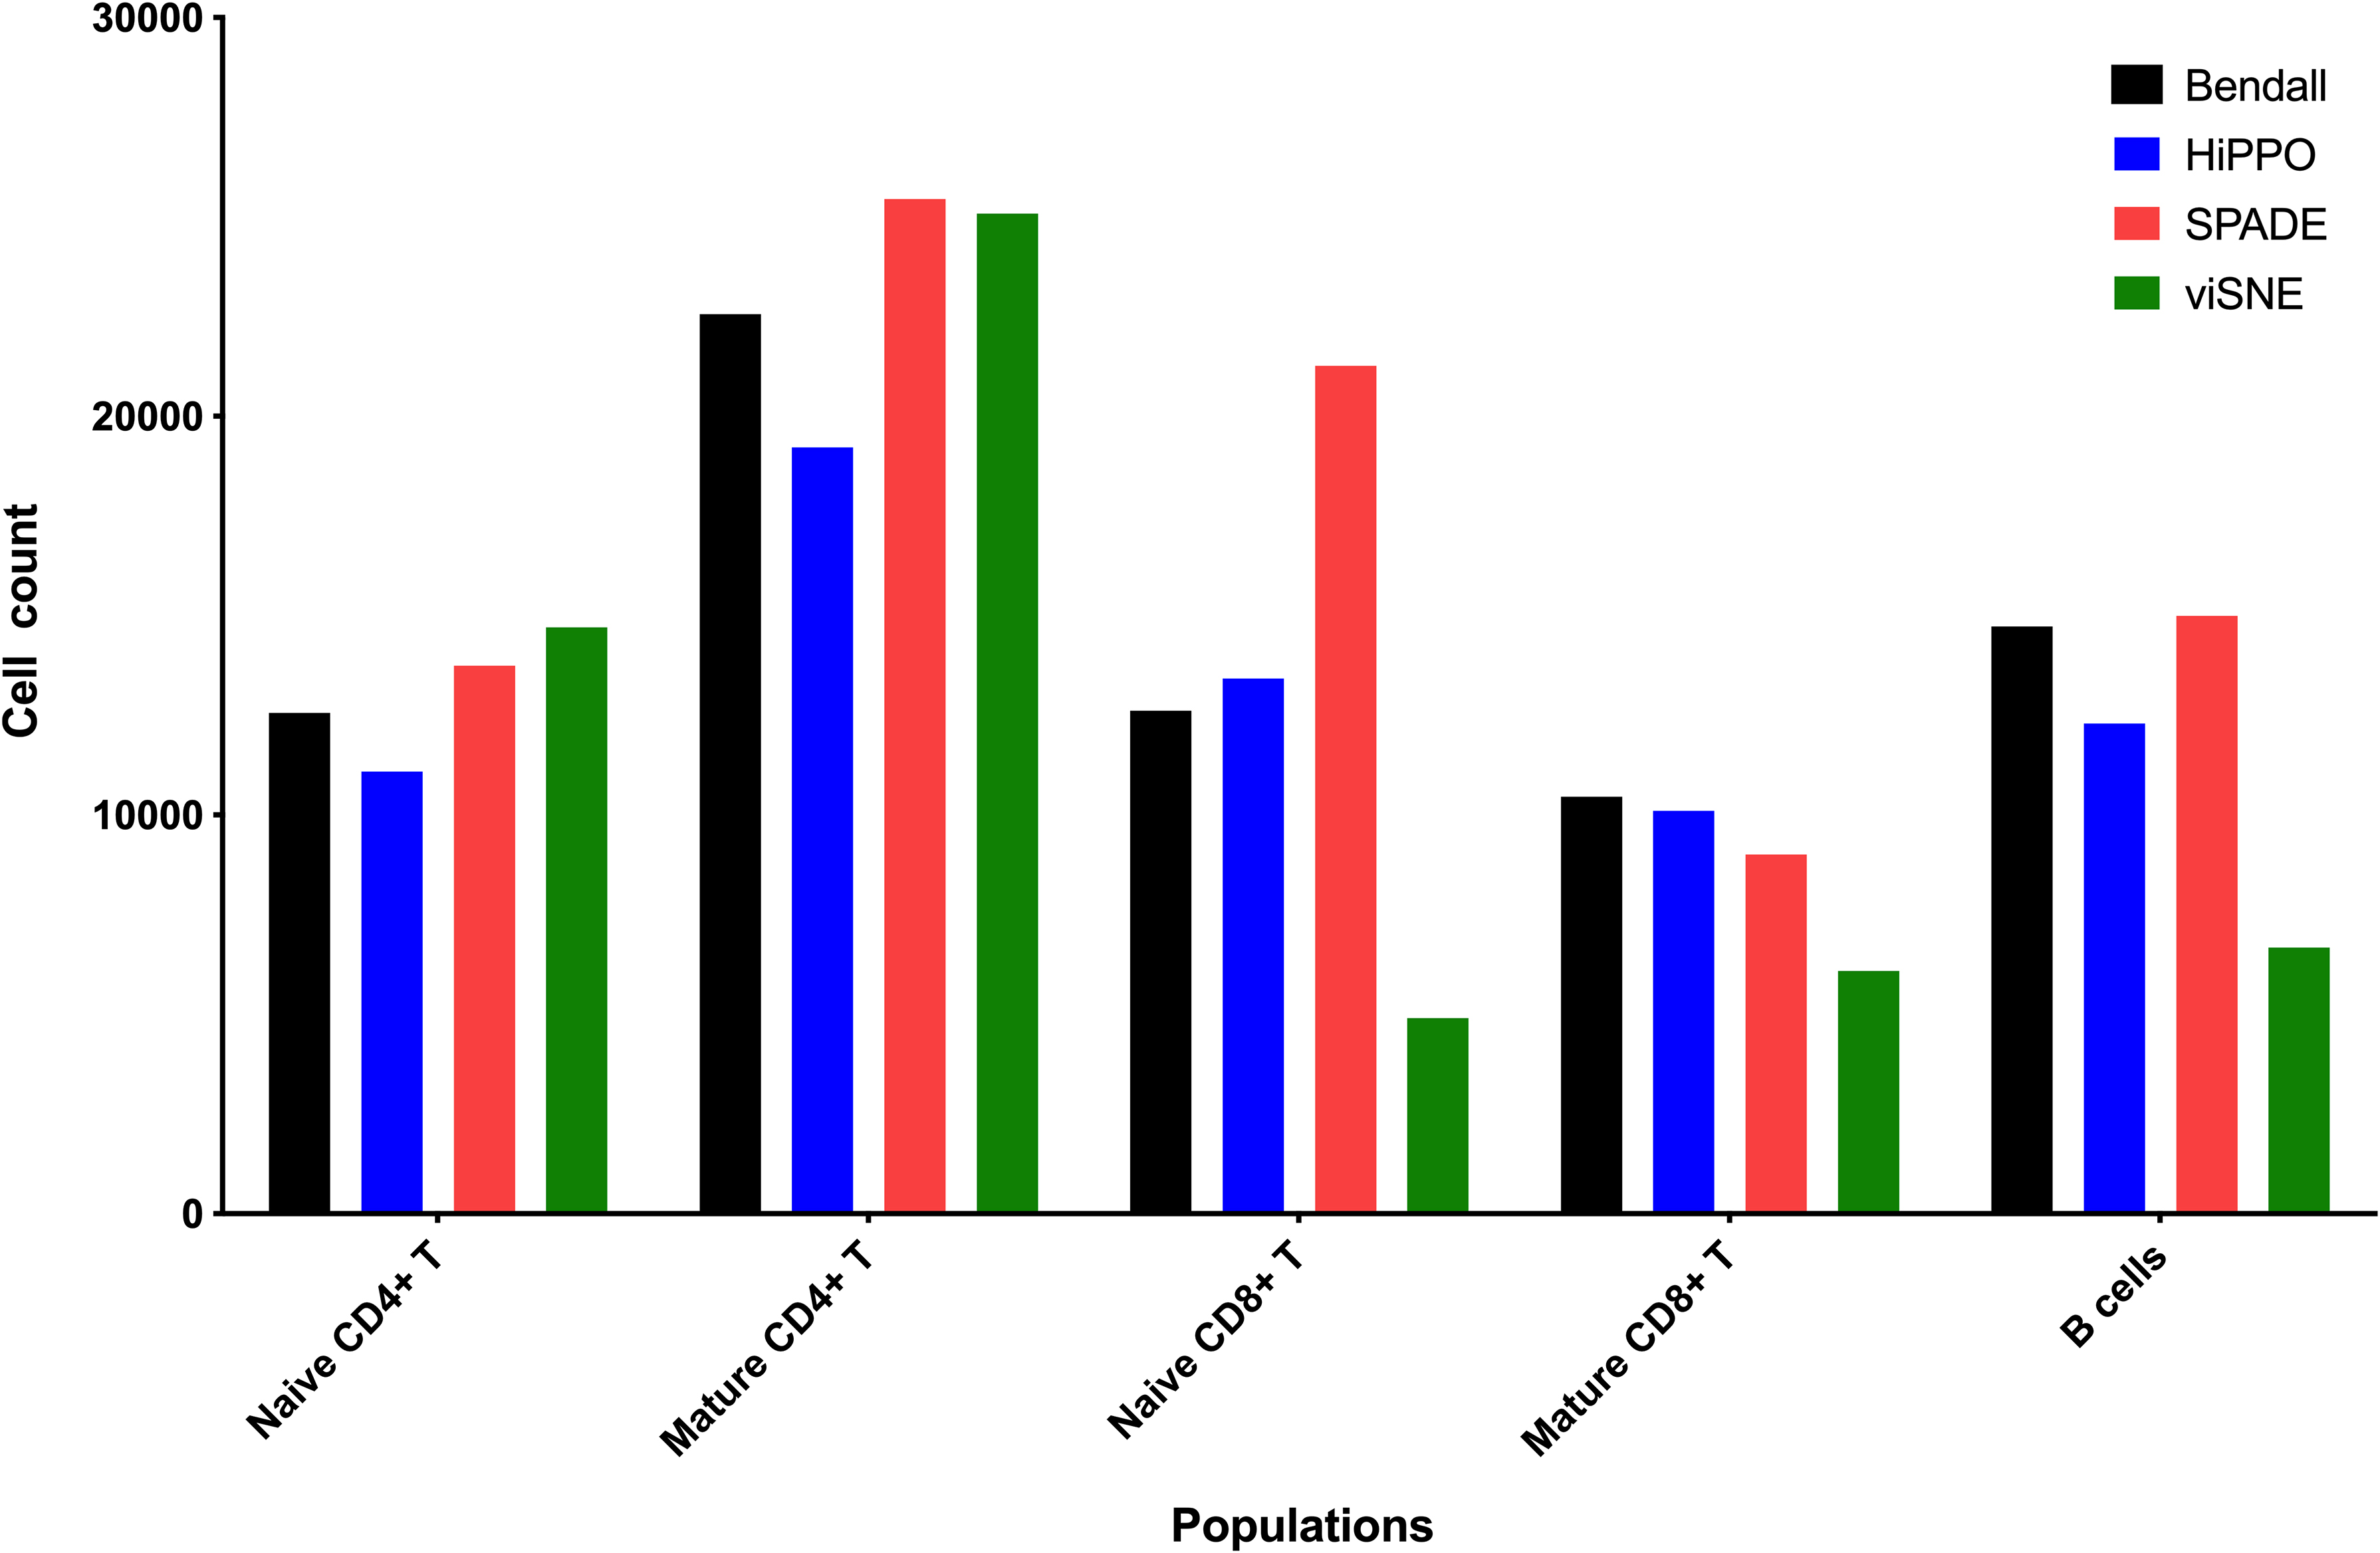
Reconstruction of the hematopoietic landscape. HiPPO has been used on mass cytometry data of human hematopoietic cells (Bendall et al., 2012).
Expression Profiles for Selected Markers in T and B Cells of Healthy, Human Bone Marrow (Bendall et al., 2012)
The signs indicate presence (+) or absence (−) of a marker in the cell selected.
4. Discussion
HiPPO enables a parameter-free, reliable, and fast analysis of high-content multiparametric data. It supports the analysis of data generated by CyTOF experiments, providing information about putative cell populations within samples, expression profiles, abundance of unknown cells, and changes in protein expression levels across different experimental conditions.
HiPPO allows researchers to visualize single-cell results in a user-friendly manner while still capturing the underlying cellular landscape. This allows for the exploration of biologically meaningful insights.
The effectiveness of HiPPO in characterizing known cells is dependent on the curation of PANDA. It represents the first systematic effort to capture relationships between primary cells and the expression profiles of their markers. PANDA has a good coverage of cells belonging to muscular and immune systems, integrating and connecting multilevel data. We aim at increasing the amount of manually curated data, to include additional tissues, organs, and organisms. PANDA is an open-source project. We support sharing science and we believe the scientific community can contribute in PANDA's growth. For this reason, we opened a GitHub channel (https://github.com/wynstep/PANDA) where researchers can report curation errors, make suggestions, or share their previous knowledge.
User guides are available online for both HiPPO and PANDA from their respective homepages. The HiPPO team is also available to answer any additional queries at help@hippopanda.org. HiPPO is freely available and has been tested by using Google Chrome, Mozilla Firefox, and Safari using Mac, Windows, and Linux OS.
Footnotes
References
Supplementary Material
Please find the following supplemental material available below.
For Open Access articles published under a Creative Commons License, all supplemental material carries the same license as the article it is associated with.
For non-Open Access articles published, all supplemental material carries a non-exclusive license, and permission requests for re-use of supplemental material or any part of supplemental material shall be sent directly to the copyright owner as specified in the copyright notice associated with the article.