
Abstract
Melanoma is an extremely malignant and occult tumor. To identify candidate genes related to melanoma carcinogenesis and progression, the microarray data sets GSE83583, GSE130244, and GSE31879 were retrieved from the Gene Expression Omnibus (GEO) database using the GEO2R analytical tool provided by the National Center for Biotechnology Information (NCBI). Gene expression analysis was carried out using the DAVID database for Gene Ontology and Kyoto Encyclopedia of Genes and Genomes functional enrichment analyses of differentially expressed genes. A protein–protein interaction network was constructed with the STRING database, the interaction data were imported into Cytoscape software, and the network topology was analyzed to identify key genes. Hub gene expression was verified in the Gene Expression Profiling Interactive Analysis and Human Protein Atlas databases. In addition, Kaplan–Meier survival analysis was performed on hub genes. A total of 142 differentially expressed genes were identified in melanoma tissues, including 50 upregulated genes and 92 downregulated genes. Five central genes (CCNA2, EBP, GABBR2, TRIM32, and ADAM10) were found based on the degree of the nodes. These genes are mainly enriched in protein serine/threonine kinase activity and apoptosis pathways. Survival analysis showed CCNA2 to be related to the overall survival (OS) of patients, and increased expression of TRIM32 led to increased OS and disease-free survival risk. Bioinformatics methods can be used to effectively select key genes in melanoma, and CCNA2 and TRIM32 may be new targets for treatment of this disease.
1. Introduction
Malignant melanoma is uncommon worldwide, accounting for only ∼1% of all malignant tumors. However, it has the fastest growth rate among all malignant tumors, 3%–7% annually. Overall, malignant melanoma is an insidious disease with a high degree of malignancy. Surgery, radiotherapy, and chemotherapy have long been the main methods for the treatment of malignant melanoma. However, because malignant melanoma exhibits poor sensitivity to adjuvant chemotherapy, the clinical prognosis is poor, and the mortality rate is high. In recent years, it has been found that malignant melanoma is a type of cancer with high immunogenicity. Many research strategies, such as cellular immunotherapy and cytokine and monoclonal antibody therapies, have been applied in the treatment of malignant melanoma. Studying the pathogenesis of melanoma, with the constant discovery of new targets, is still a hot research topic in medicine (Abbas et al., 2014; Chattopadhyay et al., 2016; Wong et al., 2017; Cabrera and Recule, 2018; Kastelan et al., 2018).
The development of high-throughput gene chip and sequencing technology has enabled rapid analysis of the gene expression profile of melanoma, revealing the expression levels of genes related to melanoma and changes in key genes. With the help of gene chip research, bioinformatics allows for elucidating valuable information from complex data through sequence alignment, statistical analysis, visualization mapping, biological clustering, and biomolecular network and pathway analyses. Furthermore, bioinformatics data mining provides a means of comprehensively and systematically studying diseases.
Using ONCOMINE and Gene Expression Omnibus (GEO) databases, Ci et al. (2019) verified that CDCA8 mRNA expression and CDCA8 in cutaneous melanoma tissues are potential therapeutic targets. In the study of Wei (2018) three gene expression data sets were downloaded from the GEO and The Cancer Genome Atlas (TCGA) databases, and 110 characteristic genes were found through meta-analysis to be significantly overexpressed in metastatic melanoma. Wei et al. (2019) selected GSE3189 and GSE31879 profiles and suggested that MFSD12 and SLC45A2 affected the overall survival (OS) and disease-free survival (DFS) of melanoma patients. At present, there are >30,000 microarray data sets for human cutaneous melanoma in the GEO database, although there are few articles about utilizing gene chips from GEO to screen biomarkers that affect the prognosis of melanoma. Through computational biology technology, reanalyzing and integrating the data available in these public databases may provide new clues for understanding cancer.
The expression profiles of the GSE130244, GSE31879, and GSE83583 data sets were downloaded from the GEO database and reanalyzed, including 110 melanoma and 16 normal skin tissue samples. Differentially expressed genes (DEGs) were screened between melanoma and normal tissues. Venn diagrams were used to reveal genes differentially expressed in all three data sets, and possible hub genes affecting melanoma development were identified through a PPI (protein–protein interaction) network. Gene Ontology (GO) and Kyoto Encyclopedia of Genes and Genomes (KEGG) pathway enrichment analyses were performed to identify pathways that might affect the occurrence of melanoma, and Gene Expression Profiling Interactive Analysis (GEPIA) was applied to detect the expression levels of these hub genes and analyze their interactions. The protein expression of hub genes in melanoma tissue was assessed by immunohistochemistry, and survival analysis was performed to determine hub genes affecting OS and DFS of melanoma. This study constitutes a preliminary exploration through bioinformatics tools to screen out relevant functional genes in an effort to obtain more biological information about the molecular mechanisms involved in the development of melanoma (Chiriboga et al., 2016).
2. Materials and Methods
2.1. Differential gene expression screening
The GEO (www.ncbi.nlm.gov/geo/) database through the National Center for Biotechnology Information (NCBI) was used to retrieve data chips containing human melanoma samples and select a melanoma data chip for tumor cause information (Edgar et al., 2002). The gene expression data sets GSE130244 and GSE31879 were downloaded from GEO (Affymetrix GPL570 platform, Affymetrix Human Genome U133 Plus 2.0 Array). The GSE130244 data set contains gene expression array data for eight melanoma tissues and four normal tissues (Filipp et al., 2019). The GSE31879 data set contains 9 noncancerous tissues and 21 cancerous tissues. The GSE83583 gene expression data set was also downloaded from GEO (GPL10558 platform, Illumina HumanHT-12 V4.0 expression beadchip) and contains 81 cancerous samples and 3 noncancerous samples (Eskiocak et al., 2016).
Differential gene expression analysis was carried out with the GEO2R online tool (https://www.ncbi.nlm.nih.gov/geo/geo2r/), which compared the gene expression differences between melanoma tissue and normal tissue with the R language GEOquery package and the limma package. The result is a list of genes sorted by significance, and the probe name is converted to a standard gene name. The gene expression values between the melanoma samples and normal samples were compared, and those with an adjusted p-value (adj. p. Val) <0.05 and a fold change >2 were identified as significantly differentially expressed.
2.2. Gene functional enrichment and annotation
The DAVID 6.8 database (https://david.ncifcrf.gov/) is an online gene enrichment tool for gene annotation, visualization, and comprehensive exploration that provides a comprehensive set of functional gene and protein annotation information (Huang et al., 2007). The analyzed differentially expressed genes were introduced into the database, and the GO database was used to describe the biological functions of the differentially expressed genes, focusing on GO biological processes, molecular functions, and cellular components. The KEGG pathway database was used to identify the key signaling pathways of the differentially expressed genes. p < 0.05 was considered statistically significant (Ashburner et al., 2000; Kanehisa, 2002).
2.3. Interaction analysis of differentially expressed genes
A PPI network of the differentially expressed genes was constructed using STRING (http://string-db.org/) (version 10.5); the data were input in the multiple proteins mode, with all parameters using default values (Franceschini et al., 2013). The credibility was 0.40. The PPI network was visually analyzed using Cytoscape 3.6.1 software. Cytoscape's plug-in Molecular Complex Detection (MCODE) (version 1.4.2) is an app that is used to cluster a given network and find densely connected regions (Smoot et al., 2011; Bandettini et al., 2012). After the PPI network is drawn, MCODE is used to identify the most important modules in the PPI network. The selection criteria were as follows: MCODE score >5, node score cutoff = 0.2, degree cutoff = 2, k score = 2, and maximum depth = 100. KEGG and GO enrichment analyses were performed on the genes in this module.
2.4. Hub gene selection and analysis
Correlation analysis of protein interaction networks was performed using the CytoHubba plug-in and sorted according to node size (Gao et al., 2013). The selected hub genes have degrees ≥10. Cytoscape's Biological Networks Gene Ontology tool (version 3.0.3) plug-in was employed to perform biological process analysis and visualize the hub genes (Cerami et al., 2012). The selected hub genes were introduced into the cBioPortal online platform (www.cbioportal.org) for analysis of the hub gene network and their coexpressed genes. Expression of hub genes in melanoma and normal tissues and analysis of the correlation between the screened genes were carried out using the GEPIA online database (http://gepia.cancer-pku.cn) (Tang et al., 2017).
2.5. Immunohistochemical analysis
The protein expression of key differentially expressed genes in melanoma was assessed in the Human Protein Atlas database (www.proteinatlas.org). The difference in the protein expression of key genes in normal tissues and tumor tissues was compared based on the staining intensity of the protein in the tissue and the percentage of stained cells; representative immunostained images were obtained (Thul and Lindskog, 2018).
2.6. Prognostic value analysis
In the GEPIA database, correlation between hub genes and OS and DFS was analyzed based on univariate Cox regression analysis, and the hazards ratio was calculated. Based on TCGA database information, melanoma samples were divided into high and low expression groups of hub genes, and differences in OS and DFS between the two groups were analyzed using the Kaplan–Meier (KM) method. p < 0.05 was considered significant (Vasaikar et al., 2018).
3. Results
3.1. Identification of DEGs in melanoma
The process of screening hub genes is shown in Figure 1. After the standardization of 126 melanoma and normal tissue samples, 8352 differentially expressed genes were identified, of which 1701 were in GSE130244, 1503 in GSE31879, and 5148 in GSE83583, as illustrated by the Venn diagram in Figure 2a. A total of 142 genes were overlapping among the three data sets, of which 50 genes were upregulated and 92 genes downregulated between melanoma and normal tissues.
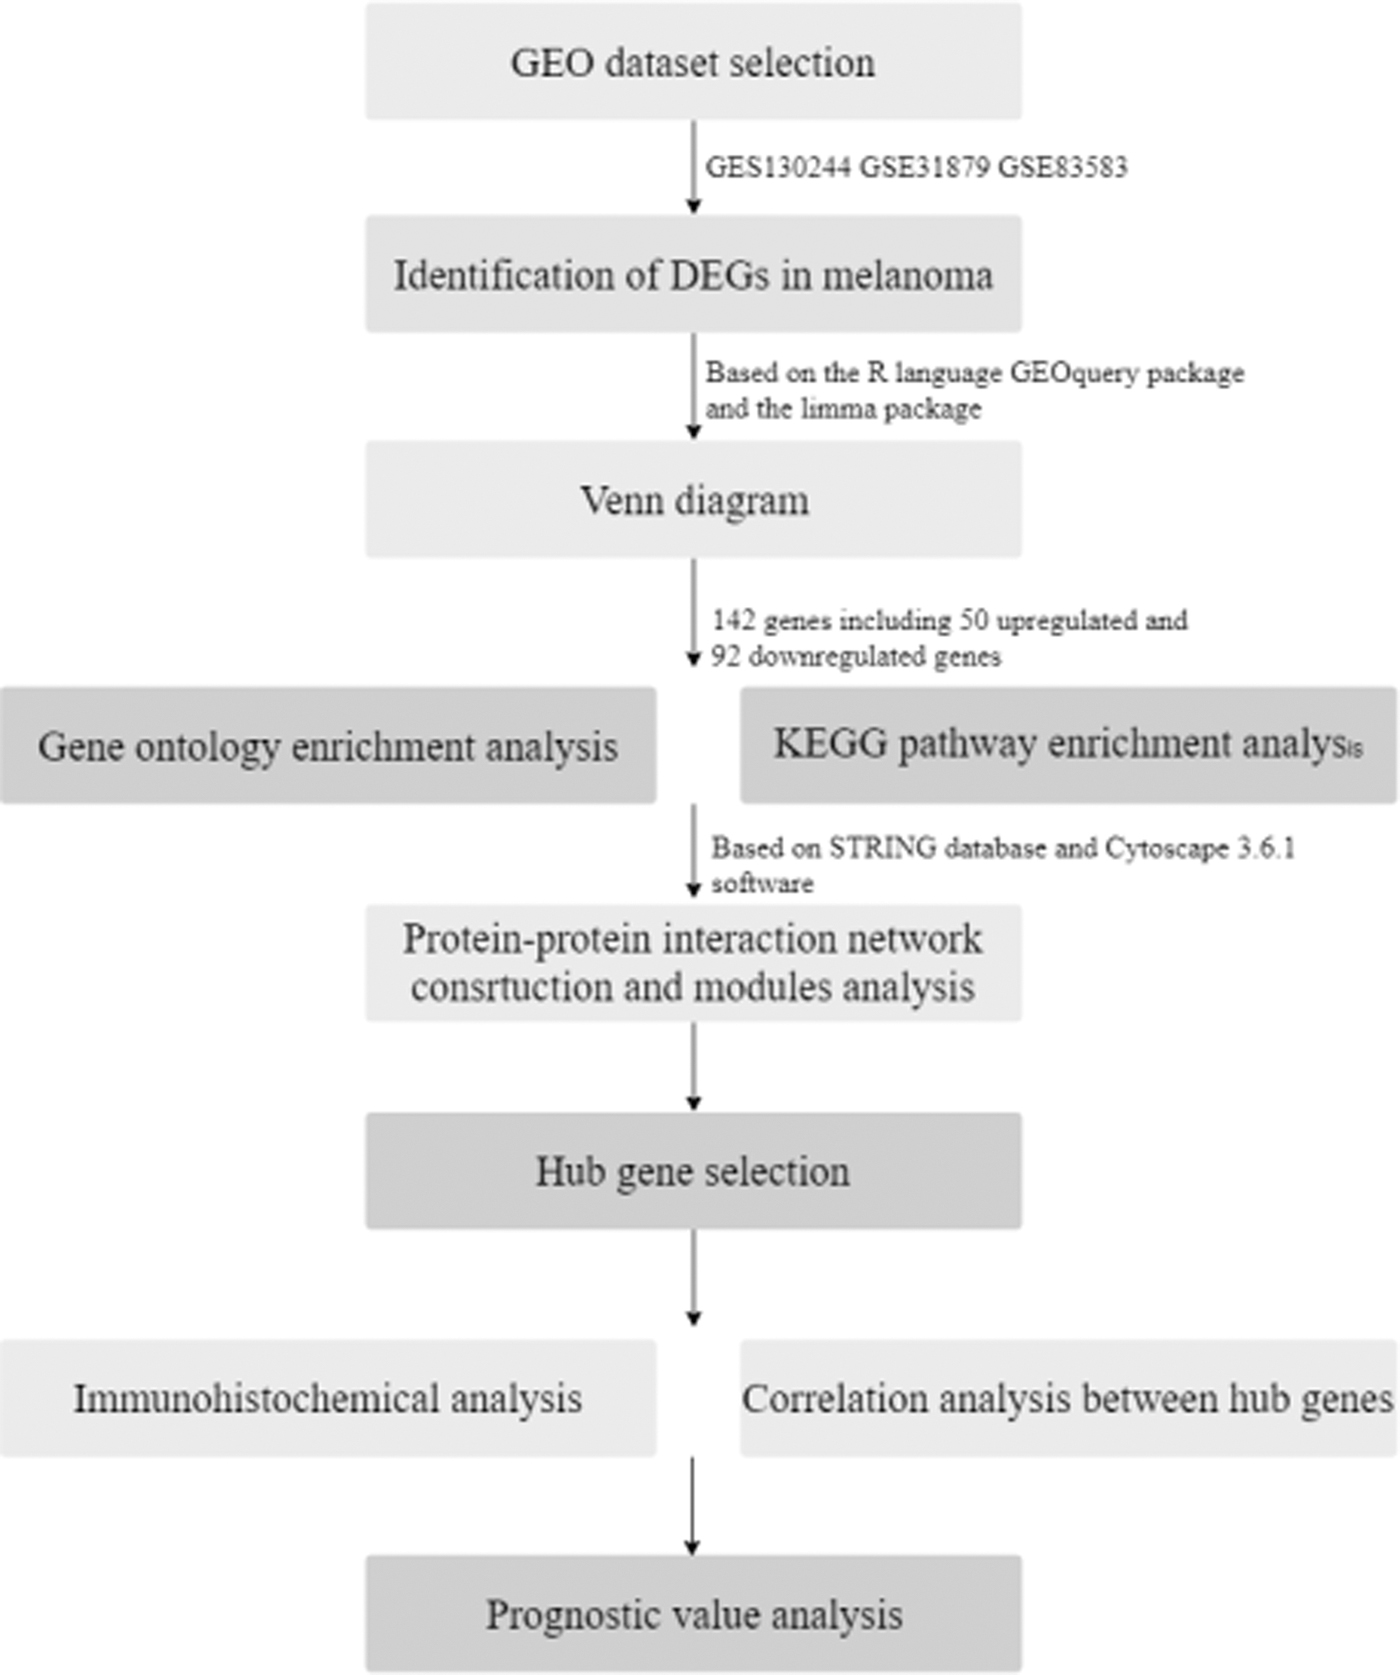
Flowchart for screening of the hub genes.

3.2. KEGG and GO enrichment analyses
The analysis of differential gene-related biological processes by GO enrichment revealed the upregulated genes to be mainly concentrated in nucleic acid binding, zinc ion binding, transition metal ion binding, heterocyclic compound binding, RNA binding, organic cyclic compound binding, poly(A) RNA binding, and DNA binding; the downregulated genes were mainly enriched in biological processes such as Rho guanyl-nucleotide exchange factor activity and small molecule binding. Further KEGG pathway analysis of the differentially expressed genes mainly revealed enrichment of the upregulated genes in the mitogen-activated protein kinase signaling pathway; the downregulated genes were mainly enriched in the chemokine signaling pathway, morphine addiction, estrogen signaling pathway, metabolic pathways, lysosome, and apoptosis, among others (Table 1).
GO and KEGG Pathway Enrichment Analysis of the DEGs
GO, Gene Ontology; KEGG, Kyoto Encyclopedia of Genes and Genomes; MAPK, mitogen-activated protein kinase; DEGs, differentially expressed genes.
3.3. PPI network construction and module analysis
A protein interaction network among differentially expressed genes was structured using the STRING 10.5 database (Fig. 2c). After removing the effect of free proteins, the most important module was obtained from the interactive network and contained five genes: AKT1, XIAP, CASP8, CCNA2, and ATM. Functional analysis of these genes showed that they were mainly enriched in protein-serine/threonine kinase activity, apoptosis, toxoplasmosis, HTLV-I infection, the nuclear factor-kappa B signaling pathway, and pathways in cancer (Table 2).
GO and KEGG Pathway Enrichment Analysis of the DEGs in the Most Significant Module
HTLV-1, human T-cell leukemia virus, type 1; NF, nuclear factor.
3.4. Hub gene selection and analysis
A total of five genes with a degree ≥10 were screened as hub genes, including CCNA2, EBP, GABBR2, TRIM32, and ADAM10. A network of the hub genes and their coexpressed genes was drawn with the cBioPortal online platform (Fig. 2b). Expression of hub genes in melanoma and normal tissues was evaluated using the GEPIA online database, with red indicating melanoma tissue and gray indicating normal tissue. ADAM10, CCNA2, and TRIM32 showed significant expression increases in tumor tissues. No similar trends were observed for EBP and GABBR2 (Fig. 3).

The expression of hub genes in melanoma and normal tissues was observed in the GEPIA online database. Red indicates melanoma tissue and gray indicates normal tissue. GEPIA, Gene Expression Profiling Interactive Analysis.
3.5. Correction between hub genes in melanoma
We analyzed correlations among CCNA2, EBP, GABBR2, TRIM32, and ADAM10 in the GEPIA database. A total of 10 groups were analyzed, of which 4 were statistically significant (Fig. 4). CCNA2 correlated positively with ADAM10 (R = 0.28, p-value = 4.8e-10), EBP (R = 0.13, p-value = 0.0039), and TRIM32 (R = 0.23, p-value = 4.2e-07). ADAM10 correlated positively with TRIM32 (R = 0.36, p-value = 8.9e-16).
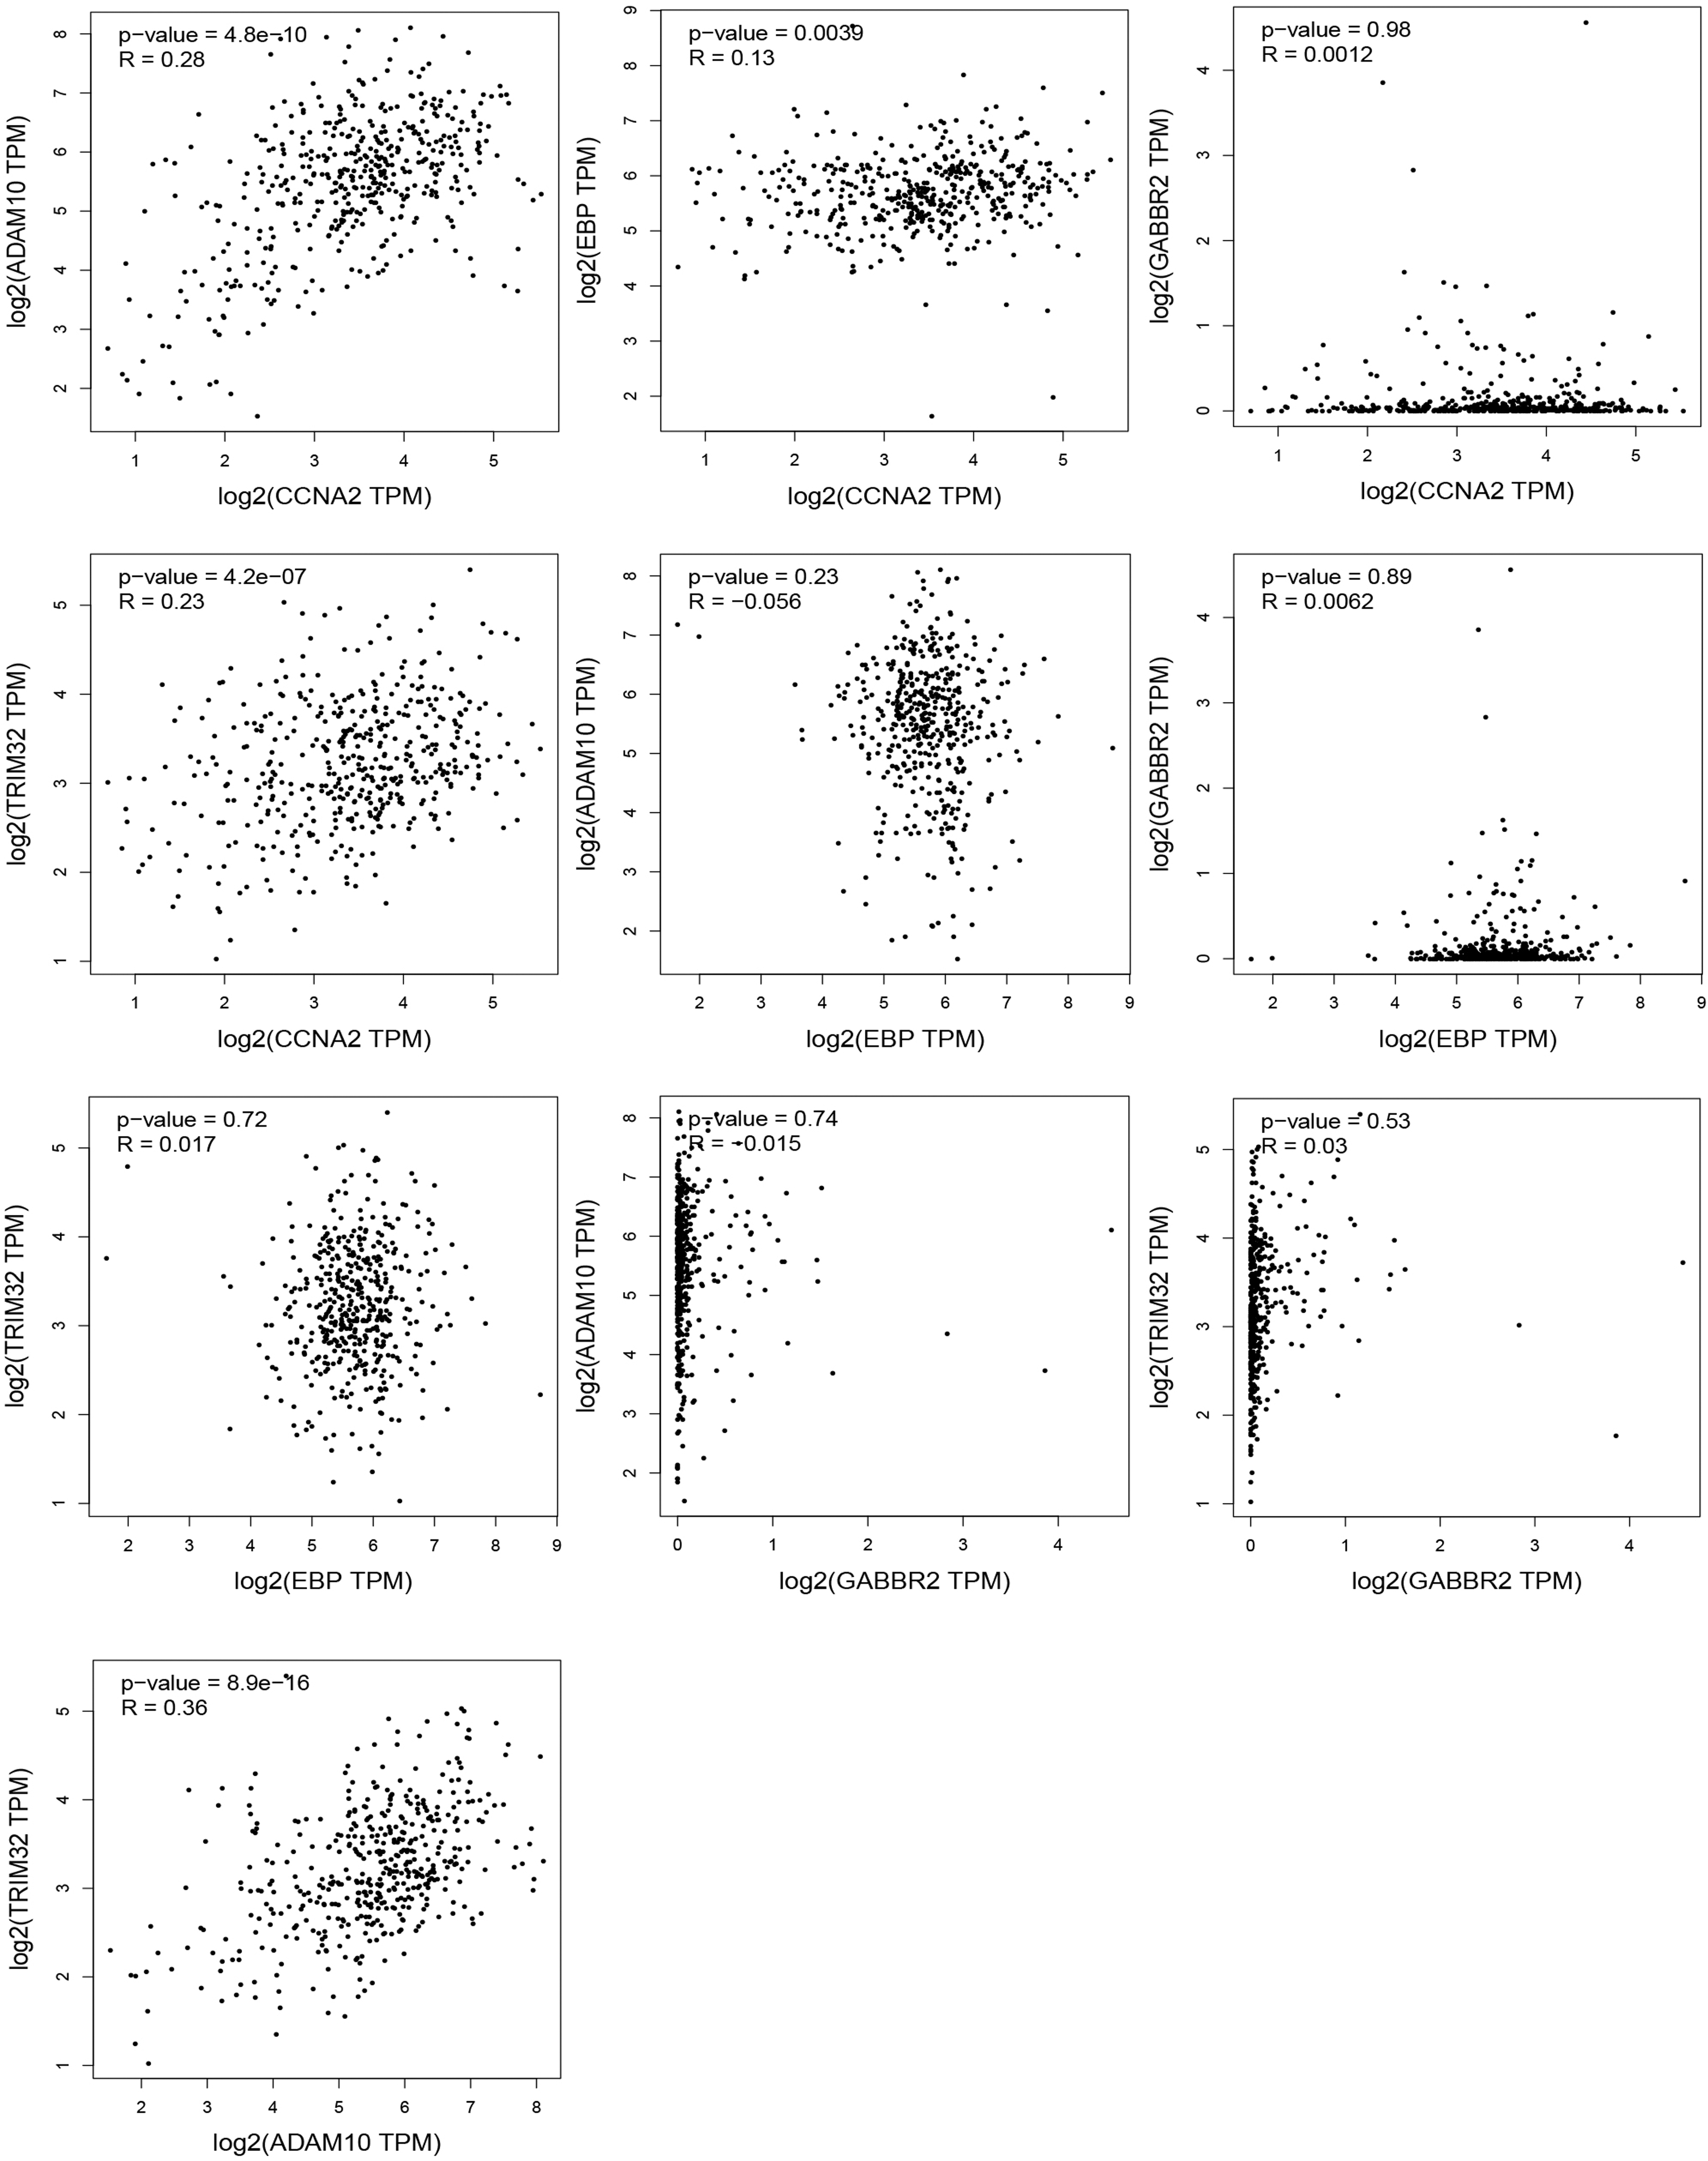
Correlation analysis of ADAM10, CCNA2, EBP, GABBR2, and TRIM32 was performed in the GEPIA database.
3.6. Immunohistochemical analysis
In addition to verifying the mRNA expression levels of hub genes, differential expression in melanoma tissues was examined at the protein level. The five proteins with the most significant differential expression were searched in Human Protein Atlas, with positive expression in melanoma. Figure 5 shows representative immunohistochemical staining. ADAM10 was detected by the antibody CAB001709; low-intensity staining in melanoma tissue and normal tissues was observed, with a proportion of stained cells of <25%. CCAN2 was detected by the antibody CAB000114, exhibiting moderate staining intensity in melanoma tissues but not detection in normal skin tissues. The antibody HPA003130 was applied to detect EBP, with no expression observed in melanoma or normal skin tissue. Detection of GABBR2 by the antibody HPA013820 also revealed no expression in melanoma tissue or normal skin tissue. TRIM32 was detected by the antibody HPA050060, showing high-intensity staining in melanoma tissue, with a proportion of stained cells >75% (Fig. 5).
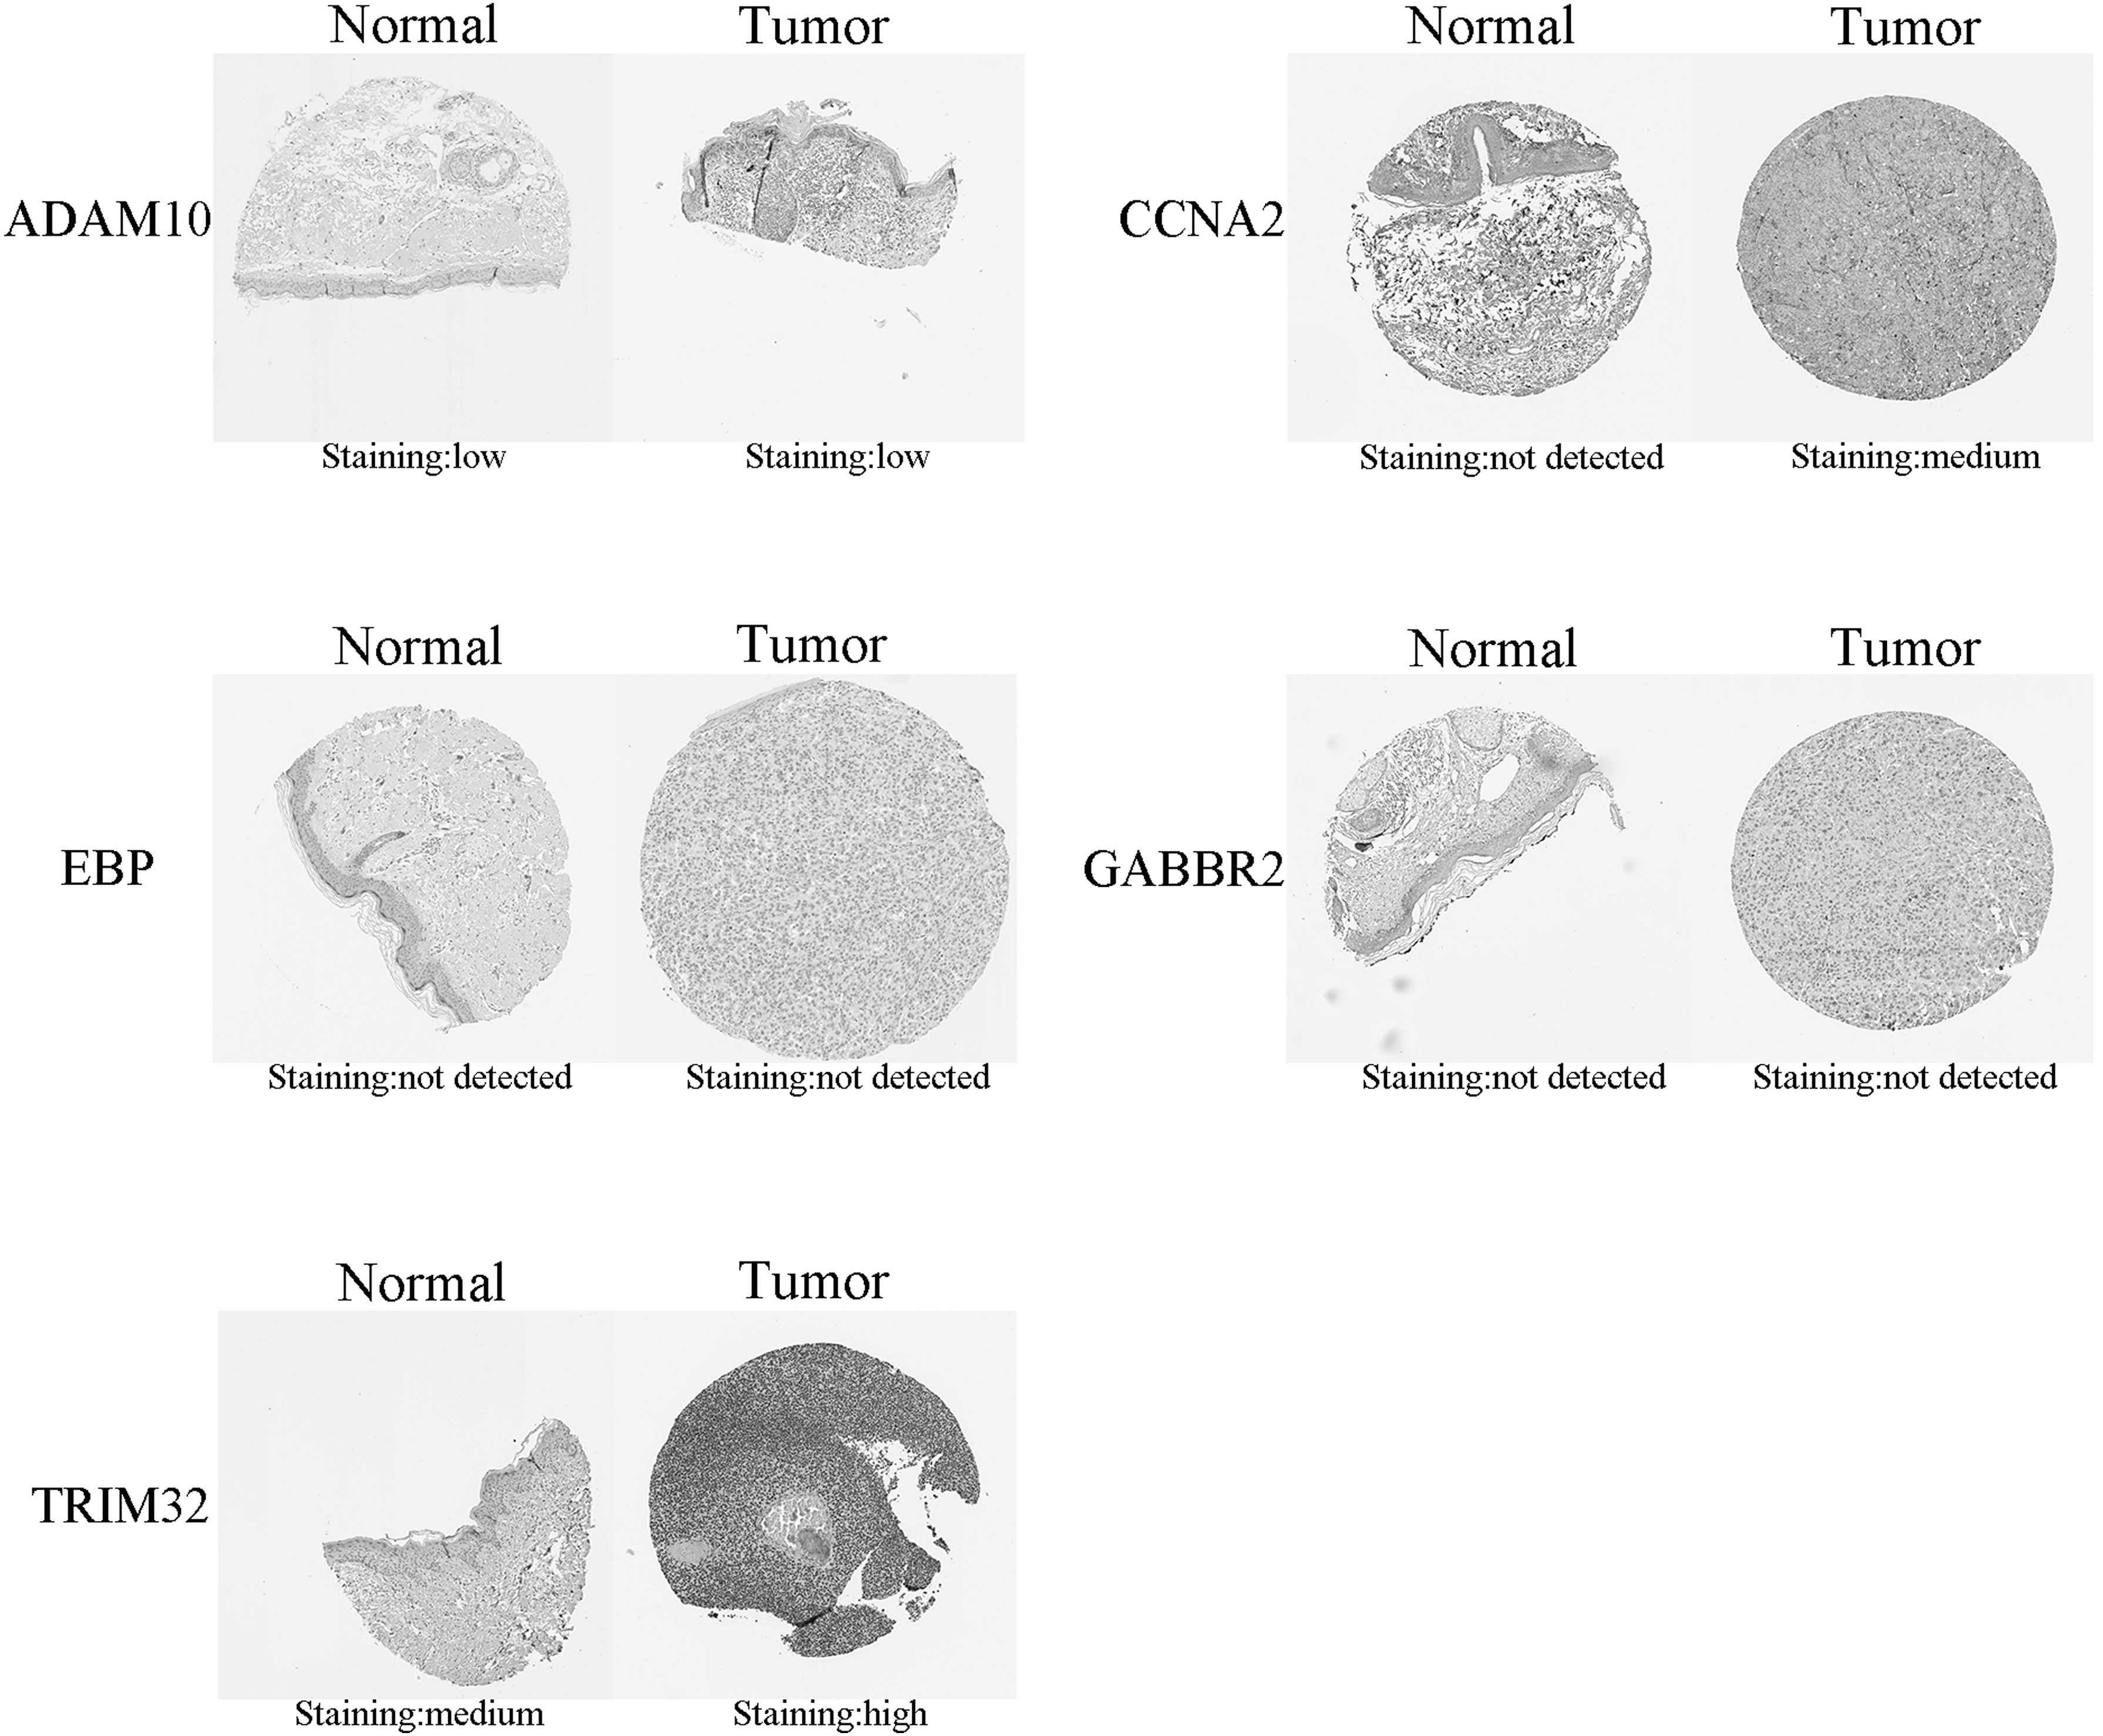
Representative images of immunohistochemistry of ADAM10, CCNA2, EBP, GABBR2, and TRIM32 in melanoma.
3.7. Prognostic value analysis
The five hub genes were evaluated for their relationship with OS using KM curve analysis with the GEPIA database (Fig. 6). High expression of CCNA2 (hazard ratio [HR] = 1.3, p = 0.038), EBP (HR = 1.5, p = 0.0015), GABBR2 (HR = 1.6, p = 0.002), and TRIM32 (HR = 1.4, p = 0.0095) significantly increased the OS risk of patients with melanoma. Regarding DFS, patients with high expression of GABBR2 (HR = 1.4, p = 0.0077) and TRIM32 (HR = 1.3, p = 0.015) had lower DFS, whereas the expression levels of CCNA2, EBP, and ADAM10 had no significant effect on DFS.
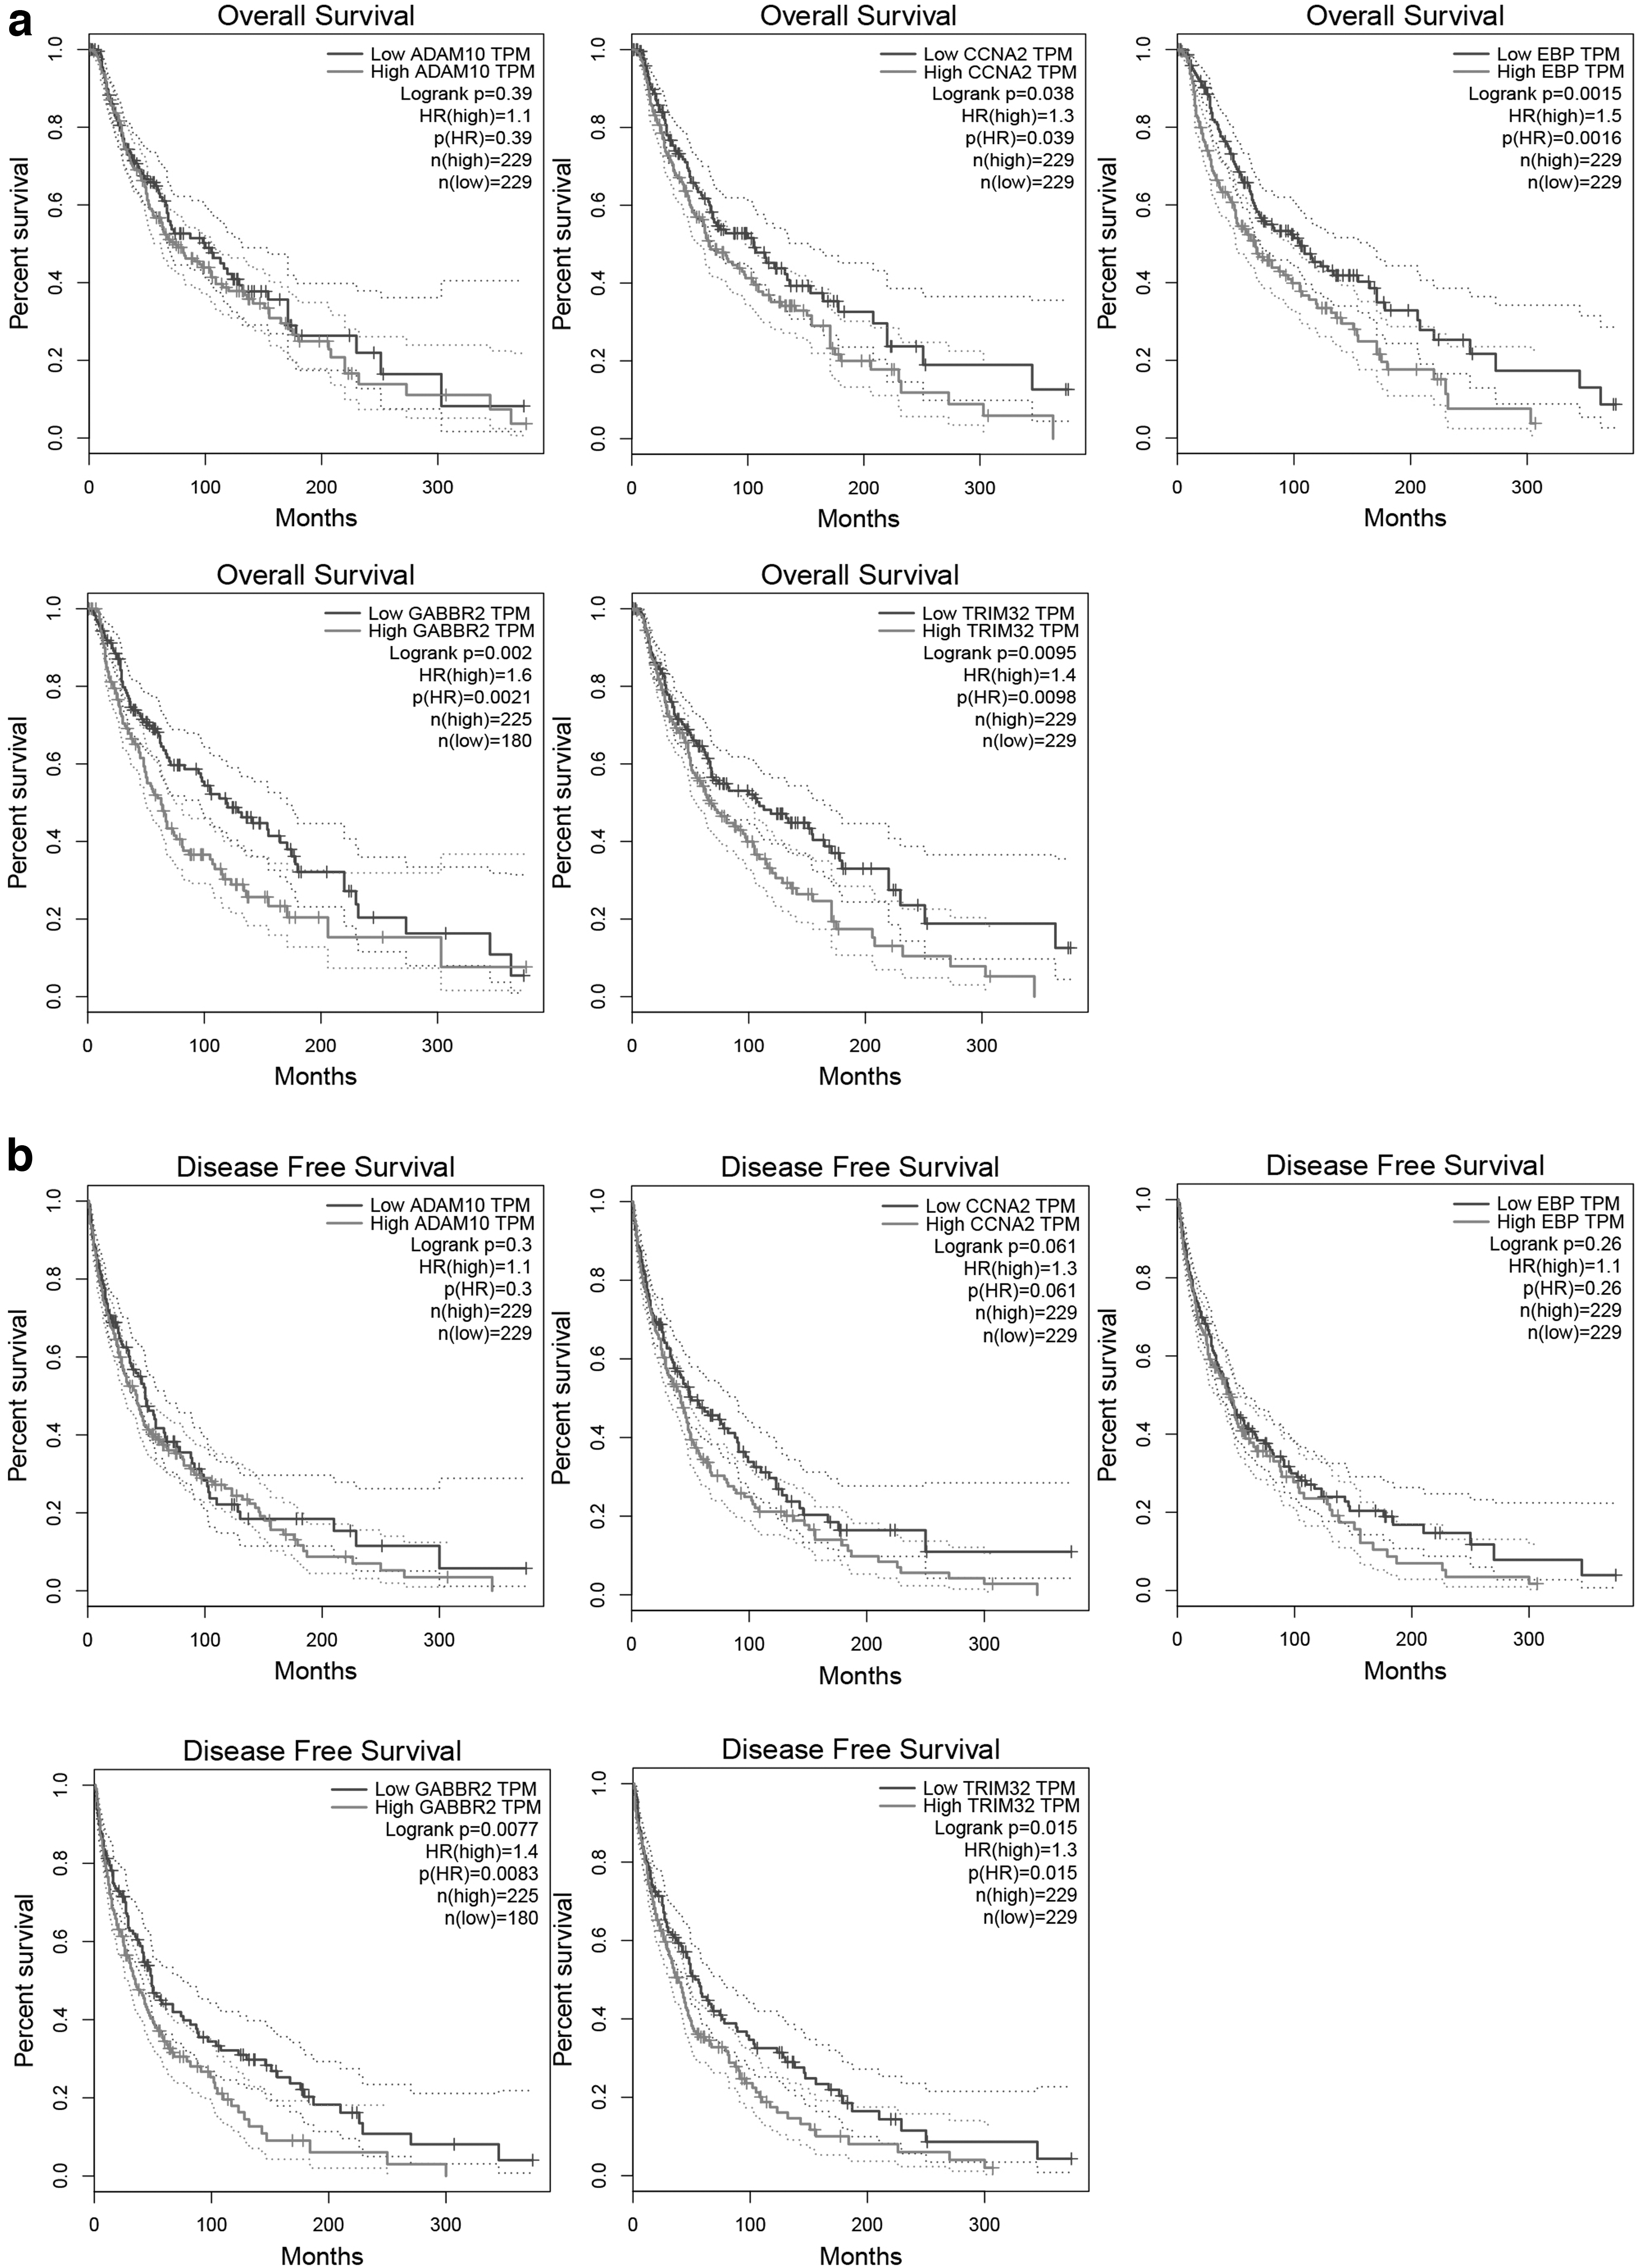
Overall survival and disease-free survival analysis of the hub genes was performed through the GEPIA database. p < 0.05 was considered statistically significant.
4. Discussion
The occurrence, development, and metastasis of melanoma is a very complex process. To gain a deep understanding of the molecular mechanisms and to screen key genes and therapeutic targets for melanoma diagnosis, DEGs between melanoma and normal tissues were screened from the GSE130244, GSE31879, and GSE83583 data sets by bioinformatics analysis. A total of 142 genes were obtained, of which 92 were downregulated and 50 upregulated. Analyses using the STRING database and Cytoscape software showed a large number of interactions between genes in key modules and other differentially expressed genes. We ultimately screened five central genes, ADAM10, CCNA2, EBP, GABBR2, and TRIM32, from the PPI network, and expression of these hub genes was verified in GEPIA and the Human Protein Atlas database. Among them, ADAM10, CCNA2, and TRIM32 were all upregulated in GEO and GEPIA, with statistical significance. Furthermore, increased expression of CCNA2 and TRIM32 at the protein level was observed in melanoma. In survival analysis, high expression of CCNA2 significantly increased the OS risk of patients with melanoma; high expression of TRIM32 was associated with worse OS and DFS. The mRNA and protein expression levels of CCNA2 and TRIM32 in melanoma were significantly higher than those in normal skin tissues and were related to patient prognosis. Thus, these factors have potential as biomarkers.
GO and KEGG analyses revealed the DEGs to be enriched in a variety of cancer-related functions and pathways. The upregulated genes were significantly enriched in nucleic acid binding, zinc ion binding, RNA binding, and DNA binding. These processes are involved in the transcription, post-transcriptional regulation, and translation of genes, and play an important role in the development of melanoma (Eom et al., 2016). Rho guanyl-nucleotide exchange factor activity, the chemokine signaling pathway, metabolic pathways, lysosomes, and apoptosis, which are mainly involved in the nutrient metabolism pathway, foreign body metabolism, necrosis, and apoptosis, were the main functional enrichment terms of the downregulated genes. This finding is consistent with the pathophysiology of melanoma (Kelsey et al., 2017).
Literature mining of these genes has confirmed that CCNA2 and TRIM32 are closely related to the occurrence, invasion, metastasis, and prognosis of various tumors; however, their role in melanoma has not been discovered. Overexpression of CCNA2 in mammals delays the onset of the mid and late stages of the cell cycle, resulting in the uncontrolled malignant proliferation of cells (Yang et al., 2016). In addition, Gao et al. (2014) suggested that CCNA2 is an important predictor of survival in ER+ breast cancer and is closely associated with tamoxifen resistance. In esophageal squamous cell carcinoma, CCNA2 has been confirmed to be a downstream target of miR-219-5p, inhibiting cell proliferation and inducing G2/M cell cycle arrest (Ma, 2019). In the process of tumorigenesis, the epithelial–mesenchymal transition (EMT) is also likely to occur, which may be related to its loose cellular characteristics. EMT can promote the metastasis of a variety of tumors, such as bladder cancer, primary liver cancer, colon cancer, and malignant melanoma. In bladder cancer, Li et al. (2019) demonstrated that CCNA2 plays a dual regulatory role in the cell cycle pathway and EMT progression, and miR-381-3p was found to block EMT progression through CCNA2 as a target.
TRIM32 is a member of the tripartite motif (TRIM) family; by activating the JAK2/STAT3 signaling pathway for cell proliferation, apoptosis and motility, it may be a novel and promising cancer target (Hatakeyama, 2017). TRIM32 is often overexpressed in different types of tumors in a p53-dependent manner and greatly promotes carcinogenic transformation and tumorigenesis. Du et al. (2018) found that TRIM32 protein is upregulated in patients with non-small cell lung cancer, and TRIM32 overexpression is positively associated with poor survival and TNM staging in non-small cell lung cancer (Yin et al., 2019). The experimental results of Cui et al. demonstrated that TRIM32 overexpression correlates with poor prognosis and hyperproliferation of hepatocellular carcinoma (Cui et al., 2016). In contrast to the oncogene MYCN, TRIM32 has the ability to promote asymmetric cell division and is expected to act as a tumor suppressor in human neuroblastoma cells (Izumi and Kaneko, 2014).
In summary, this study mined melanoma gene chip data and screened CCNA2 and TRIM32 from among five hub genes through bioinformatics methods. To our knowledge, there is a lack of research on CCNA2 and TRIM32 in melanoma. Significant differences in the expression of these two genes in melanoma were observed, as were correlations with the prognosis of patients, which may provide a new direction for further understanding the occurrence, development, and metastasis of melanoma. These findings are expected to provide potential targets and biomarkers for clinical detection and treatment. However, the lack of further molecular biology experiments to confirm the function of TRIM32 in melanoma limits such analyses. Nevertheless, the findings of this study contribute to a complete understanding the underlying molecular mechanisms of melanoma and provide guidance for subsequent experimental studies.
Footnotes
Authors' Contributions
Y.X. and D.C. conceived and designed the study. Y.X., J.Z., and Y.L. wrote the article. X.Y. and J.X. performed the data analysis and revised the article critically.
Author Disclosure Statement
The authors declare they have no conflicting financial interests.
Funding Information
No funding was received for this article.