
Abstract
The IDH1 mutation is the most frequent somatic mutation in gliomas, and it has an important impact on the treatment outcome of gliomas. Clinically, the gold standard methods for the IDH mutation detection are the immunohistochemistry and gene sequencing techniques, whereas using the histopathology images of the glioma tissues for IDH mutation identification has not been reported. In this study, we propose a convolutional neural network (CNN) model that is trained on histopathology images of glioma samples using multiple instance learning (MIL), which links the benefits of the end-to-end classification power of the deep neural network with the MIL by aggregating the scores of the instances to the bag-level score. The attention layer is also implemented to facilitate the performance of the MIL aggregation. The results show that our MIL-based CNN model has achieved good performance in the classification of the IDH1 mutation in the glioma images, with the area under the curve of 0.84. Besides, several image segmentation strategies, CNN architectures, and MIL pooling operators have been implemented and analyzed to investigate the effect of these settings on the model performance. To our knowledge, it is the first study to identify the IDH1 mutation by using the histopathology images of the glioma tissues, providing a novel and insightful method for glioma IDH mutation diagnosis.
1. INTRODUCTION
Gliomas are the most common primary brain tumors (Dolecek et al., 2012), and it is reported that somatic mutations in the isocitrate dehydrogenase 1 and 2 genes (IDH1 and IDH2), which occur in codons R132 and R172, respectively (Yan et al., 2009), provide an important clinical value in the treatment of gliomas (Parsons et al., 2008). Substitution of R132 with other amino acids in gliomas (His, Ser, Gly, Cys, and Leu) impairs the enzymatic activity of catalytic conversion from isocitrate to alpha-ketoglutarate. Patients with IDH mutations have longer survival time than those without the mutations (Ichimura et al., 2009), and the IDH1 mutation is reported to be a distinct indicator for chemotherapy selection of glioma patients (Taal et al., 2011). Therefore, it is necessary to investigate the methods to identify the IDH mutations in glioma patients.
Clinically, the gold standard for IDH mutation detection is to evaluate the surgical samples by immunohistochemistry (IHC) and gene sequencing methods (Komori et al., 2016), but both methods have some shortcomings. On the one hand, though the IHC method can identify the most frequent IDH1 mutation, R132H, it requires supplementary molecular methods to detect some less common IDH mutations, which is laborious. On the other hand, the sequencing utility is limited by its sensitivity in the current routine mutation screening. Nowadays, the digitization of tissue slides offers the opportunity for better characterization of diseases, and image analysis assisted detection tools are developed (Madabhushi and Lee, 2016), whereas using histopathology images for IDH mutation identification has not been reported so far.
With the development of the deep learning algorithms and high-content screening technologies, researchers could use the deep neural networks trained end-to-end to learn powerful features from the well-screened medical images for image classification (Mishra et al., 2018). It is assumed that one image clearly represents a category in the traditional image classification. However, in practical scenarios, medical images are often weakly annotated, which means that multiple instances are observed and only a general description of the category is given. Under these circumstances, the traditional classification issue should be transferred into the multiple instance learning (MIL) issue (Dietterich et al., 1997). MIL can deal with a bag of instances and assigns a single category tag to it, so that it is useful in the classification problems of weakly annotated images (Kraus et al., 2016). When it comes to the detection of the IDH1 mutation in the glioma images, we assume that some patterns in the histological images may be correlated to the IDH1 mutation rather than the whole images. Therefore, the binary classification of the glioma images, to identify the IDH1 mutation in the corresponding tissue, can be transferred into the MIL issue by segmenting the whole image into small patches.
In this article, we propose a convolutional neural network (CNN) that is trained on histopathology images of glioma samples using the MIL. The deep neural network is applied to parameterize all transformations, which increases the flexibility of the method and allows the model to be trained end-to-end by optimizing the unconstrained objective function. What is more, several segmentation strategies and CNN structures have been implemented to investigate which patch size or model architecture performs the best in this MIL classification problem. Finally, two MIL operators, the mean operator or the max operator, is used to aggregate the result of multiple instances in one bag, and the attention mechanism is also added to improve the power of the model (Qi et al., 2017). In the experiment, the model is trained by using the real histopathological image dataset and is validated for its utility in the IDH1 mutation classification.
2. METHODS
2.1. Dataset and image segmentation
The 1121 original histopathology ROI (region of interest) images (1024 × 1024 pixels), cropped from the histopathology slides of glioma patients, were downloaded from the link in the paper published in 2018 (Mobadersany et al., 2018) and its related clinical information is collected from TCGA (The Cancer Genome Atlas) via the Genomic Data Commons (https://gdc cancer.gov). There are 682 images of gliomas with the IDH1 mutation and 439 images without the IDH1 mutation, as shown in Table 1.
Overview of the Clinical Information of the Total 1121 Glioma Histopathology Images
The ROI images were then segmented into small patches with different patch sizes (e.g., 32 × 32 pixels, 64 × 64 pixels, 128 × 128 pixels, 256 × 256 pixels, 512 × 512 pixels), and the detailed information is listed in Table 2. The diagram of each patch with different segmentation strategies is shown in Figure 1. As mentioned in the MIL section, each original image is considered as a bag with a single label, and its small patches are considered as the instances of the bag. Several experiments were run with different patch sizes to find out which patch size can better reflect the IDH1 mutation from the full-size image.
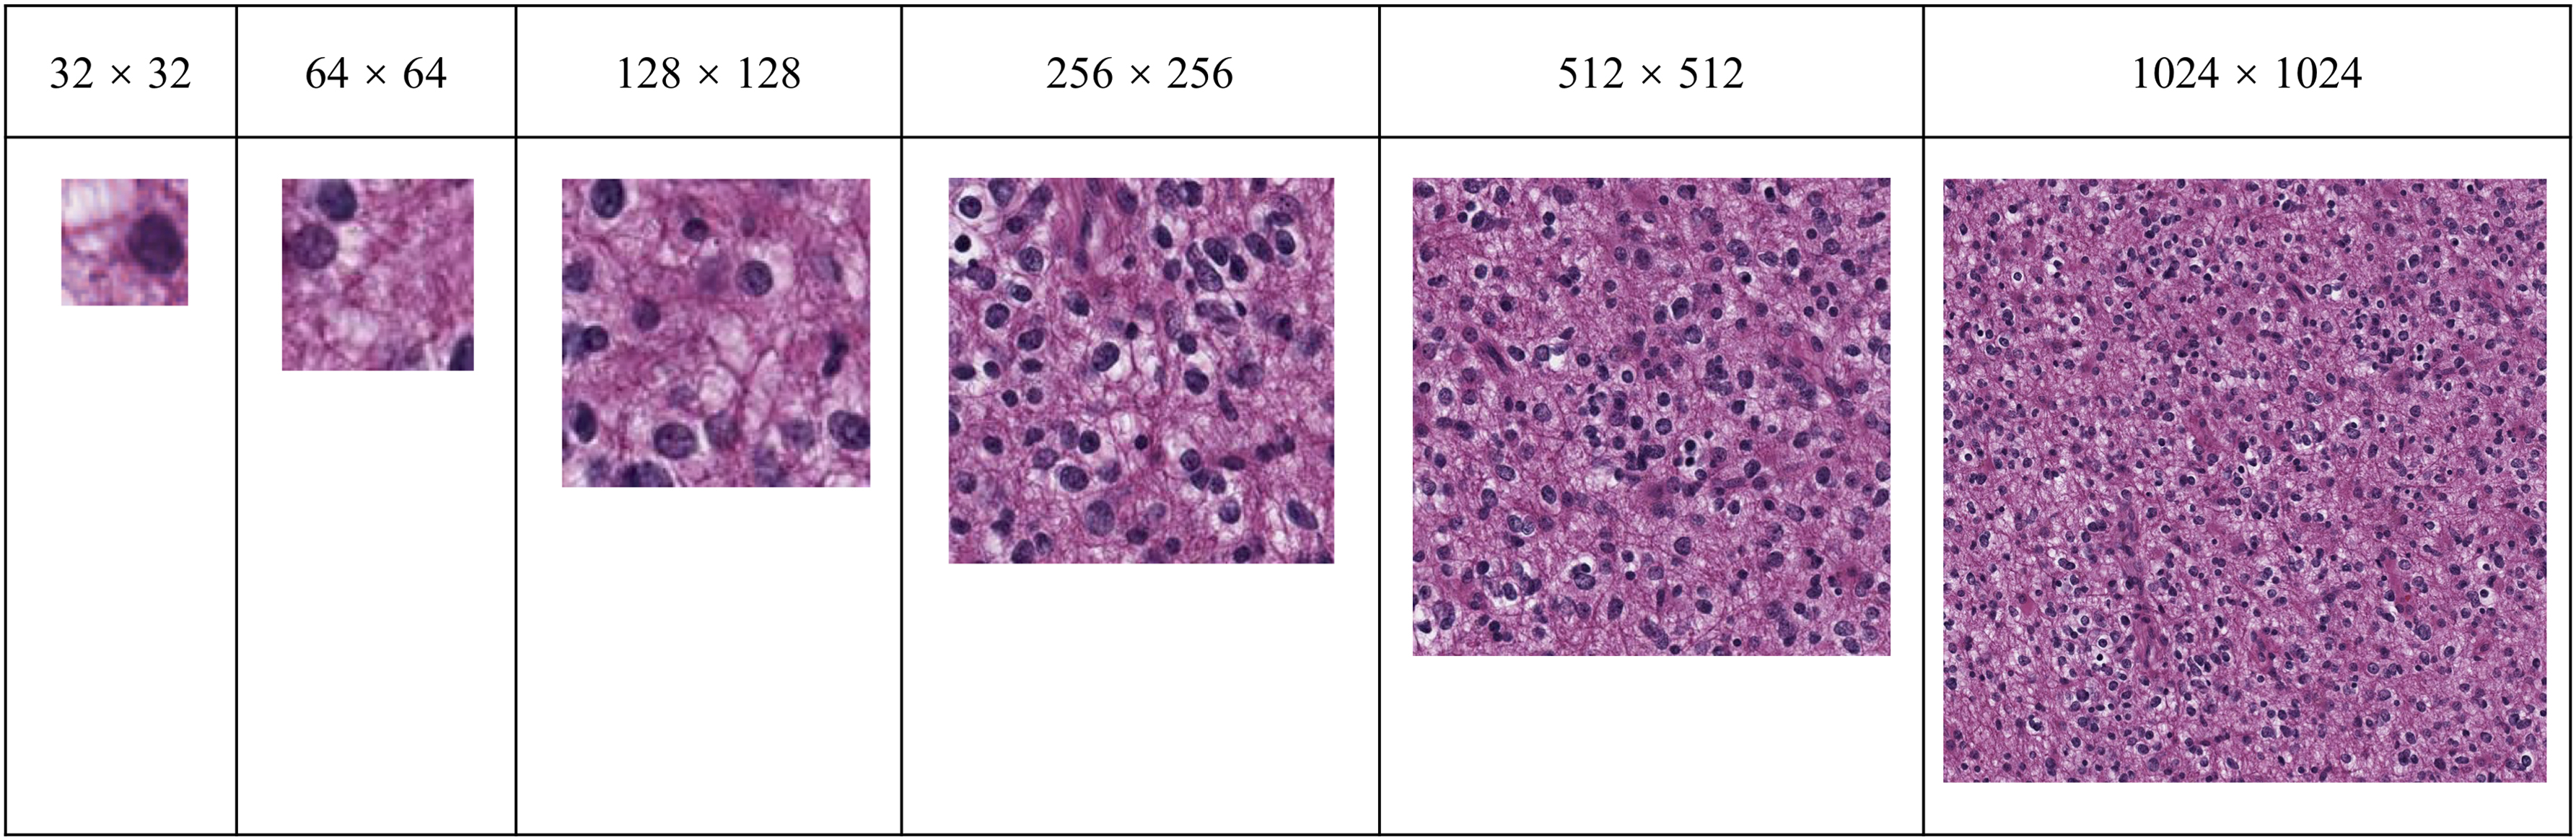
The diagram of each patch (unit: pixels) with different segmentation strategies.
Overview of the Datasets with Different Patch Sizes
2.2. Multiple instance learning
MIL is used when dealing with weakly annotated data, in which a set of data points is often referred to as a bag X, and its specific data points is called instances X = {x1, x2, …, xK}. Similar to the binary supervised learning problem, each bag has a single binary label Y∈{0, 1}. We assume that the binary label also exists for every instance within the bag, that is, y1, …, yK and yi∈{0,1}, for i = 1, …, K; whereas the instance-level label remains unknown. It is commonly assumed that if at least one instance of the bag is positive, the bag is considered as positive (Dietterich et al., 1997), and the formulation of this MIL problem is depicted next (Ilse et al., 2018):

An MIL pooling operator is implemented in the MIL pooling layer to aggregate the instance scores into the bag-level score. The pooling operator can be either the mean pooling or the maximum pooling operator, whereas both the MIL pooling operators are untrainable and lack of flexibility. Therefore, the attention mechanism is introduced to assign different weights to instances within each bag and allows the bag-level score to be highly informative (Wang et al., 2018).
2.3. MIL-based CNN structure
We propose an MIL-based CNN model that is capable of classifying histopathology images and is trained with only global image-level labels. The images with the IDH1 mutation are labeled as “1,” whereas others are labeled as “0.” The bags containing patches of images were input with bag-level labels, and multiple convolutional layers and pooling layers were added in the CNN architecture. An attention layer with sigmoid activation was then used to calculate weights inside each bag. The weights are determined by the neural network and sum to 1 to be invariant to the size of a bag. After obtaining instance-level scores via this attention layer, an MIL pooling operator, either mean pooling or maximum pooling, was utilized to aggregate instance scores into a bag-level score. Finally comes the full-connected layer to output the classification prediction of each bag.
2.4. Model architecture
The Keras (Chollet, 2015), a high-level neural network API written in Python, was used to implement our CNN structures. The workflow of this MIL-based CNN model is shown in Figure 2. The original images were segmented into small patches, namely the instances within the bag. The bags of instances were then input into the CNN to calculate the scores of the instances; then, the bag-level score was aggregated by using the MIL pooling operators to generate the classification result.
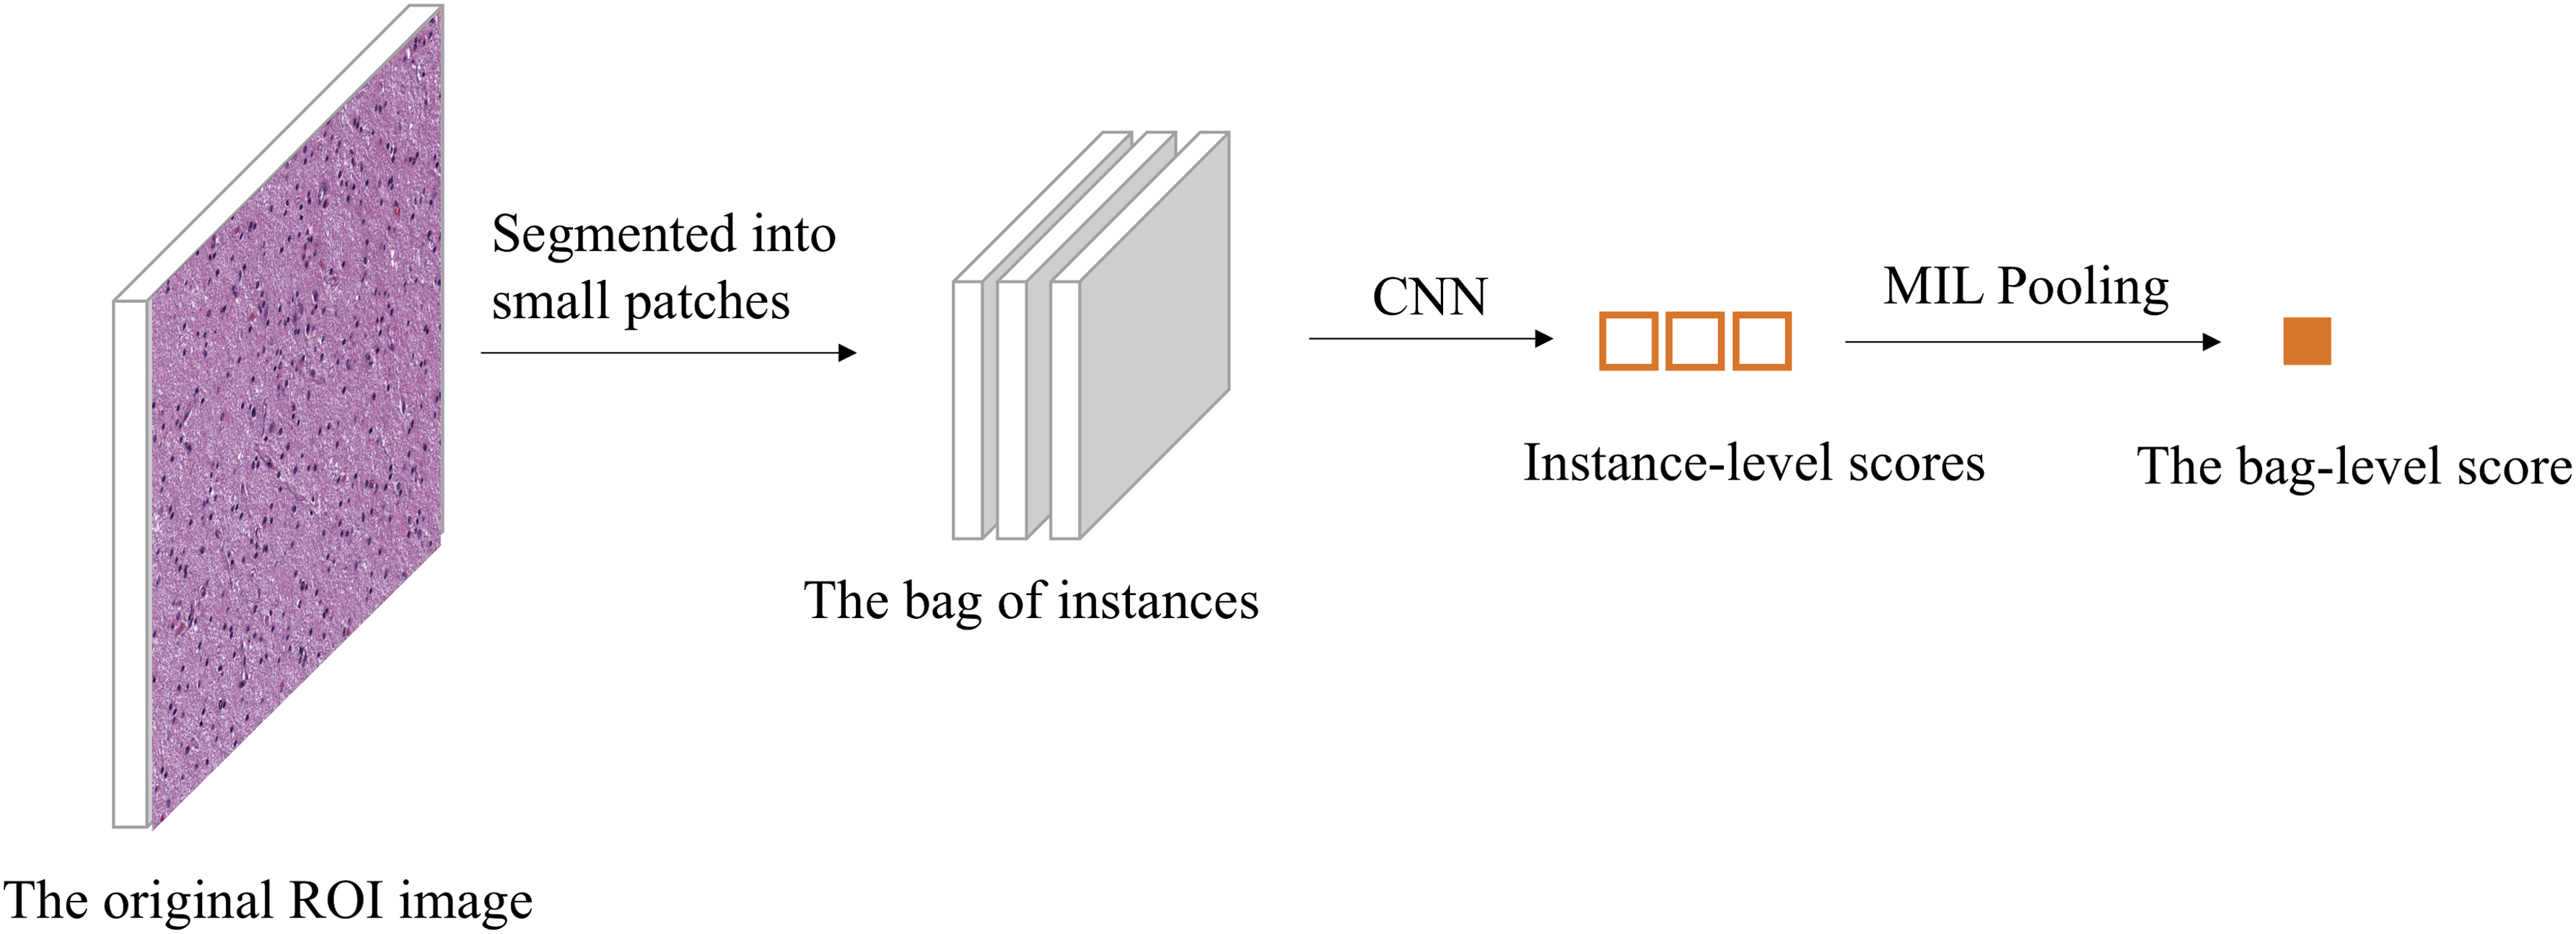
The workflow of the MIL-based CNN model. The raw images (1024 × 1024 pixels) were segmented into small patches. Each original image is considered as a bag and its small patches are considered as the instances of the bag. The bags of instances were then input into the CNN to calculate the scores of the instances; then, the bag-level score was aggregated by using the MIL pooling operators to generate the classification result of the IDH1 mutation. CNN, convolutional neural network; MIL, multiple instance learning.
Several structures have been built and tested to optimize the performance of the model. The detailed architectures are shown in Figure 3. Each color of the layers presents a distinct layer type, for example, the convolutional layer, the pooling layer, the attention layer, and the full-connected layer. The architectures are different in the numbers of the convolutional layers and the pooling layers, and they are more complicated from the architecture A to the architecture D as indicated in Figure 3.

The overview of different CNN architectures.
3. RESULTS
3.1. Model training and validation
The models were run on NVIDIA TITAN Xp with a batch size of 1 for all experiments. We trained models with a learning rate of 10−4 and a weight decay of 0.0005 by using the Adam optimization algorithm (Kingma and Ba, 2014). What is more, due to the limited amount of data samples, the data augmentation approach was applied to prevent overfitting in the training dataset. A common evaluation method, the 10-fold cross-validation, was performed to reach a fair evaluation result. The images were randomly split into 10-folds, of which 9-folds were the training set and 1-fold was the testing set, and the average accuracy of the 10 times validation was regarded as the final accuracy. The precision, recall, and the value of the area under the curve (AUC) were also calculated to further evaluate the performance of the models.
3.2. Overview of the performances among the MIL models
Among all the segmentation strategies and architecture choices, the model of which the patch size is the 256 × 256 pixels and the MIL operator is the maximum pooling, with the architecture C achieving the best performance. The accuracy, precision, and recall of this model were 78.95%, 82.23%, and 83.43%, respectively. The receiver operating characteristic curve is shown in Figure 4, and the value of AUC reached 0.84.
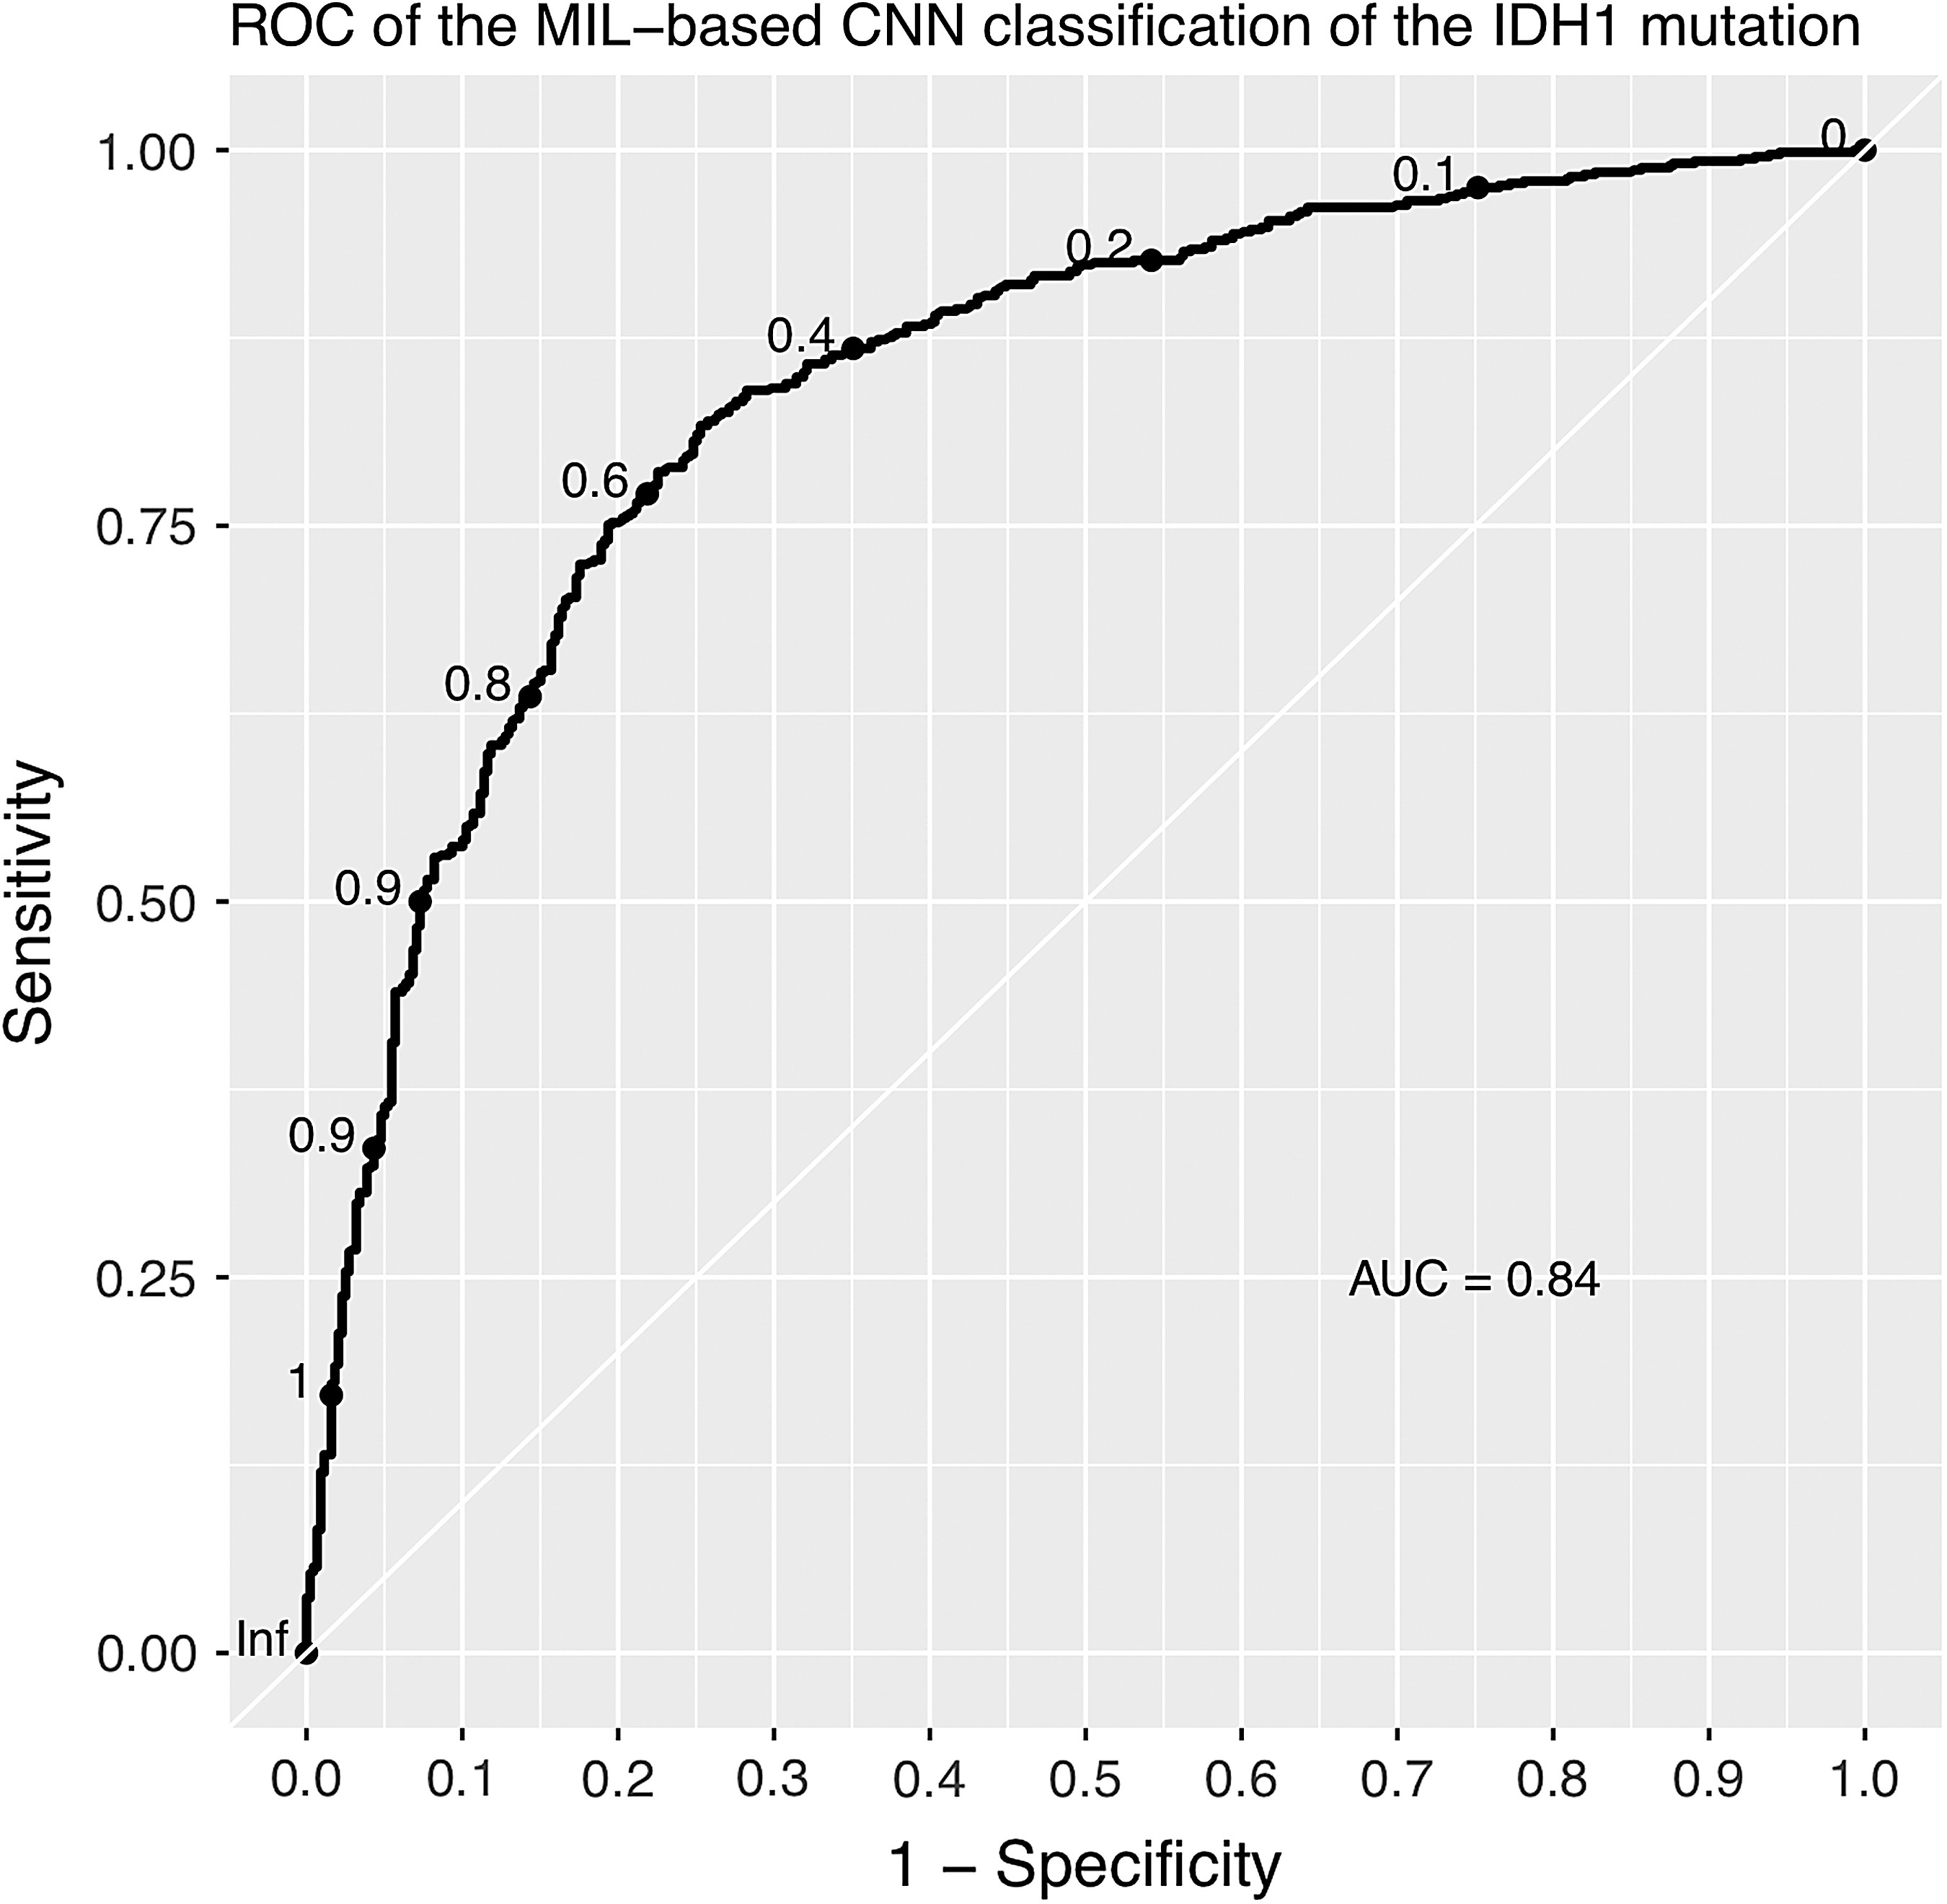
ROC of the MIL-based CNN classification of the IDH1 mutation. AUC, area under the curve; ROC, receiver operating characteristic.
3.3. The effect of the patch size on the model performance
To find out how the patch size affects the performance of the model, several experiments were run with different patch sizes, for example, 32 × 32 pixels, 64 × 64 pixels, 128 × 128 pixels, 256 × 256 pixels, 512 × 512 pixels, and the full size, as shown in Figure 1. It is worth noting that all the experiments with input patch size no less than 128 × 128 pixels were trained in the 14-layer architecture C framework to control variates, but due to the fact that the image size of 32 × 32 pixels or 64 × 64 pixels is too small for the multiple pooling layers of the architecture C to analyze, the experiments with patch sizes of 32 × 32 pixels, 64 × 64 pixels were trained with the architecture A and architecture B frameworks instead. The 10-fold validation performance of models with different patch sizes using the mean pooling operator and the maximum pooling operator is shown in Tables 3 and 4. The performance kept improving with the increase of the patch size, until the 256 × 256 pixels; then, it fell down as the patch size became larger. This trend existed in both MIL mean pooling and maximum pooling operators and indicates that among all the patch sizes, the patch size of 256 × 256 pixels is the best segmentation strategy for the classification of the IDH1 mutation in the glioma ROI images.
The 10-Fold Validation Performance of Models Using the Mean Pooling Operator with Different Patch Sizes
AUC, area under the curve. The bold values represent the best performance of the model using the mean pooling operator, with the patch size of 256 × 256 pixels.
The 10-Fold Validation Performance of Models Using the Max Pooling Operator with Different Patch Sizes
The bold values represent the best performance of the model using the mean pooling operator, with the patch size of 256 × 256 pixels.
3.4. The effect of the CNN architectures on the model performance
What is more, the performance of models with different CNN structures shown in Figure 3 was also evaluated. In this case, the patch size of 256 × 256 pixels was set as the segmentation size and the result is shown in Table 5, which implies that the complexity of the model is not directly related to the model performance. The architecture C, which is less complicated than architecture D, achieved a better performance in accuracy, precision, and recall in the 10-fold validation.
The 10-Fold Validation Result of Models with the Patch Size of 256 × 256 Pixels in Different Architectures
CNN, convolutional neural network. The bold values represent Architecture C achieved the best performance among all the architectures.
3.5. The effect of the MIL pooling operators on the model performance
As aforementioned, two MIL pooling operators, the maximum pooling and the mean pooling, have been implemented to aggregate the scores of the instances to the bag-level score. The results (Tables 3 and 4) imply that there is a slight difference between the classification utility of the two operators in regard to the average accuracy of the 10-fold validation, suggesting that the maximum pooling operator performs better than the mean pooling operator by a small margin.
4. DISCUSSION
Our MIL-based CNN model links the benefits of the end-to-end classification power of the deep neural network with the MIL by aggregating the scores of the instances to the bag-level score using the MIL pooling layer, and the attention mechanism is also implemented to facilitate the performance of the MIL aggregation. The MIL method allows the model to learn both the instance level and the bag level classifiers for the weakly annotated histopathology images of the gliomas. The results show that the MIL-based CNN model has achieved a good performance in the classification of the IDH1 mutation in the glioma images, with the AUC of 0.84. This demonstrates that image patterns in the histopathology images may be correlated to the IDH1 mutation.
We also compare the results of the MIL models in different settings. First, the patch size of 256 × 256 pixels achieved the best performance compared with other segmentation methods, which indicates that this patch size of 256 × 256 pixels could better present the IDH1 mutation reflection in the whole glioma ROI images. The variation among the performances of the models with different patch sizes validated our assumption that the IDH1 mutation may be correlated to some patterns in the images rather than the whole images. Second, the maximum pooling operator performs slightly better than the mean pooling operators, which is fit to the fact that the maximum operator is mostly used in the MIL problem (Pinheiro and Collohert, 2015; Feng and Zhou, 2017). Further, several CNN architectures have been implemented and their results in the IDH1 mutation classification indicate that the model complexity cannot guarantee a better performance. The 14-layer architecture C using the maximum pooling operator with the patch size of 256 × 256 pixels performed best among all the models in the experiment.
Though the mechanism of IDH mutations in the pathogenesis of gliomas is not fully understood, there is sufficient evidence that IDH mutations contribute to the global hypermethylation, namely the glioma-CpG island methylator phenotype, by producing 2-hydroxyglutarate (2-HG), thereby inhibiting the involved enzymes in histone and DNA demethylation (Horbinski, 2013; Flavahan et al., 2016). In addition, IDH1 is an enzyme involved in the citric acid cycle that converts isocitrate to a-ketoglutarate, and it is essential for the production of adenosine triphosphate (ATP), which is required for cellular energy (Geisbrecht and Gould, 1999). Therefore, it is assumed that the epigenetic and energy changes caused by IDH1 mutations might result in the morphological changes of cells and extracellular environment and eventually be reflected and detected in the histopathology images of the glioma tissue. And the performance of our model proves that it is possible to detect the IDH1 mutation from the glioma images to some extent. The reason that the performance is not extremely good might be the limited amount of data samples. The number of the ROI images used in the experiment is only 1121, which is not large enough to fulfill the required training data size of the deep neural network, and more images should be added in the training set to further improve the accuracy of the IDH1 mutation detection.
In summary, we proposed a deep MIL model to classify the IDH1 mutation using the glioma histopathology images. By segmenting the original image into small patches and implementing the MIL pooling layer to the CNN model, the classical binary classification was transferred into the MIL classification. The accuracy, precision, recall, and AUC of the model are 78.95%, 82.23%, 83.43%, and 0.84%, respectively, which validate the classification power of our MIL-based model. Although some limitations still exist, it is the first time to classify the IDH1 mutation by using the histopathology images of the glioma tissue, and our model might assist the gold standard methods, namely the IHC and gene sequencing techniques, in precisely detecting the IDH1 mutation for the glioma patients.
Footnotes
AUTHOR DISCLOSURE STATEMENT
The authors declare they have no conflicting financial interests.
FUNDING INFORMATION
This study was supported by the National Key Research and Development Program of China (No. 2016YFB0201702 and No. 2018FYC0910700), and the Shanghai Committee of Science and Technology, China (No. 18511102700).