
Abstract
Methods to impute missing data are routinely used to increase power in genome-wide association studies. There are two broad classes of imputation methods. The first class imputes genotypes at the untyped variants, given those at the typed variants, and then performs a statistical test of association at the imputed variants. The second class, summary statistic imputation (SSI), directly imputes association statistics at the untyped variants, given the association statistics observed at the typed variants. The second class is appealing as it tends to be computationally efficient while only requiring the summary statistics from a study, while the former class requires access to individual-level data that can be difficult to obtain. The statistical properties of these two classes of imputation methods have not been fully understood. In this study, we show that the two classes of imputation methods yield association statistics with similar distributions for sufficiently large sample sizes. Using this relationship, we can understand the effect of the imputation method on power. We show that a commonly used approach to SSI that we term SSI with variance reweighting generally leads to a loss in power. On the contrary, our proposed method for SSI that does not perform variance reweighting fully accounts for imputation uncertainty, while achieving better power.
1. Introduction
Genome-wide association studies (GWAS) have been successfully used to discover genetic variants, typically single-nucleotide polymorphisms (SNPs), that affect the trait of interest (Hakonarson et al., 2007; Sladek et al., 2007; Zeggini et al., 2007; Yang et al., 2011; Köttgen et al., 2012; Lu et al., 2013; Ripke et al., 2013). GWAS measure or type the genotypes of individuals at a chosen set of SNPs, and then perform a statistical test of association between a given SNP and the trait of interest. SNPs, at which the null hypothesis of no association between the genotype and the trait can be rejected, are said to be associated with the trait. The threshold that the absolute value of association statistics passes to reject null hypothesis is also referred as significance level.
In a typical GWAS, due to the cost considerations, only a subset of SNPs is genotyped (typed SNPs). Thus, a direct analysis of typed SNPs is likely to have reduced power to detect associations between untyped SNPs and the trait. Imputation methods, which aim to fill in “data” at untyped SNPs, are commonly used to increase the power of GWAS. These methods all rely on the correlation or linkage disequilibrium (LD; Pritchard and Przeworski, 2001; Reich et al., 2001) between genotypes at untyped SNPs and those at typed SNPs (Browning and Browning, 2007; Marchini et al., 2007; Howie et al., 2009, 2012; Li et al., 2009, 2010; Marchini and Howie, 2010). Initial work on imputation focused on the problem of genotype imputation, that is, inferring the genotypes at untyped SNPs given the genotypes at typed SNPs. Genotype imputation methods rely on a reference panel, in which individuals are typed at all SNPs of interest, to learn the LD patterns across SNPs. Given a target data set in which genotypes are typed at a subset of the SNPs, these methods rely on the LD patterns learned from the reference panel to infer the genotypes at the remaining untyped SNPs.
In the context of GWAS, there are two broad classes of imputation methods to estimate the association statistics at untyped SNPs. The first class relies on genotype imputation to infer the genotypes at the untyped SNPs followed by computing association statistics at the imputed genotypes (Browning and Browning, 2007; Marchini et al., 2007; Howie et al., 2009, 2012; Li et al., 2009, 2010). We refer to this class of imputation methods as the two-step imputation methods. In practice, the most successful methods for the first step of genotype imputation are based on discrete hidden Markov models (HMMs; Browning and Browning, 2007; Marchini et al., 2007). The second class of methods directly imputes the association statistics at the untyped SNPs, given the association statistics at the typed SNPs. As shown in previous work (Han et al., 2009; Kostem et al., 2011), the joint distribution of marginal statistics at the typed SNPs and untyped SNPs follows a multivariate normal distribution (MVN; Han et al., 2009; Kostem et al., 2011; Hormozdiari et al., 2014, 2015, 2016). This class of methods utilizes the correlation between the association statistics induced by their dependence on the underlying genotypes (Lee et al., 2013; Pasaniuc et al., 2014). This class of methods is termed summary statistic imputation (SSI). SSI is appealing as it tends to be computationally efficient while only requiring the summary statistics from a study, while the first class requires access to individual-level data, which can be difficult to obtain in practice.
Current summary statistic-based imputation methods calibrate the imputed statistics using a technique we call variance reweighting (SSI-VR). Despite recent progress, the statistical properties of SSI methods (including the impact of variance reweighting) and the connection between the two classes of SSI methods have not been adequately understood.
In this study, we characterize the asymptotic distribution of the association statistics under each of the two classes of imputation methods, the two-step imputation and SSI. The resulting statistics are asymptotically multivariate normal with differences in the underlying covariance matrix that depend on the details of the HMM used for genotype imputation. Using this characterization, we can understand the effect of the imputation method on power. Our new method, SSI, performs SSI without variance reweighting. The resulting statistics do not then have unit variance as in traditional SSI, but instead correctly take into account the ambiguity of the imputation process. We compared the performance of the imputation methods on the Northern Finland Birth Cohort (NFBC) data set (Sabatti et al., 2009) to show that SSI increases power over no imputation, while SSI-VR can sometimes lead to lower power. Finally, we ran SSI, SSI-VR, and two-step imputation on the NFBC data set and show that the resulting statistics are close, thereby justifying the theory.
2. Methods
2.1. Summary statistics
Under the null hypothesis, the joint distribution of the association statistics of the U untagged SNP sU and the O tag SNPs sO follows an MVN:
Since none of the
2.1.1. Summary statistic imputation
Under the null assumption where
The observed statistics are denoted
Let
2.1.2. SSI with variance reweighting
From the previous result, we have
Let si be the statistic at the ith untagged SNP. Thus, instead of imputing si using
2.2. The impact of imputation on the rejection boundary
SSI uses the following function to impute statistics at the unobserved statistics:
Proof. See Section S2 in Supplementary Material.
In SSI-VR, instead of using
In SSI-VR, untagged variant i will effect the rejection boundary iff
2.3. Two-step imputation
The two-step approach to SSI first performs genotype imputation followed by testing for association using the imputed genotypes. Genotype imputation fills in the genotypes at the unobserved SNPs
2.3.1. Genotype imputation using MVN
First, we consider an MVN with mean zero and covariance matrix given by the LD matrix to model the distribution of the genotype vector at the observed and unobserved SNPs for each individual (Wen and Stephens, 2010). We can then impute the genotypes for missing SNPs

where
Given a vector of continuous phenotypes
Here we used
This function is identical to SSI-VR as seen in Equation 5. Thus, applying the imputation function in Equation 6 to directly impute genotypes is equivalent to SSI-VR.
2.3.2. Genotype imputation using HMMs
We consider the use of an HMM for genotype imputation. These models assume that a reference panel 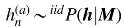 for
for
The effect size estimate for SNP j:
We show in Section S1 of the Supplementary Material that the vector of association statistics asymptotically follows an MVN:
The asymptotic covariance matrix of the association statistics
Here
3. Results
3.1. Overview of summary statistics
Assume we have a total of
Let
Under the null where we assume that none of the SNPs is causal,
3.2. Example
We consider a simple example to illustrate how imputation affects the rejection threshold at a given set of SNPs. We consider three SNPs:
Thus, having the joint distribution of the statistics s1, s2, and s3, we can compute the conditional distribution of the untyped SNP conditioned on the marginal statistics of the typed SNPs s1 and s2:
Typically, SSI uses the posterior mean of the statistic s3, given the observed values of
We choose thresholds t for rejecting each of the statistics
In the case where no imputation is performed, we only test two SNPs. We use the same threshold t for SNPs
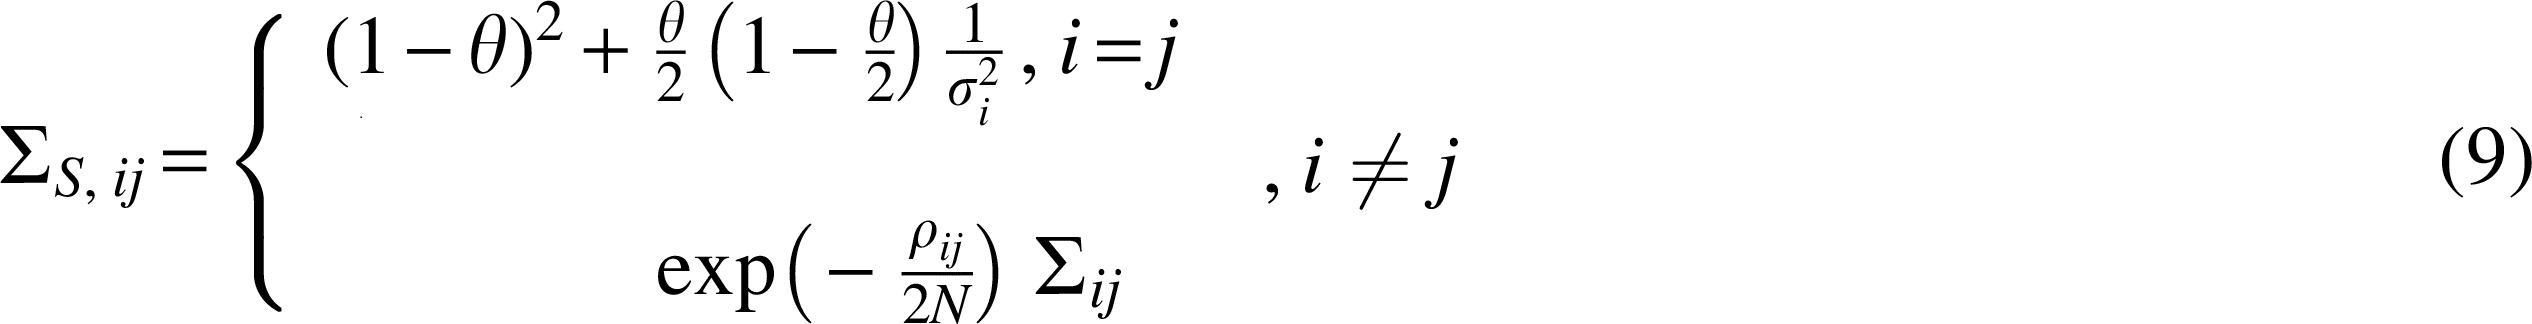
The effect of imputation on the rejection boundary. This figure shows rejection boundary with no imputation, with imputation (SSI), and variance reweighted imputation (SSI-VR) for an example containing two observed SNPs
Here
We now consider the effect of testing imputed SNPs in addition to the tag SNPs. The rejection regions for
Notice that, in the setting with imputation, the acceptance region
Thus, if
On the contrary, when
Thus assume we have three points, p1, p2, and p3 in Figure 1c, which are three different pairs of association statistics of observed SNPs
3.3. Simulation results
As shown in previous work on summary statistics (Lee et al., 2013), the marginal statistics at typed SNPs and untyped SNPs follow an MVN. With the assumption that none of the SNPs is significantly associated with train, the mean of the MVN is 0.
As in the previous simple case having three SNPs,
Thus having the joint distribution of the statistics s1, s2, and s3, we can compute the conditional distribution of the untyped SNP conditioned on the marginal statistics of the typed SNPs s1 and s2:
SSI estimates s3 using the mean of the above distribution
Now having
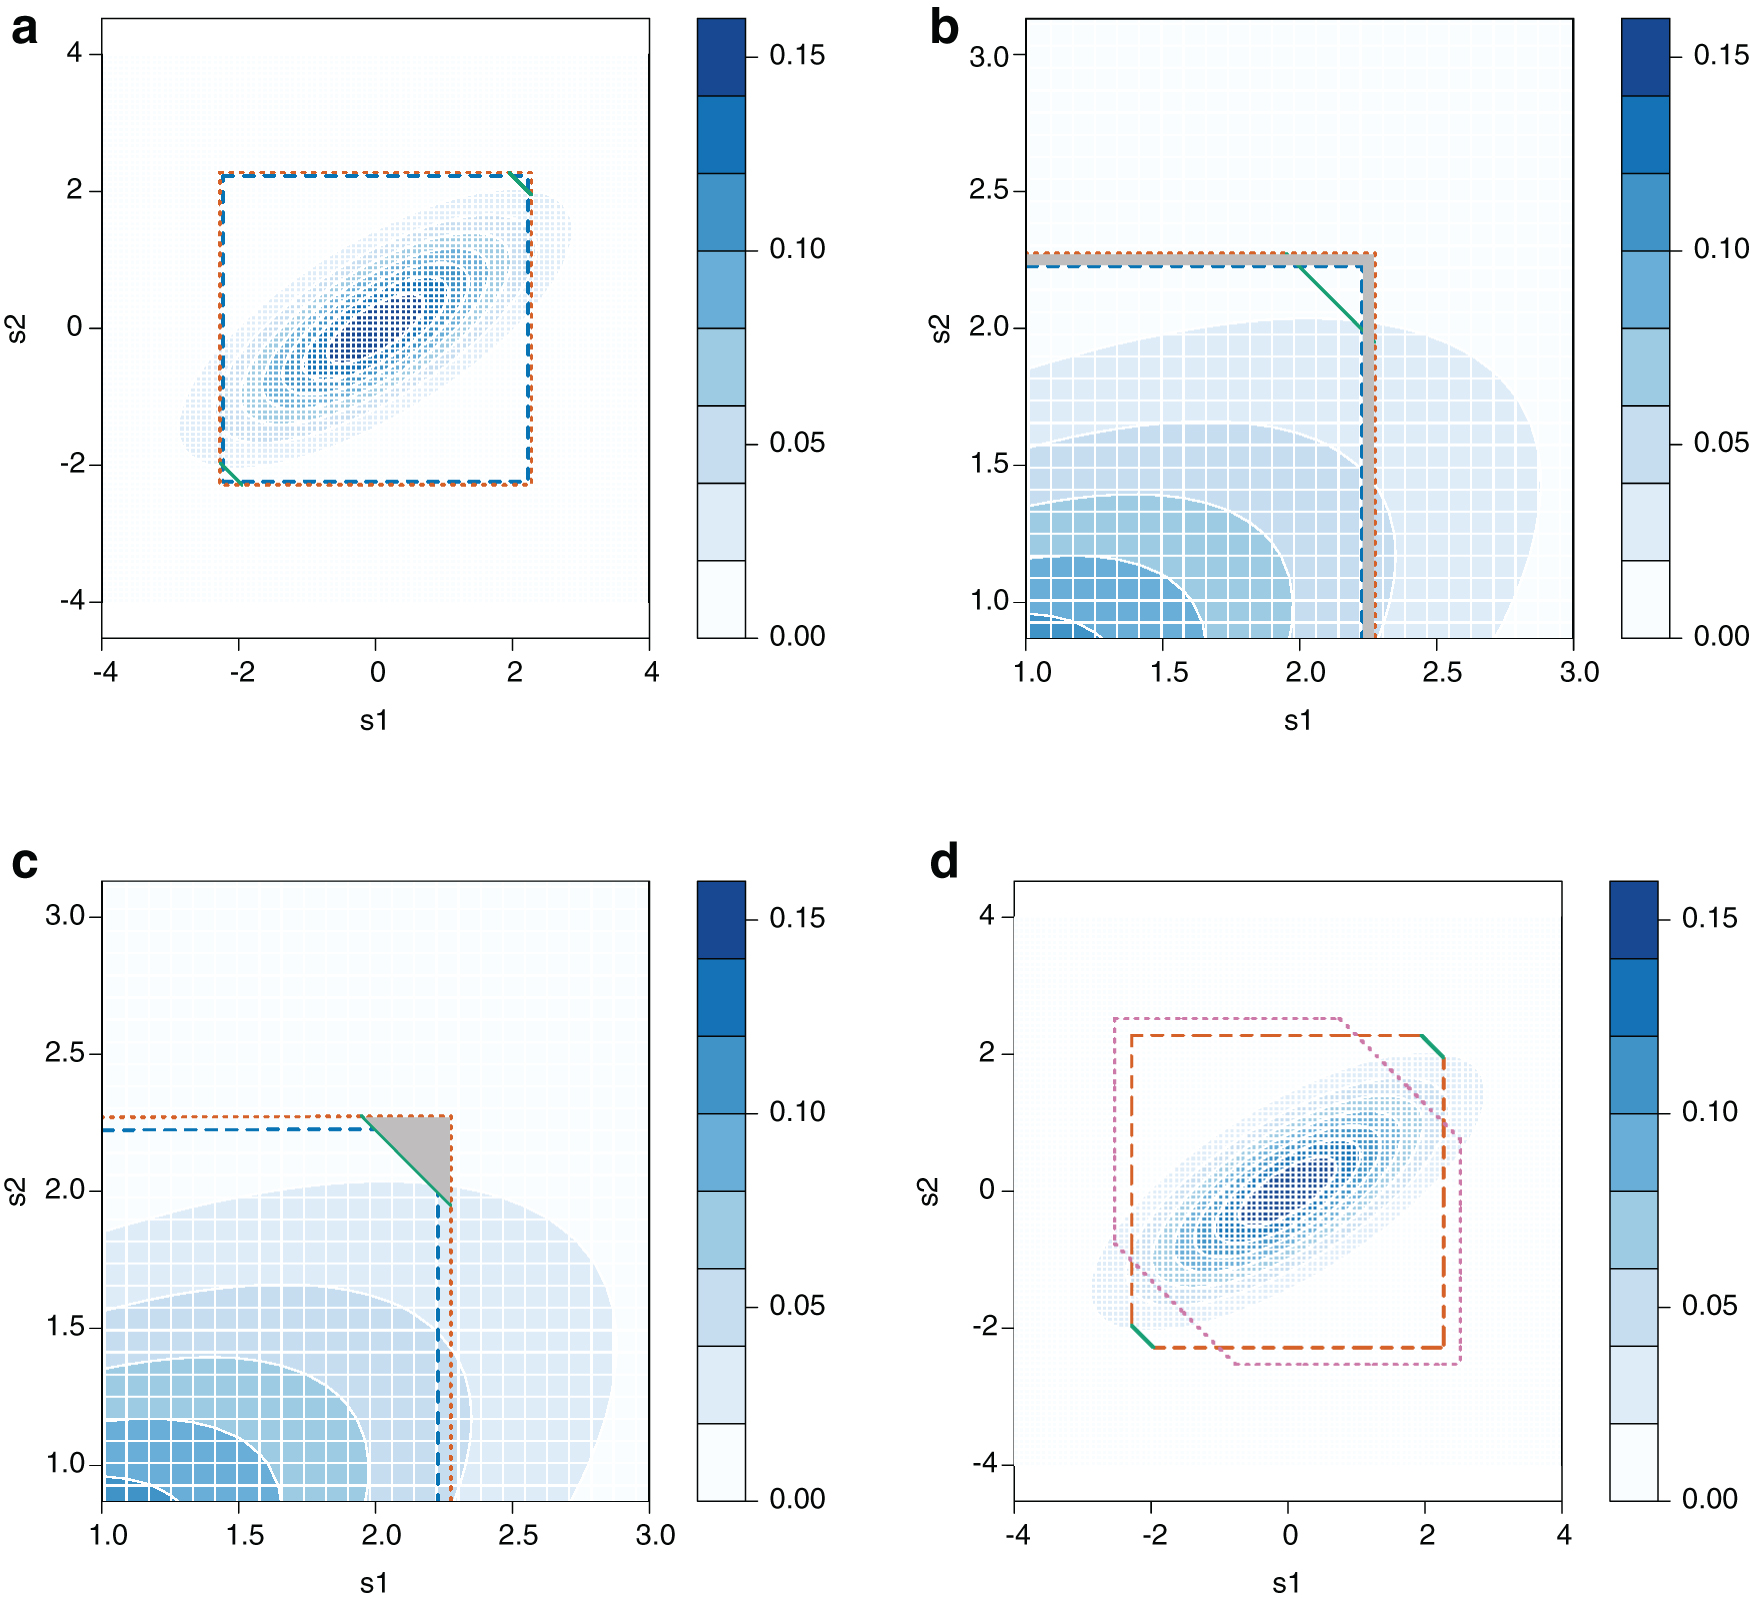
For each combination of
In all the combinations except the cases that the LD matrix is no longer positive definite, we find the power of no imputation, SSI, and SSI-VR (Fig. 2). In Figure 2a, we compared SSI versus no imputation, and we show that SSI always increases power when
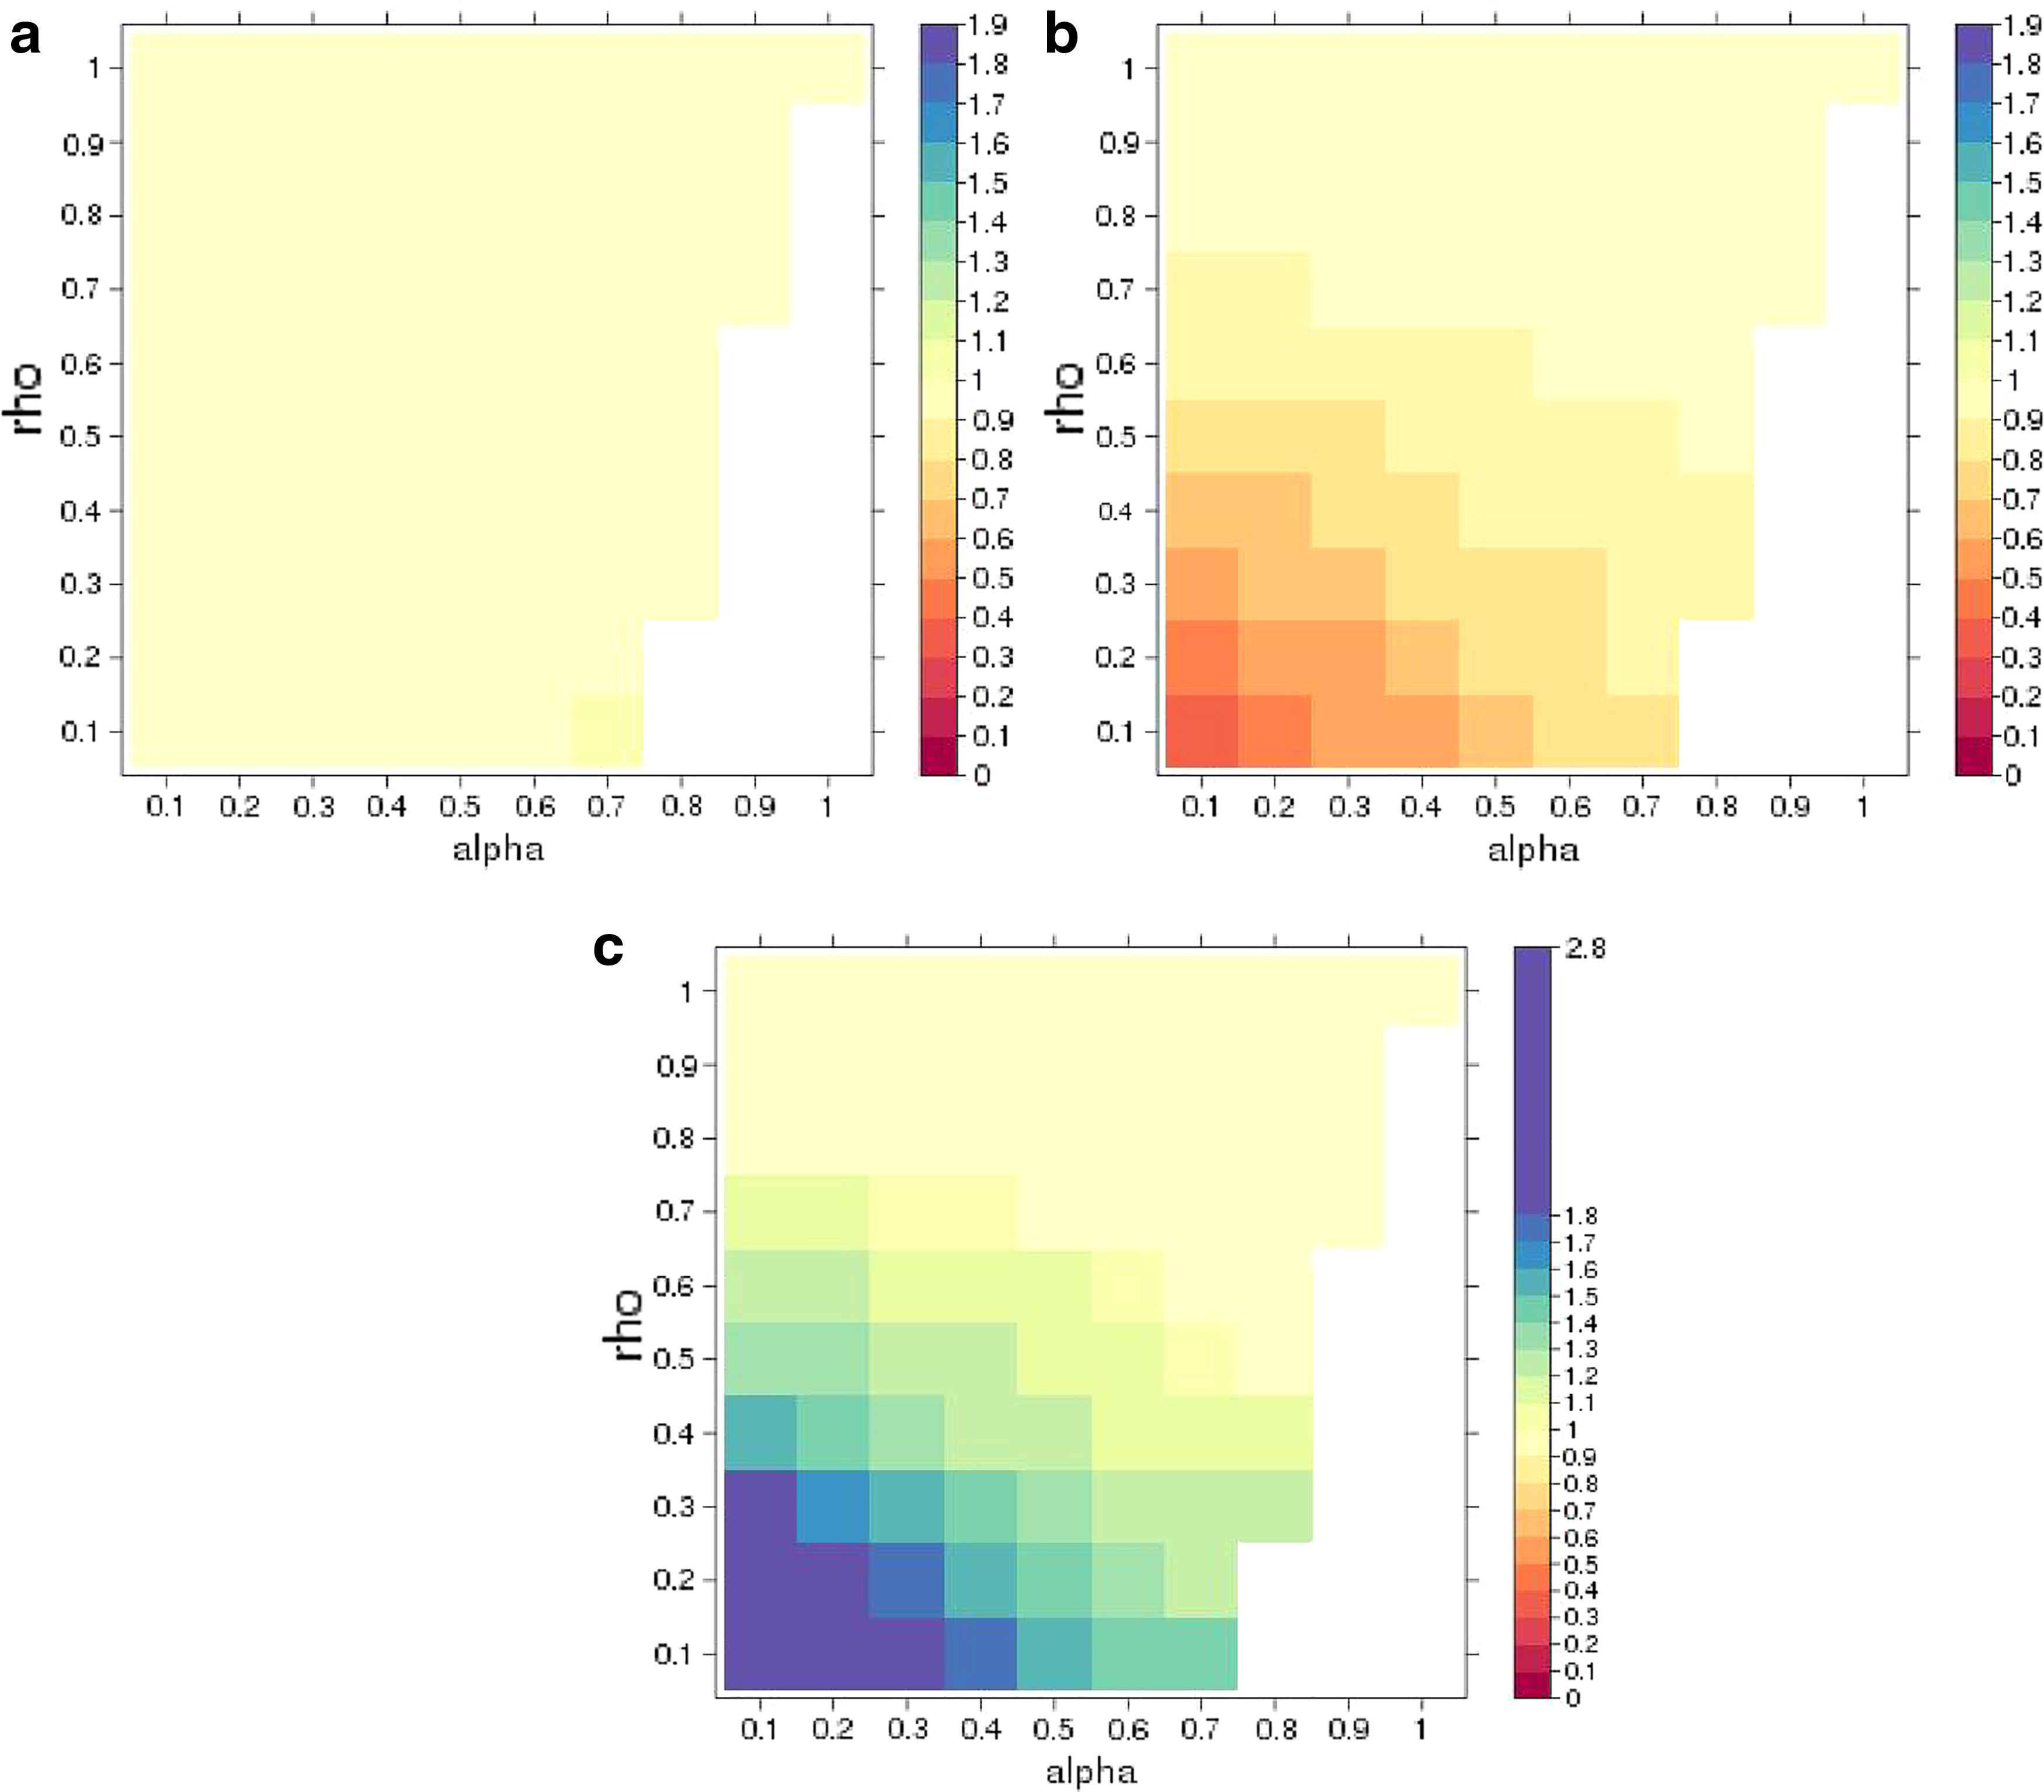
A comparison of the power of imputation (SSI) versus no imputation
Then, we compare imputation and imputation with variance reweighting in Figure 2c and we notice that SSI-VR will always cause power loss. and in the figure, the values of ratio are all larger than 1. For instance, when
3.4. SSI achieves better power compared with existing methods in NFBC
To assess the power of imputation and the effect of SSI-VR on imputation in a real data set, we simulated marginal statistics utilizing the NFBC data set.
We assume that every other SNP on chromosome 22 is missing. Thus, we observe half of SNPs on chromosome 22 and perform imputation on the rest. We find the per-SNP threshold for only observed SNPs (i.e., no imputation), for SSI and for SSI-VR with the constraint that FWER is controlled at 0.05. We sampled association statistics from the multivariate distribution on the observed SNPs from the genome. Then we used the sampled statistics to find the per-SNP significance threshold on the observed SNPs. We found the threshold to be 4.59705. Having this threshold, we then assume that there are causal SNPs in the genome, that is, the mean of statistics on these SNPs is not 0, and assess the power with no imputation. For no imputation, we found an average power of 0.4946.
For the imputation methods, SSI and SSI-VR, we impute the association statistics using the sample statistics. We impute in two ways, one utilizing the MVN of Equation (2), and the other one using the variance reweighting technique as Equation (3). Under the null, we found per-SNP thresholds for SSI and SSI-VR to be 4.5977 and 4.6891. We then assume that there are causal SNPs and used the thresholds to compute the power of each of the imputation methods. We found the average power to be 0.50124 for SSI and 0.4346 for SSI-VR. Notice that the threshold we found for no imputation, SSI, and SSI-VR is more accurate than Bonferroni correction and thus less conservative.
In Table 1, we also impute the most significantly associated SNPs reported in previous studies using SSI, SSI-VR, and a two-step imputation using IMPUTE2 to perform genotype imputation. We find the association statistics are similar across the three methods validating our theoretical results.
We Show That the Two Classes of Imputation Method, Summary Statistic Imputation and Two-Step Imputation, Have Similar Imputation Statistics on the Northern Finland Birth Cohort Data Set
We consider SNPs that were reported significant in a previous study (Sabatti et al., 2009). Then, we treat these SNPs as untyped and impute the marginal statistics using SSI, SSI-VR, and two-step imputation using IMPUTE2 to impute genotype of untyped SNPs.
Chr, chromosome; CRP, C-reactive protein; GLU, glutamate; HDL, high-density lipoprotein; LDL, low-density lipoprotein; SNPs, single-nucleotide polymorphisms; SSI, summary statistic imputation; TG, triglycerides.
4. Discussion
In this study, we have shown that the two broad classes of methods for imputating summary statistics in GWAS, two-step imputation and SSI, have identical asymptotic distributions. We also showed that a commonly used modification of SSI, variance reweighting, will cause power loss using simulation and real data. This leads us to conclude that SSI (with no variance re-weighting) is more powerful while retaining the computational efficiency of methods that rely on summary statistics alone. SSI assumes that statistics follow MVN: this assumption breaks down for small sample sizes and for rare SNPs. Compared with summary statistics, current HMM methods are likely to be more accurate for rare variation. A possible future direction is to improve accuracy on rare variants and small sample sizes.
Footnotes
Author Disclosure Statement
The authors declare they have no conflicting financial interests.
Funding Information
S. Sankararaman was supported in part by NIH grants RODGM111T44 and R35GM125055; NSF Grant III-1705121; an Alfred P. Sloan Research Fellowship; and a gift from Okawa Foundation.
References
Supplementary Material
Please find the following supplemental material available below.
For Open Access articles published under a Creative Commons License, all supplemental material carries the same license as the article it is associated with.
For non-Open Access articles published, all supplemental material carries a non-exclusive license, and permission requests for re-use of supplemental material or any part of supplemental material shall be sent directly to the copyright owner as specified in the copyright notice associated with the article.