
Abstract
Metabolic genes have been reported to act as crucial roles in tumor progression. Lung adenocarcinoma (LUAD) is one of the most common cancers worldwide. This study aimed to predict the potential mechanism and novel markers of metabolic signature in LUAD. The gene expression profiles and the clinical parameters were obtained from The Cancer Genome Atlas-Lung adenocarcinoma (TCGA-LUAD) and Gene Expression Omnibus data set (GSE72094). A total of 105 differentially expressed metabolic genes of intersect expression in TCGA-LUAD and GSE72094 were screened by R language. Univariate Cox regression model found 18 survival-related genes and then the least absolute shrinkage and selection operator model was successfully constructed. Six significant genes prognostic model was validated though independent prognosis analysis. The model revealed high values for prognostic biomarkers by time-dependent receiver operating characteristic (ROC) analysis, risk score, Heatmap, and nomogram. In addition, Gene Set Enrichment Analysis showed that multiplex metabolism pathways correlated with LUAD. Furthermore, we found the six genes aberrantly expressed in LUAD samples. Our study showed that metabolism pathways play important roles in LUAD progression. The six metabolic genes could predict potential prognostic and diagnostic biomarkers in LUAD.
1. INTRODUCTION
Lung cancer is a very common malignant tumor and one of the most serious threats to human health. Its mortality ranks first in global malignant tumors (Li et al., 2017; Brainard and Farver, 2019). Among them, nonsmall cell lung cancer (NSCLC) accounts for >80% of all lung cancer cases, and lung adenocarcinoma (LUAD) is the major subtype of NSCLC (Shi et al., 2016; Chen et al., 2019b). The epidemiological characteristics of lung cancer include high incidence, rapid growth, high mortality, and poor prognosis (Lee et al., 2018). Despite the continuous improvement of diagnosis and therapy methods in recent years, the prognosis of LUAD patients has not obviously improved, the overall survival is still worse (Pinto et al., 2019). Therefore, it is imperative to research the mechanism and identify powerful prognostic and diagnostic biomarkers of LUAD.
Metabolic pathways are necessary to maintain the homeostasis of normal cells, including glycolysis, fatty acid metabolism, tyrosine metabolism, nucleotide synthesis metabolism, etc. (Kreuzaler et al., 2019; Woolbright et al., 2019). Increased metabolism is a hallmark of tumor cells (El Hassouni et al., 2019). In the procedure of high metabolism, diverse metabolites are abnormally expressed, such as ROS, FAS, TKTL1, and GLUT1. (Furuta et al., 2010). These abnormal metabolites drive a series of physiological cascade reactions in tumor cells and promote the tumor progression (Drewa et al., 2006; Koumarianou et al., 2014; da Costa et al., 2018; Zhu et al., 2018; Meng et al., 2019). Because these could be detected in various stages of tumor tissues, metabolic genes were considered as suitable prognostic and diagnostic biomarkers of cancers (Marin-Rubio et al., 2019). Whereas the role of metabolic genes in LUAD is still an uncertainty.
The Cancer Genome Atlas (TCGA) and Gene Expression Omnibus (GEO) provide lots of tumor-related information, such as gene expression, methylation, mutation, and clinical parameters. (Bezzecchi et al., 2019). In this study, we initially screened differentially expressed metabolic genes, and then using least absolute shrinkage and selection operator (LASSO), we constructed a significant genes prognostic model. Furthermore, we verified that the model might predict poor overall survival by univariate Cox regression, receiver operating characteristic (ROC) curves, and risk score. In addition, Kyoto Encyclopedia of Genes and Genomes (KEGG) enriched pathways were shown by Gene Set Enrichment Analysis (GSEA). Finally, we compared the expression of the six genes in tumor tissue and normal tissue and validated whether the six genes could be independent factors in predicting prognosis. We aim to expound the relationship of metabolism pathways with LUAD and identified a novel prognostic biomarker for LUAD.
2. METHODS
2.1. TCGA and GEO data collection
We downloaded mRNA expression and clinical data from TCGA-LUAD (https://portal.gdc.cancer.gov/). A total of 535 lung adenocarcinoma (ADC) and 59 normal LUAD samples were obtained from TCGA for gene expression analysis and prognosis analysis. GEO data sets (GSE72094) including 442 LUAD samples were selected for the study. The data of TCGA or GEO samples were extracted, annotated, and normalized by “Strawberry Perl 5.30.”
2.2. Identification of differentially expressed metabolic genes
The file containing metabolic gene annotation codes was download in the GSEA platform (http://software.broadinstitute.org/gsea/downloads). A total of 946 metabolic genes were found from TCGA-LUAD samples. Using Limma package in R, 715 genes of intersect expression in TCGA and GSE72094 were selected. And then the batch effect was eliminated by “sva” packages in 3.6.1 version R language. Differentially expressed genes (DEGs) were screened through R package Limma. p Value <0.01 and |log2-fold change| > 1 were defined for DEGs. Heatmap and volcano were constructed through pheatmap package in R.
2.3. Construction and validation of the prognostic model
Using univariate Cox regression analysis, we acquired 18 genes that correlate between mRNA expression and patients' survival data in TCGA. The significant prognostic genes of p value <0.01 were filtered in LASSO penalized Cox regression analysis. After 1000 resamples by R glmnet package, the prognostic model was built. Univariate Cox regression and multiple Cox regression analyses were performed to validate whether the model could be an independent prognostic factor in GSE72094. Kaplan–Meier analyses were performed to demonstrate the association of significant genes with overall survival (OS) by R “Survival” and “survminer.” Time-dependent ROC analyses were performed in R “survivalROC” to validate gene signatures in TCGA and GSE72094 data sets. If not specifically mentioned, p value <0.05 was considered significant for survival analysis.
2.4. The nomogram prediction model
GES72094 was used for primary cohort and the TCGA-LUAD was used for validation cohort. According to the results of multiple Cox regression, nomogram was constructed by rms package and prognostic factors in R. The calibration plot and concordance index (C-index) analysis were performed to validate the nomogram.
2.5. Gene set enrichment analysis
We used GSEA_4.0.2 to identify the enriched KEGG pathways of the model genes in TCGA-LUAD and GSE72094. Representative pathways were revealed in the graph by R language.
2.6. Gene expression in TCGA-LUAD
Scatter plots were built to show gene levels between tumor and adjacent normal tissue by R “beeswarm.” Paired difference analyses and box-plot were utilized for further verifying the expression relationship. External data from Oncomine (https://www.oncomine.org/resource/main.html) and Human Protein Atlas (www.proteinatlas.org) database were used to examine our results.
3. RESULTS
3.1. Identification of survival-related differentially expressed metabolic genes
A total 946 metabolic genes were found from 535 ADC and 59 normal LUAD samples in the TCGA-LUAD cohort. And then, 715 genes of intersect expression in TCGA-LUAD and GSE72094 were selected. p Value <0.01 and |log2-fold change| > 1 were defined for screening DEGs. Volcano plot was constructed to reveal the 105 significant differentially expressed genes (Fig. 1A) and Heatmap was performed to show the hierarchical clustering analysis of the gene signatures (Fig. 1B). In total, 522 cases from TCGA-LUAD and 442 cases from GSE72094 were extracted for prognosis analysis. Parameters of missing data and survival time <30 days were removed from the cases. Univariate Cox regression analysis dug out 18 survival-related genes in TCGA-LUAD (Fig. 1C, p value <0.01).
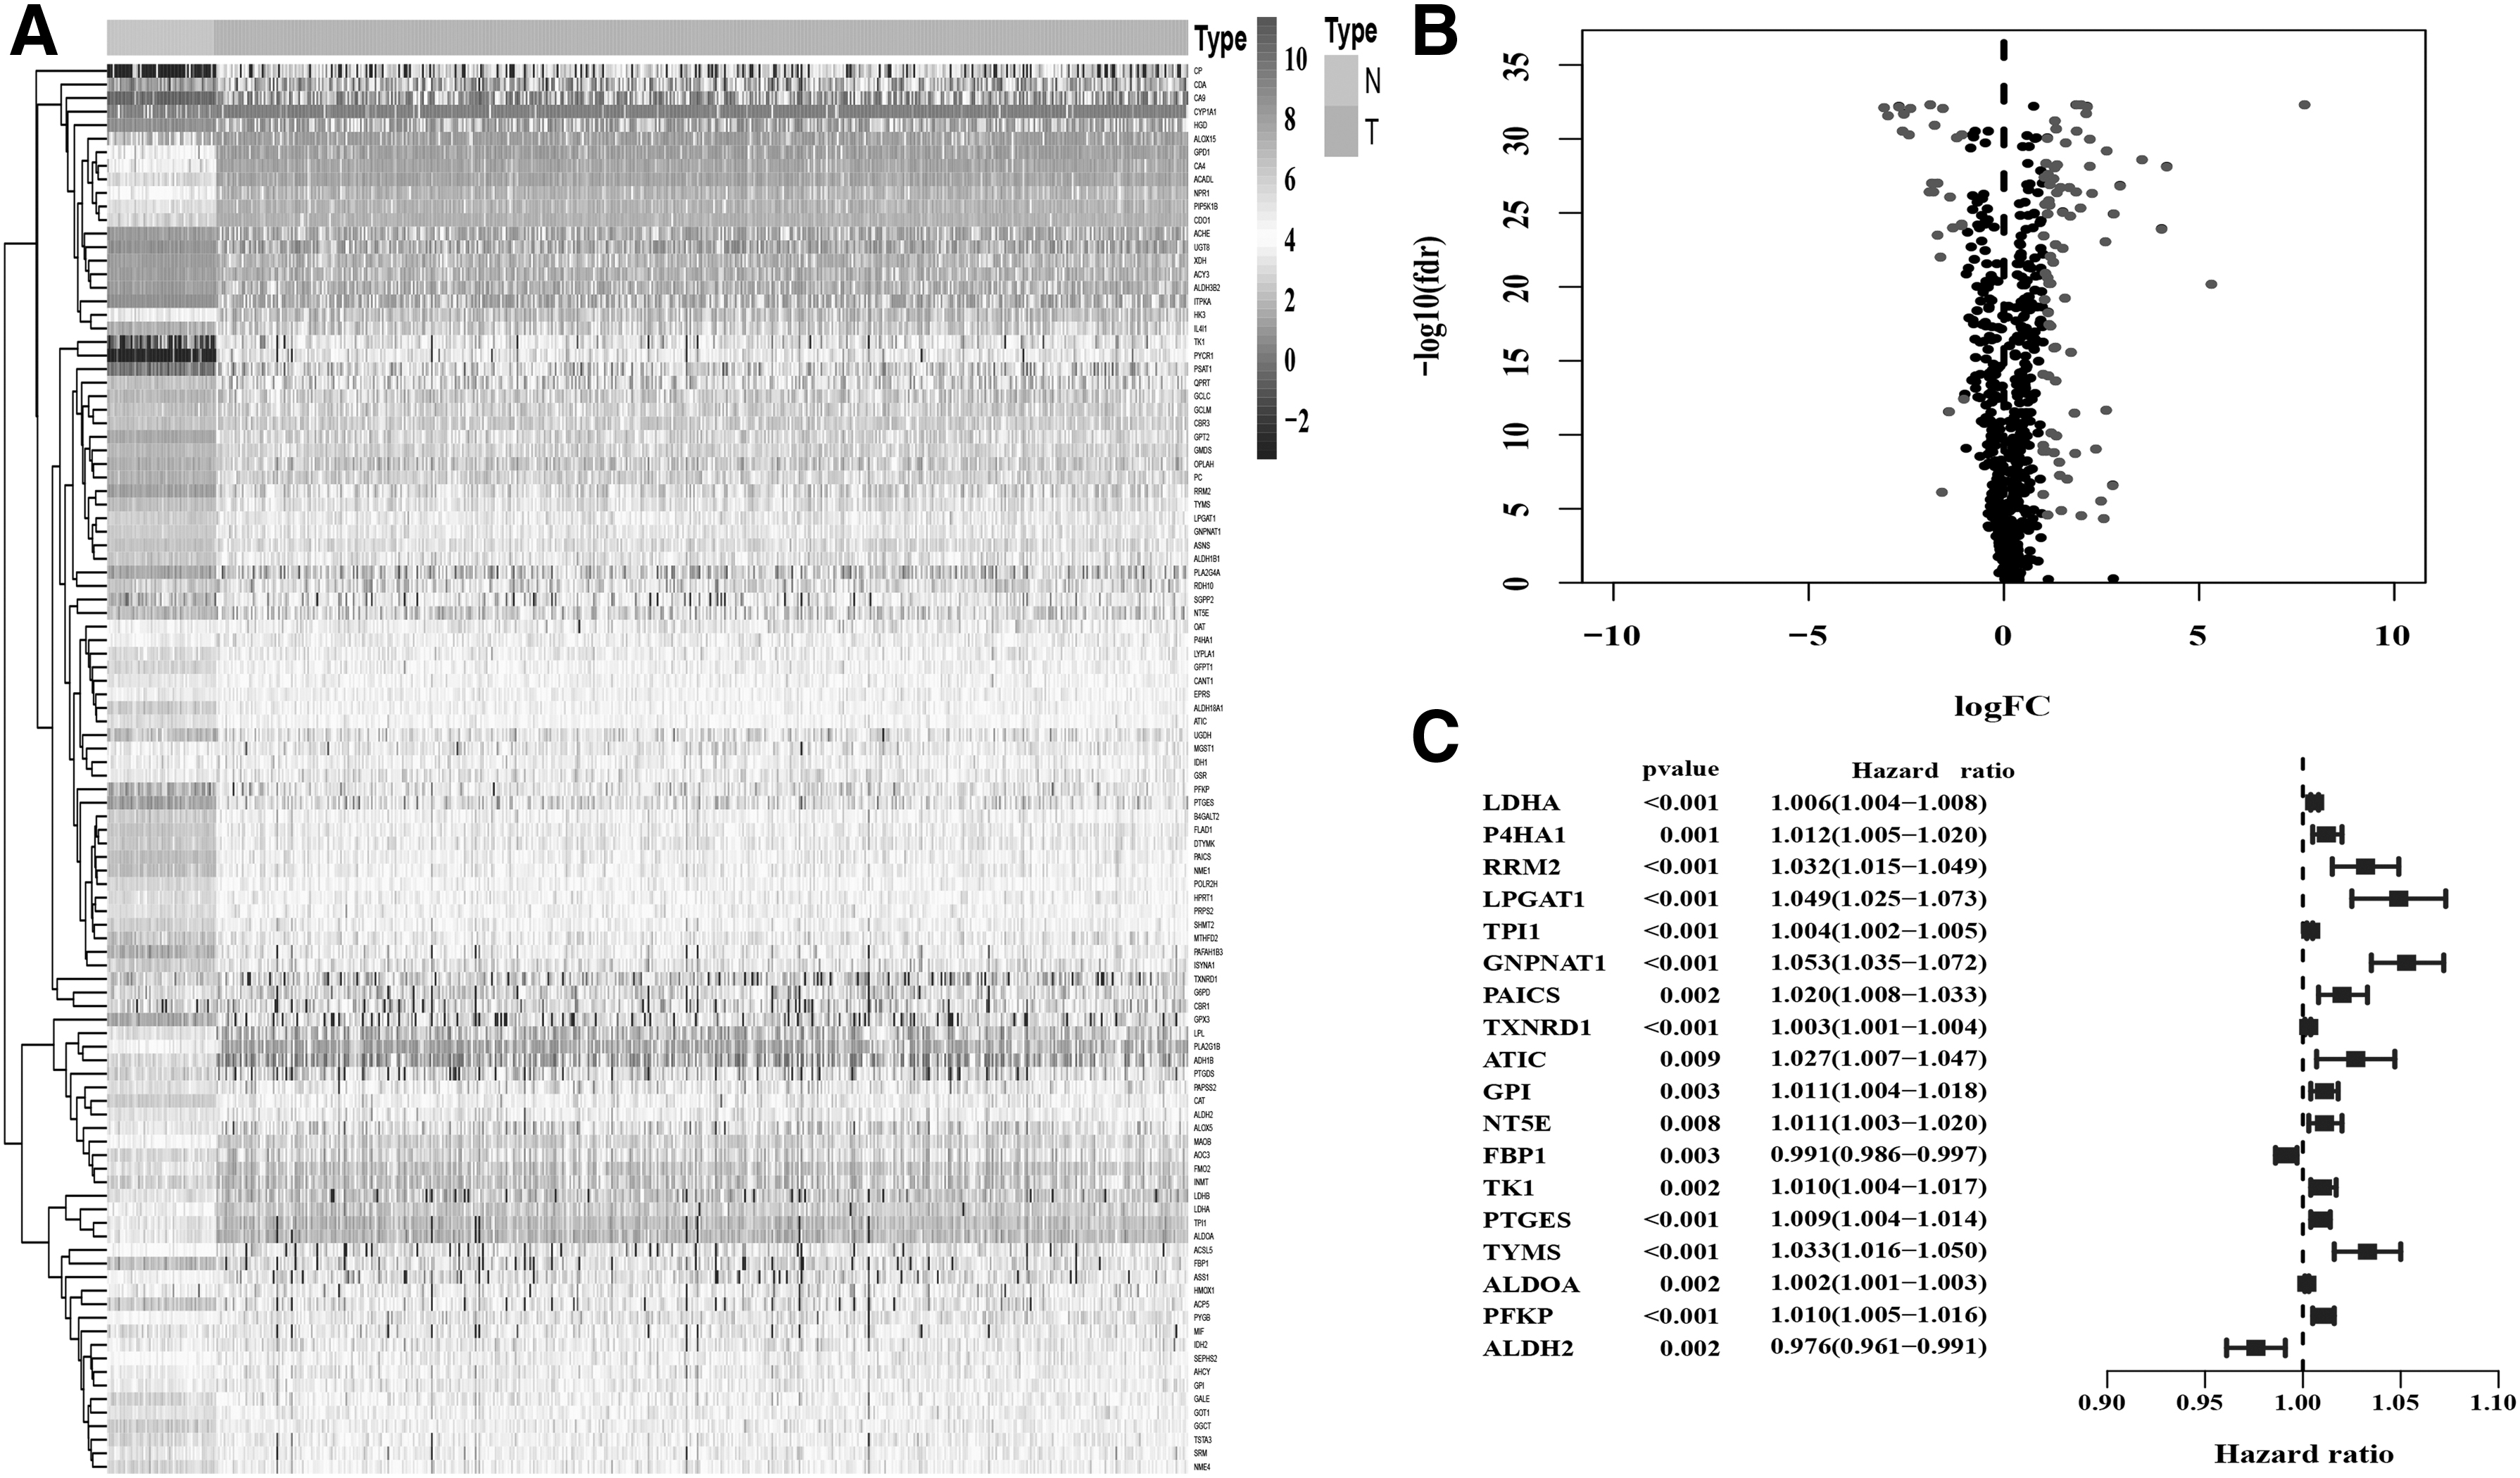
Survival-related differentially expressed metabolic genes.
3.2. Construction and validation of the prognostic model
The 18 metabolic gene signatures were filtered into LASSO penalized Cox regression analysis, after 1000 resamples, a six-gene prognostic model was constructed. The model contained six genes as follows: lactate dehydrogenase A (LDHA), lysophosphatidylglycerol acyltransferase 1 (LPGAT1), glucosamine-phosphate N-acetyltransferase 1 (GNPNAT1), prostaglandin E synthase (PTGES), thymidylate synthetase (TYMS), and aldehyde dehydrogenase 2 family member (ALDH2). The risk score = (0.00312612684709971 × the expression level of LDHA) + (0.00476085842822368 × the expression level of LPGAT1) + (0.0205522625269787 × the expression level of GNPNAT1) + (0.000101832048720509 × the expression level of PTGES) + (0.00831672554817241 × the expression level of TYMS) + (−4.27270512109639e-05 × the expression level of ALDH2). We classified the TCGA-LUAD and GSE72094 samples into high-risk and low-risk groups according to the median risk score.
Kaplan–Meier analyses were performed to demonstrate the high-risk group predicted poor overall survival (Fig. 2A, E). Univariate Cox analysis and multiple Cox regression analysis verified whether the model could be independent progress factors (Table 1). Time-dependent ROC analyses were performed to validate the gene signatures. The area under the ROC curve (AUC) for the model was 0.749 and 0.655 in TCGA and GEO data sets, respectively. Compared with other parameters such as age, sex, etc., the model of the gene signatures showed a better predictive value (Fig. 2B, F). Risk score distribution showed higher mortality in the high-risk group than in the low-risk group (Fig. 2C, G). The expression of the six gene signatures was presented by Heatmaps. LDHA, LPGAT1, GNPNAT1, PTGES, and TYMS showed positive correlation with high-risk set and ALDH2 revealed an opposite role (Fig. 2D, H). p Value <0.05 was considered statistically significant.

Kaplan–Meier analysis, time-dependent ROC analysis and risk score analysis for prognostic model in TCGA-LUAD and GSE72094.
Contribution of Various Potential Prognostic Factors to Survival by Univariate Cox Regression and Multiple Cox Regression
p < 0.05 was considered significant.
HR, hazard ratio; TCGA-LUAD, The Cancer Genome Atlas-Lung Adenocarcinoma.
3.3. The nomogram prediction model
Multivariate analysis showed that gender, stage, and the prognostic model were independent factors of OS in GSE72094. According to the Cox regression, nomogram was built to predict prognostics in LUAD (Fig. 3A). The C-index was 0.689 in the GSE72094 cohort, and 0.706 in the validation cohort (TCGA-LUAD). The calibration plots showed the nomogram could be well predicted for OS, especially in 1- and 2-year overall survival (Fig. 3B, C).

Construction and validation of the nomogram prediction model.
3.4. Gene set enrichment analysis
We identified the enriched KEGG pathways of the model genes in TCGA-LUAD and GSE72094. Most of the enriched pathways focused on metabolism-related pathways, such as, arachidonic acid metabolism, pyrimidine metabolism, cysteine and methionine metabolism, glyoxylate and dicarboxylate metabolism, and riboflavin metabolism. The results also contained several famous cancer-related pathways, such as cell cycle, p53 signal pathway, and basal transcription factors. Figure 4 showed some representative pathways. Related parameters for the pathways are given in Table 2. The results further elucidated the role of metabolism mechanism in LUAD.
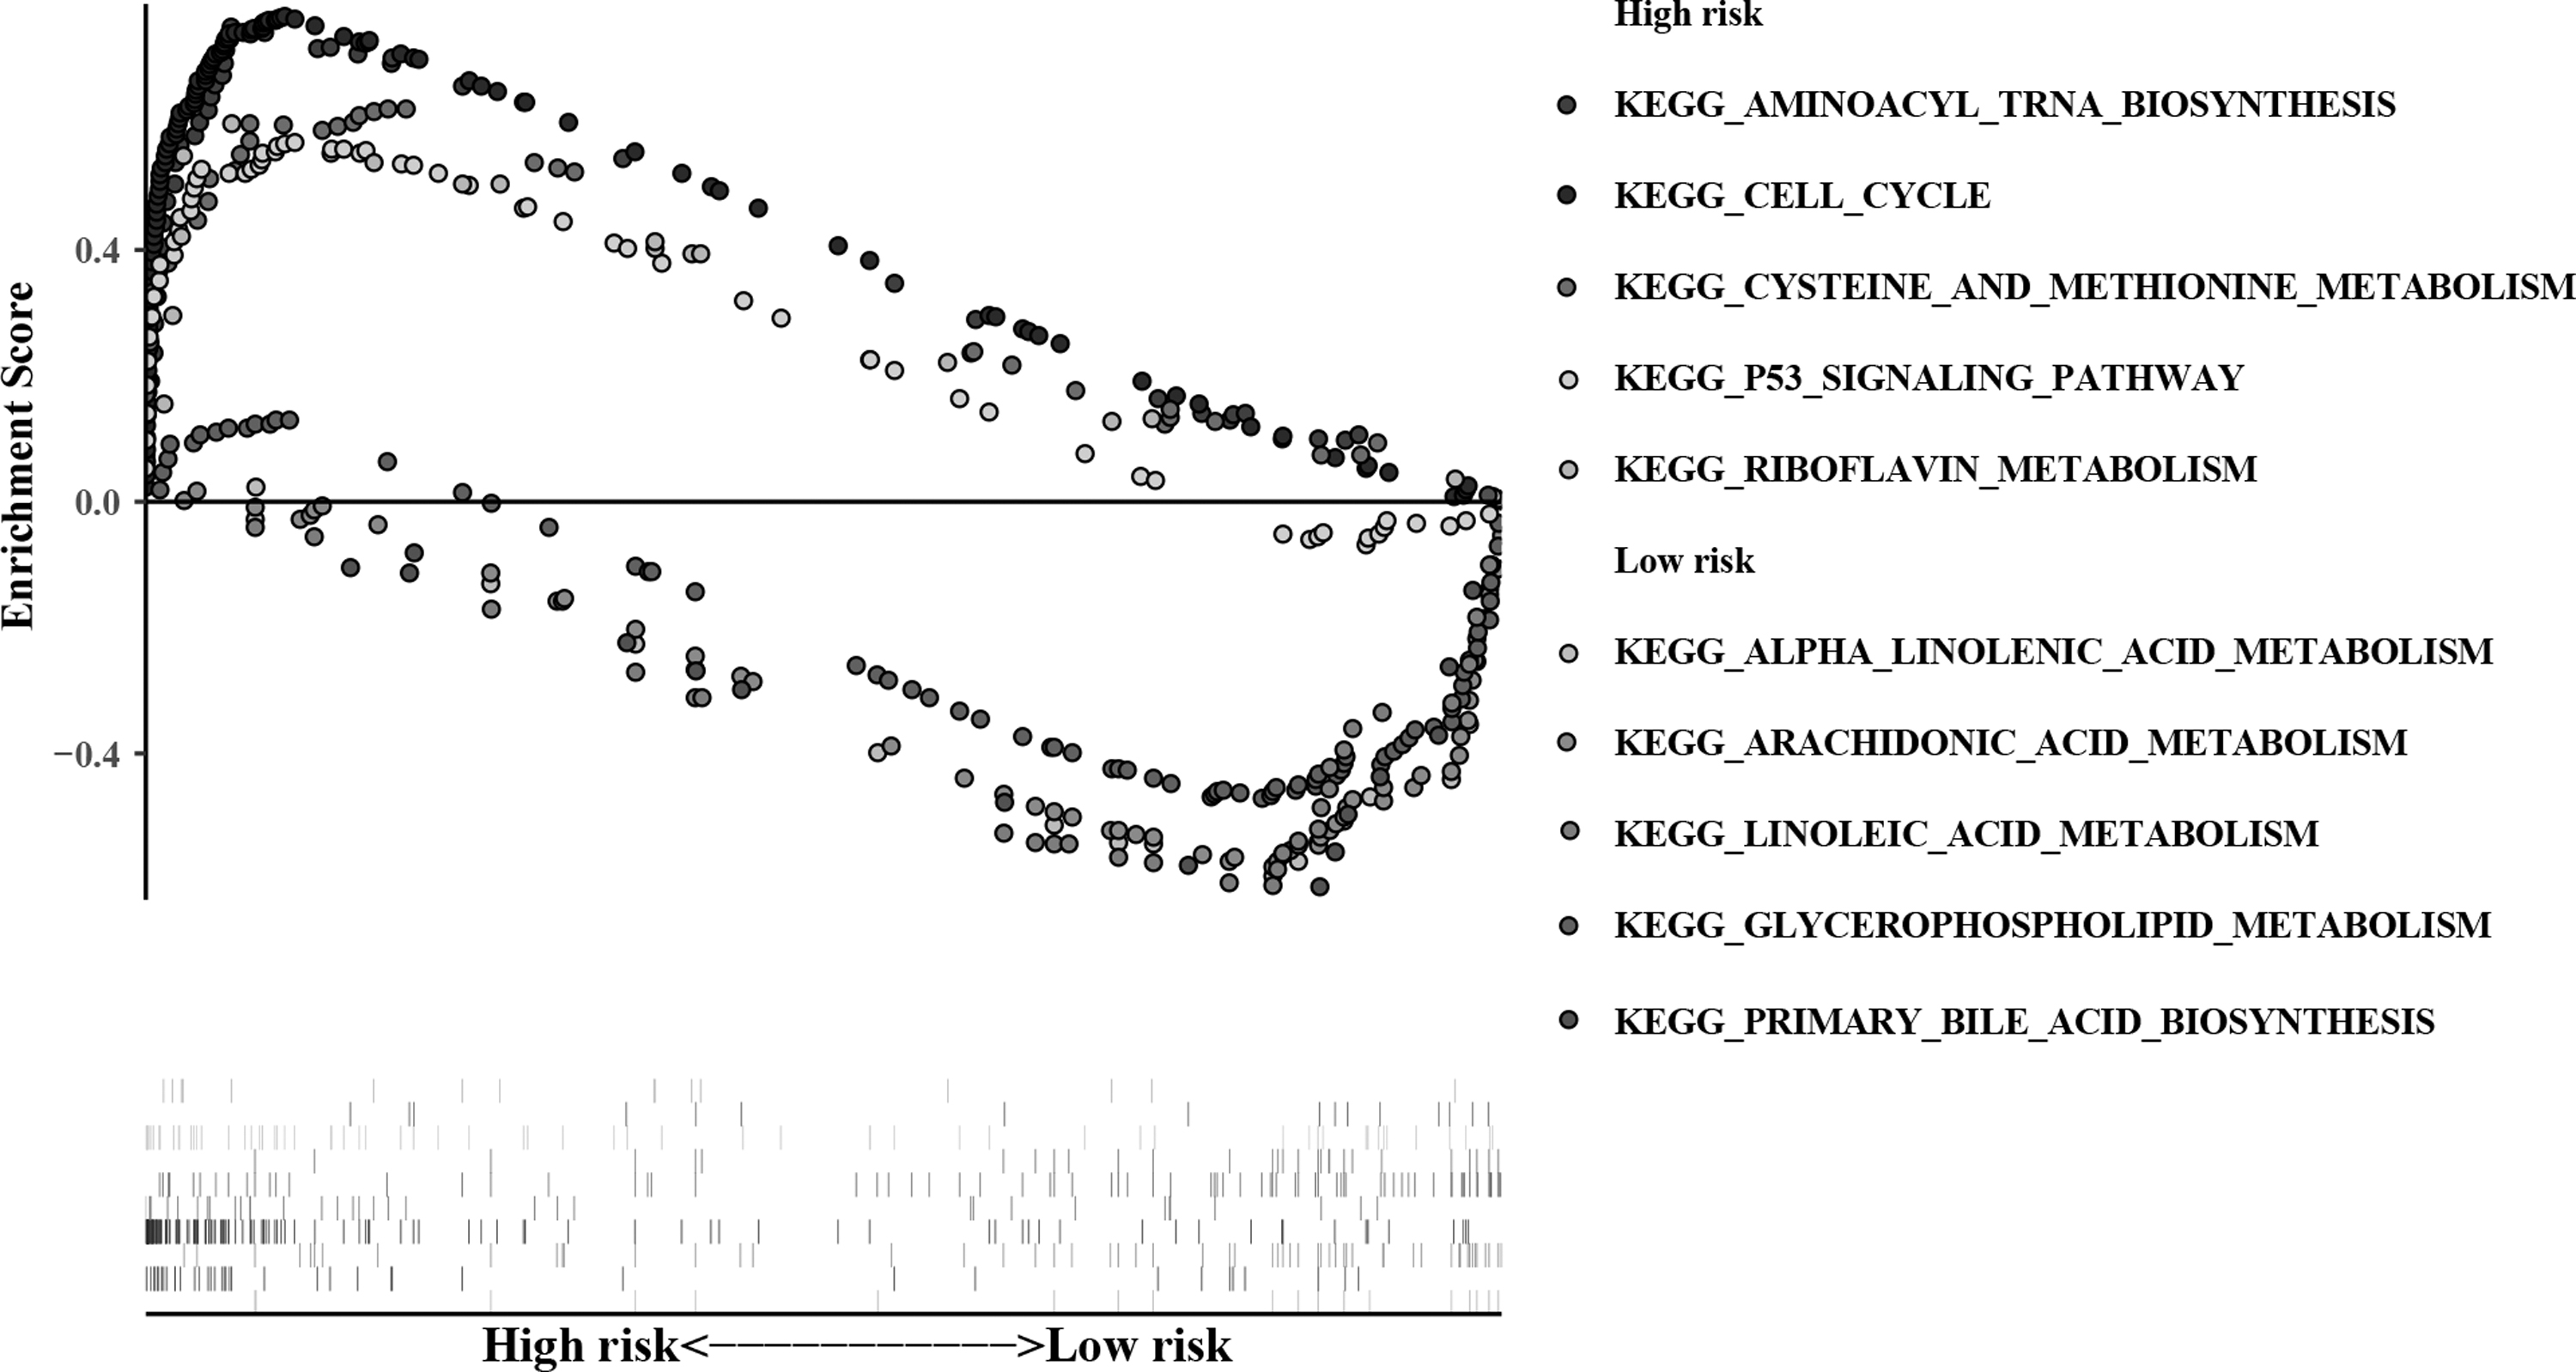
Ten representative enriched KEGG pathways by GESA. Each group contains five KEGG pathways. Related parameters for the pathways are given in Table 2. GESA, gene set enrichment analysis; KEGG, Kyoto Encyclopedia of Genes and Genomes.
Related Parameters of the Representative Kyoto Encyclopedia of Genes and Genomes Pathways in Figure 4
ES, enrichment score; FDR-q, false discovery rate-q value; NES, normalized enrichment score.
3.5. Gene expression in TCGA-LUAD
As in the scatter plots and paired difference plots shown, the levels of LDHA, LPGAT1, GNPNAT1, PTGES, and TYMS were upregulated in TCGA-LUAD tissues compared with the adjacent normal tissues. ALDH2 expression level was downregulated in tumor tissues (Fig. 5A, B). According to tumor stage, we divided the tumor tissues into two groups. LDHA, LPGAT1, GNPNAT1, and TYMS were overexpressed in stage III + IV groups and ALDH2 was upregulated in stage I + II groups (Fig. 5C). External data from Oncomine database showed a consistent result with the TCGA cohort (Fig. 6A). Using the human protein profiles database, we observed the tumor samples could be deeply staining by LDHA, LPGAT1, GNPNAT1, PTGES, or TYMS antibodies and lightly stained by ALDH2 antibody. Unfortunately, in the database, we did not find any standard normal lung tissue stained by the six genes.

Gene expression in TCGA-LUAD.

External data from Oncomine database showing a consistent result with TCGA cohort.
4. DISCUSSION
LUAD progression is associated with alterations in assorted oncogenes and tumor suppressors (Samy et al., 2016; Kleczko et al., 2019). Despite diagnosis and treatment of LUAD significantly improved, the prognosis was still not optimistic (Abe et al., 2019). Recent researches showed that metabolic pathways play an important role in regulating tumor progression (Lacroix et al., 2019; Phan et al., 2019). The survival and proliferation of cancer cells are dependent on metabolic reprogram (Hoxhaj and Manning, 2019). Quantity studies reported the possibility of metabolic pathways as targeted therapy for tumors. Abdel-Wahab et al. reported that targeting glucose metabolism might be a novel approach to suppress cancer progression (Abdel-Wahab et al., 2019; Agrawal, 2019). However, the underlying mechanism of metabolism in LUAD has not been completely elucidated, hampering targeted therapy of LUAD (Relli et al., 2019). Thus, the priorities of LUAD research are very urgent to discover the novel molecular markers associated with the prognosis of LUAD.
In this study, using LASSO analysis, we delineated six metabolic genes prognostic model in TCGA-LUAD and GSE72094 data sets. Kaplan–Meier analyses demonstrated the model could predict poor overall survival. Univariate Cox analysis and multiple Cox regression analysis verified whether the model could be independent progress factors. The AUC dimension and risk score distribution of gene signature showed a high prognostic value in predict OS. The nomogram C-index was 0.689 in the GSE72094 cohort, and 0.706 in the TCGA-LUAD cohort. As shown in calibration plots, the nomogram could be well predicted for OS, especially in 1- and 2-year survival. Many of the enriched pathways focused on metabolism-related pathways. In addition to metabolic pathways, the high-risk groups showed several cancer-related pathways, such as cell cycle and p53 signal. The results showed the gene signature closely correlated with metabolic pathways and prompted the potential role of metabolic pathways in LUAD. In addition, LDHA, LPGAT1, GNPNAT1, PTGES, and TYMS upregulated in tumor tissues compared with adjacent normal tissues, whereas ALDH2 revealed an opposite role.
Previous studies showed that the great majority of the six genes closely related to tumor progression. LDHA has been reported to correlate with the metabolism pathway of pyruvate and citric acid (TCA) cycle (Mishra and Banerjee, 2019). Numerous researches revealed the aberrantly upregulated LDHA in multiple malignant tumors (Miao et al., 2013). Hou et al. (2019) reported upregulated LDHA promoted glycolysis and accelerated proliferation and invasion in LUAD cells. In light of the harmful effect in tumor progression, LDHA inhibitors and target drugs are intensively developed (Feng et al., 2018). PTGES was shown to associate with the pathways of prostaglandin 2 biosynthesis and metabolism and arachidonic acid metabolism (Ramanan and Doble, 2017). As a cancer promoting factor, PTGES involved in the regulation of multiple tumor procession, such as lung cancer, colon cancer, and breast cancer (Filipenko et al., 2016; Tafakh et al., 2018; Wang et al., 2019). Wang et al. (2019) reported that PTGES was prevented from proteasome-directed degradation through interaction with USP9X, and the dysregulated PTGES promoted cell migration and metastasis in NSCLC. TYMS could catalyze the methylation of deoxyuridylate to deoxythymidylate and regulate DNA replication and repair (Varghese et al., 2019). Recent studies showed the potential role of TYMS in cancer chemotherapy, for example, modulating 5-FU (5-fluorouracil) resistance in colon cancer cells (Chen et al., 2019c).
Chamizo et al. (2015) suggested that upregulated TYMS associated with reduced response to pemetrexed-containing chemotherapy in advanced NSCLC patients. As a non-cytochrome P450 mitochondrial aldehyde oxidizing enzyme, ALDH2 participated in regulating alcohol metabolism and pyruvate metabolism (Chen et al., 2019a). As a tumor suppressor, ALDH2 depletion predicted poor prognosis in diverse tumors, such as lung cancer, liver cancer, gastric cancer, and breast cancer (Li et al., 2016). One research reported depletion of ALDH2 enhanced the sensitivity of NSCLC cells to Taxol (Wang et al., 2018). Compared with the mentioned four genes, there are relatively few reports of LPGAT1 and GNPNAT1, especially in cancer research. LPGAT1 is an activator in reacylation of lysophosphatidylglycerol and modulates the biosynthesis of glycerophospholipid (Yang et al., 2004). MicroRNA-30c could protect the liver from steatosis through repressing LPGAT1 (Vickers and Moore, 2013). So far, there have been no particular reports about LPGAT1 on pulmonary tumors. GNPNAT1, also named GNA1, correlated the pathway of synthesis of substrates in N-glycan biosythesis (Boehmelt et al., 2000). Decreased GNPNAT1 promoted cells proliferation and invasion in castration-resistant prostate cancer (Kaushik et al., 2016). Zhao et al. (2017) reported downregulation of GNPNAT1-induced A549 cells proliferative delay and cell adhesion defect. The gene signatures are important members of the metabolic pathways, and could act as therapeutic target in cancers.
5. CONCLUSIONS
Metabolism pathways play important roles in LUAD progression. The six metabolic genes could be potential biomarkers to predict prognosis and diagnosis of LUAD. However, the precise role of metabolism pathways and the six genes in LUAD progression remain poorly understood. Further researches must be conducted to expound the explicit role of the gene signature, specifically the two less studied genes, LPGAT1 and GNPNAT1.
Footnotes
AUTHOR DISCLOSURE STATEMENT
The authors declare they have no competing financial interests.
FUNDING INFORMATION
The authors received no funding for this article.