




Abstract
Advances in systems biology have made clear the importance of network models for capturing knowledge about complex relationships in gene regulation, metabolism, and cellular signaling. A common approach to uncovering biological networks involves performing perturbations on elements of the network, such as gene knockdown experiments, and measuring how the perturbation affects some reporter of the process under study. In this article, we develop context-specific nested effects models (CSNEMs), an approach to inferring such networks that generalizes nested effects models (NEMs). The main contribution of this work is that CSNEMs explicitly model the participation of a gene in multiple contexts, meaning that a gene can appear in multiple places in the network. Biologically, the representation of regulators in multiple contexts may indicate that these regulators have distinct roles in different cellular compartments or cell cycle phases. We present an evaluation of the method on simulated data as well as on data from a study of the sodium chloride stress response in Saccharomyces cerevisiae.
1. Introduction
Cellular processes such as gene regulation, metabolism, and signaling form complex interplay of molecular interactions. A primary means of uncovering the details of these processes is through the analysis of measured responses of cells to perturbation experiments. We present context-specific nested effects models (CSNEMs), which are graphical models for analyzing screens of high-dimensional phenotypes from gene perturbations. In this setting, the perturbation consists of knocking out, knocking down, or otherwise disabling the activity of a gene, via the use of deletion mutants, RNA interference, CRISPR/Cas9, or other techniques. The high-dimensional phenotype may be a transcriptomic, proteomic, metabolomic, or similar multidimensional profile of measurements. Such profiles provide indirect information about the pathways that connect the gene that is perturbed in an experiment to the effects observed in a phenotype. This poses a challenge for determining functional relationships since the precise mechanisms by which the perturbation relates to the phenotype must be inferred using computational and statistical methods, expert knowledge, or a combination of both.
Related work on inferring networks from gene expression data includes methods based on statistical dependencies between expression measurements (Friedman et al., 2000; Irrthum et al., 2010), which are used to construct networks of probable interactions between the genes measured in the expression profile. Other work on using phenotypic data uses clustering of phenotypic profiles, or the similarity between profiles, to construct networks among the perturbation genes (Piano et al., 2002; Ohya et al., 2005). The rationale behind these approaches is that genes that produce similar phenotypes when perturbed are likely to be functionally related (Markowetz and Spang, 2007).
The CSNEM approach is a generalization of the nested effects model (NEM) (Markowetz et al., 2005). In the NEM approach, a network structure among the perturbed elements of the cell is inferred from the nested structure of phenotypic profiles. The general idea is that perturbation of a gene that is further upstream in a signaling pathway would affect more elements than perturbation of a gene further downstream. For example, Figure 1A shows an NEM in which Hog1 is upstream of Cka2. The table underneath the graph represents the differential expressions of the high-dimensional phenotypes observed in the screen, with rows corresponding to single-gene knockouts and each column corresponding to an effect: one dimension of a phenotype, such as a particular transcript in a transcriptomic phenotype. In the table of effect measurements in the figure, a “1” indicates that a perturbation changed the response of the effect, and a “0” indicates that it did not. The deletion of Hog1 would affect e1, e2, e3, and e4 because they are all downstream of it. The deletion of Cka2, however, would only affect e3 and e4. Therefore, the nesting of the effects of the deletion of Cka2 within the effects of the deletion of Hog1 places the former downstream of the latter.

Such nesting of effects, however, does not always occur. The protein product of a gene may interact with those of other genes in a multitude of ways, and one might imagine a situation where two genes are interacting with each other upstream of a subset of the effects, but additionally have other roles independent of each other. This is the case in Figure 1B, where upstream of effects e1, e2, e3, and e4 Cka2 and Hog1 interacts as before, but Cka2 additionally affects e5 and e6 independent of Hog1. In such a case, we see that the phenotype induced by the perturbations of each gene includes effects downstream of the common pathway, but each perturbation also shows unique effects, and rather than being nested, the effects show a partial intersection. The example in Figure 1 is based on a pattern we identified in our application of CSNEM learning to experiments studying sodium chloride (NaCl) stress response in Saccharomyces cerevisiae.
In the CSNEM approach, we address this issue by explicitly considering the possibility that one gene may have multiple contexts of interaction. The model can be equivalently viewed either as a single graph model, where multiple nodes may represent multiple roles of the same gene, or as a mixture of multiple NEMs, where each NEM describes a different subset of the effects. Notably, mixtures of NEMs have been used for analyzing single-cell expression data (Siebourg-Polster et al., 2015). In that work, the mixture is used to account for variation of gene activation states across different cells.
In contrast, in a CSNEM, the mixture represents different patterns of interaction among the same sets of genes across different subsets of the measured effects. The effect pattern in Figure 1B can alternatively be accounted for by the introduction of a hidden node downstream of both Hog1 and Cka2, an approach explored by Sadeh et al. (2013), where they introduce a statistical test to infer a partially resolved NEM. In fact, Sadeh et al. showed that the presence of a hidden node downstream of a pair of genes is consistent with every possible configuration of effect responses. Their method aims to characterize all possible NEM models that are consistent with the data, and as a result, it never rejects the possibility of a hidden node existing downstream of any pair of genes. In contrast, in our approach, we aim to find a single parsimonious network model that optimally fits the data. We show how to cast the problem of learning a CSNEM as a modified version of NEM learning, evaluate the ability of this approach to recover a ground-truth network on simulated data, and present an application to the salt stress pathway in yeast.
2. Background: Nested Effects Models
Tresch and Markowetz (2008) formulated NEMs as a special case of effects models. In an effects model, there is a set of actions
Let
The NEM is interpreted as follows: action a causes a response in effect e if and only if either e is attached directly to a, or there is a directed path in G from a to the action to which e is attached. Mathematically, this can be formulated in terms of matrix multiplication. Since what matters is which actions are reachable from other actions in G, we can work with

2.1. Likelihood computation
The problem of inferring an NEM from a data set D can be viewed as that of maximizing a likelihood. In this section, we review how the likelihood of an NEM is framed to illustrate how the likelihood of a CSNEM relates to it.
Supposing that we have some data consisting of measurements of the observable effects subjected to each action included in the model, and assuming data independence, for a general effects model, the log-likelihood of the model is
where
Let
where
Computationally, maximizing this expression is difficult because it is a search over a discrete but exponentially large space of all possible
In this work, we show how learning a CSNEM can be cast as a more complex NEM learning problem. To solve the NEM learning problem, we use MC-EMiNEM, a method that does not attempt to optimize a marginal likelihood, as many of the above approaches do, but maximizes the log posterior
where
3. Methods: Context-Specific Nested Effects Models
As briefly mentioned in the introduction, the motivation for developing CSNEMs is that there are cases in which phenotype effects are not nested, as in the example in Figure 1. In CSNEMs, we account for situations such as the partial overlap in Figure 1 by allowing an action in the graph to be represented by more than one node, and we call these different nodes that correspond to the same action and different contexts of the action. Mathematically, this enables the model to represent relationships that are not representable by an NEM. Biologically, different contexts in a CSNEM may correspond to participation in different pathways, either due to physical separation such as localization of molecules, or temporal separation, such as participation in different stages of the cell cycle.
The CSNEM in Figure 1B is presented as a single NEM-like graph with multiple contexts for the Cka2 node. Note that the same diagram can also be viewed as a pair of NEMs: one containing Hog1 and Cka2, which applies to effects e1, e2, e3, and e4, and another containing only Cka2, which applies to the effects e5 and e6. This view of a CSNEM as a mixture of NEMs is most useful in understanding our approach to learning a CSNEM from data.
3.1. The likelihood of a k-CSNEM
We define a k-CSNEM as a mixture of k NEMs, where the response of each effect e is governed by one of k NEMs, each of which can have a different graph G relating the actions
The parameter
In relation to the CSNEM, let us combine the mixture of NEMs into one structure by defining the block diagonal matrix
In Section 6, we show that given these definitions, the log-likelihood of the CSNEM can be written as
That is, the likelihood of a k-CSNEM is equal to the likelihood of an NEM with
3.2. Compact visualization and identifiability of a k-CSNEM
Having obtained k NEMs and the corresponding partitioning of the effect set, a single graph can be composed by merging all action nodes across the graphs that have the same ancestors (are reachable from the same set of actions). Figure 3 provides an example: Figure 3A shows three graphs that describe the structures of three NEMs that compose a mixture, and Figure 3B shows the result of merging them. Note that Hog1 is reachable from no nodes but itself in all three NEMs. Consequently, in the compact CSNEM, there is only one version of Hog1. In contrast, Cka2 is reachable from Hog1 in one of the NEMs and is only reachable from itself in the others, which is why it has two contexts in the CSNEM. Similarly, Ckb14 is reachable from both Hog1 and Cka2 in one of the three NEMs, but not the others, and has two contexts as well. To keep track of the various contexts, we append the list of genes from which a context is reachable when displaying the graph, for example, the context of Cka2 that is reachable from Hog1 is labeled “Cka2 [Hog1],” whereas the context that is not reachable from other nodes is labeled simply “Cka2.” This is particularly helpful when viewing graphs with many nodes and many contexts.
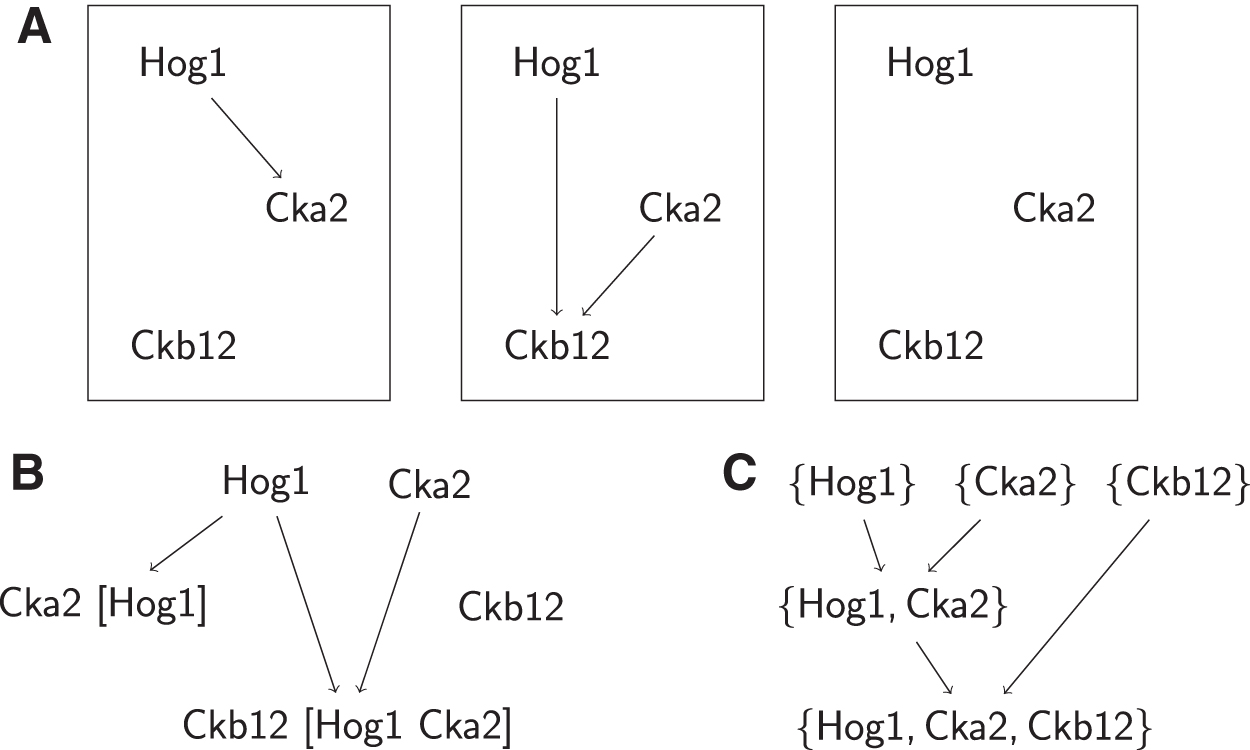
Building a CSNEM from a mixture of NEMs.
The merged graph in Figure 3B preserves the edges that were present in the mixture of NEMs, but it is not necessarily a unique maximizer of the likelihood, rather, it is a member of an equivalence class of equally likely CSNEMs. What characterizes the equivalence class is the set of inclusive ancestries of the nodes in the CSNEM. The inclusive ancestry of a node is a set of actions; this set contains the action at the node and all actions from which it is reachable: for example, the inclusive ancestry of the Cka2 node in the leftmost NEM in Figure 3A is
The characterization of equivalence classes in terms of inclusive ancestry sets relates to previous results about NEM identifiability: for transitively closed
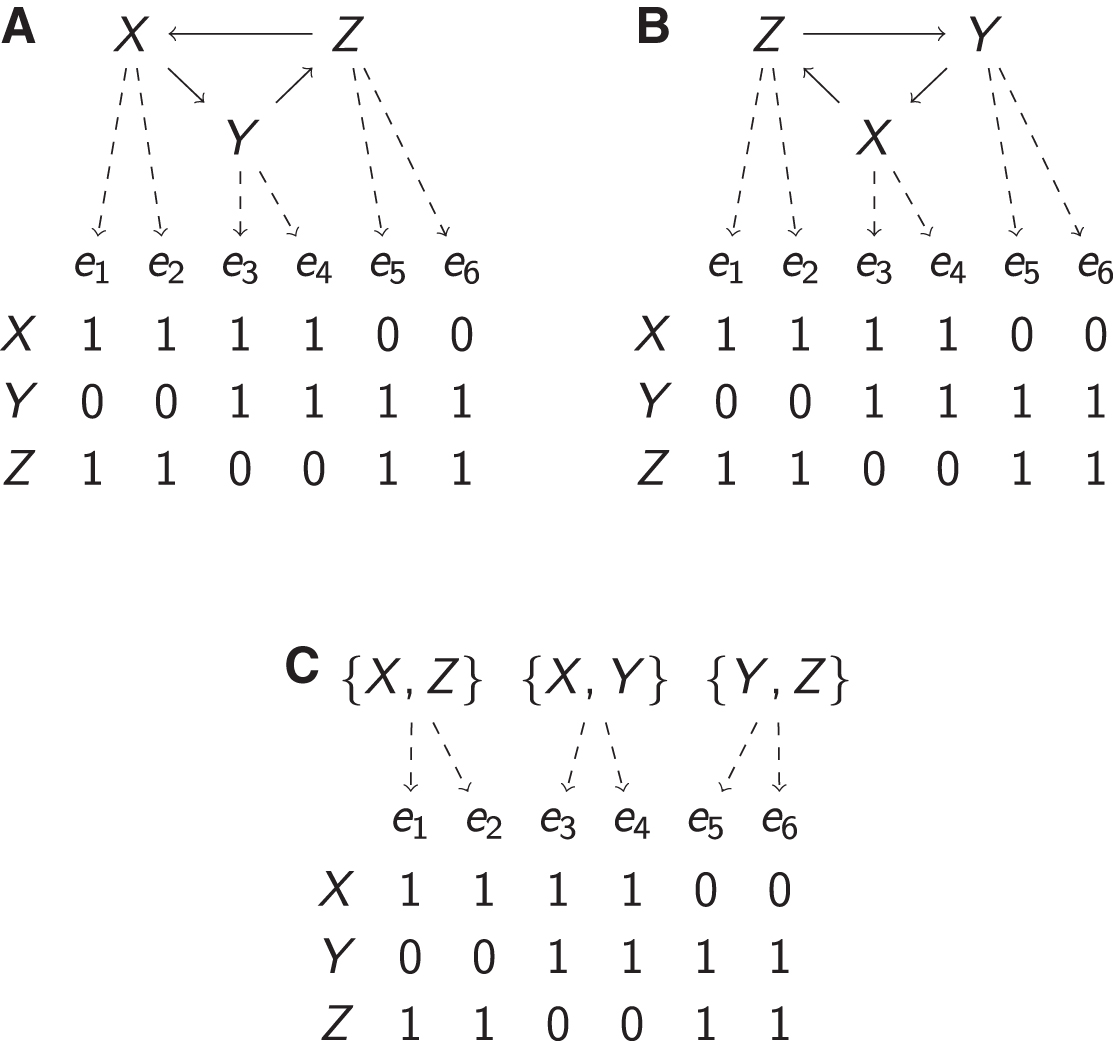
The action-set graph of a nontransitive NEM cycle structure.
Note that while the set of ancestries characterizes the likelihood equivalence class, the posterior maximized by a Bayesian method such as MC-EMiNEM would be, for example, higher for CSNEMs with fewer edges in
4. Results
We have introduced the CSNEM model and showed how the CSNEM likelihood can be viewed as the likelihood of an NEM with
4.1. Evaluation on simulated data
We performed simulations to evaluate our ability to infer CSNEMs from data. We generated data from mixtures of NEMs of varying size: we varied the size of the NEMs in the mixture to contain nA = 3,5,10, or 20 actions, and we varied the number of NEMs in the generating model from
Next, for each effect, with probability 0.3, we attach it nowhere, otherwise, we uniformly randomly attach it to one of the
Since in real-world applications, we usually do not know how many contexts are truly needed to describe a process under study, we sweep through values of k ranging from 1 to 8 and learn a k-CSNEM for each value of k from each generated log-odds matrix. CSNEMs were learned using the MC-EMiNEM implementation in the nem R package, with the learned network taken from the end of a 20,000 sample chain, the empirical Bayes step performed every 5000 steps, an acceptance sparsity prior of 0.5, and
We evaluate each k-CSNEM learned from each log-odds matrix both in terms of the ability of the CSNEM to accurately model which effects are differentially expressed in response to each action and in terms of the relationships inferred among actions. In the former case, we use the F-measure to quantify how well the effect matrix F of the learned CSNEM matches that of the generating CSNEM, with the interpretation that if an effect responds to an action in both the learned and the generating model, it is a true positive, if it does not respond in the learned model but does in the generating model, it is a false negative, if it does not respond in either model, it is a true negative, and if it responds in the learned model but not the generating model, it is a false positive. Figure 5A shows the F-measures for learning the effect matrix across our simulations for the almost-noiseless case of
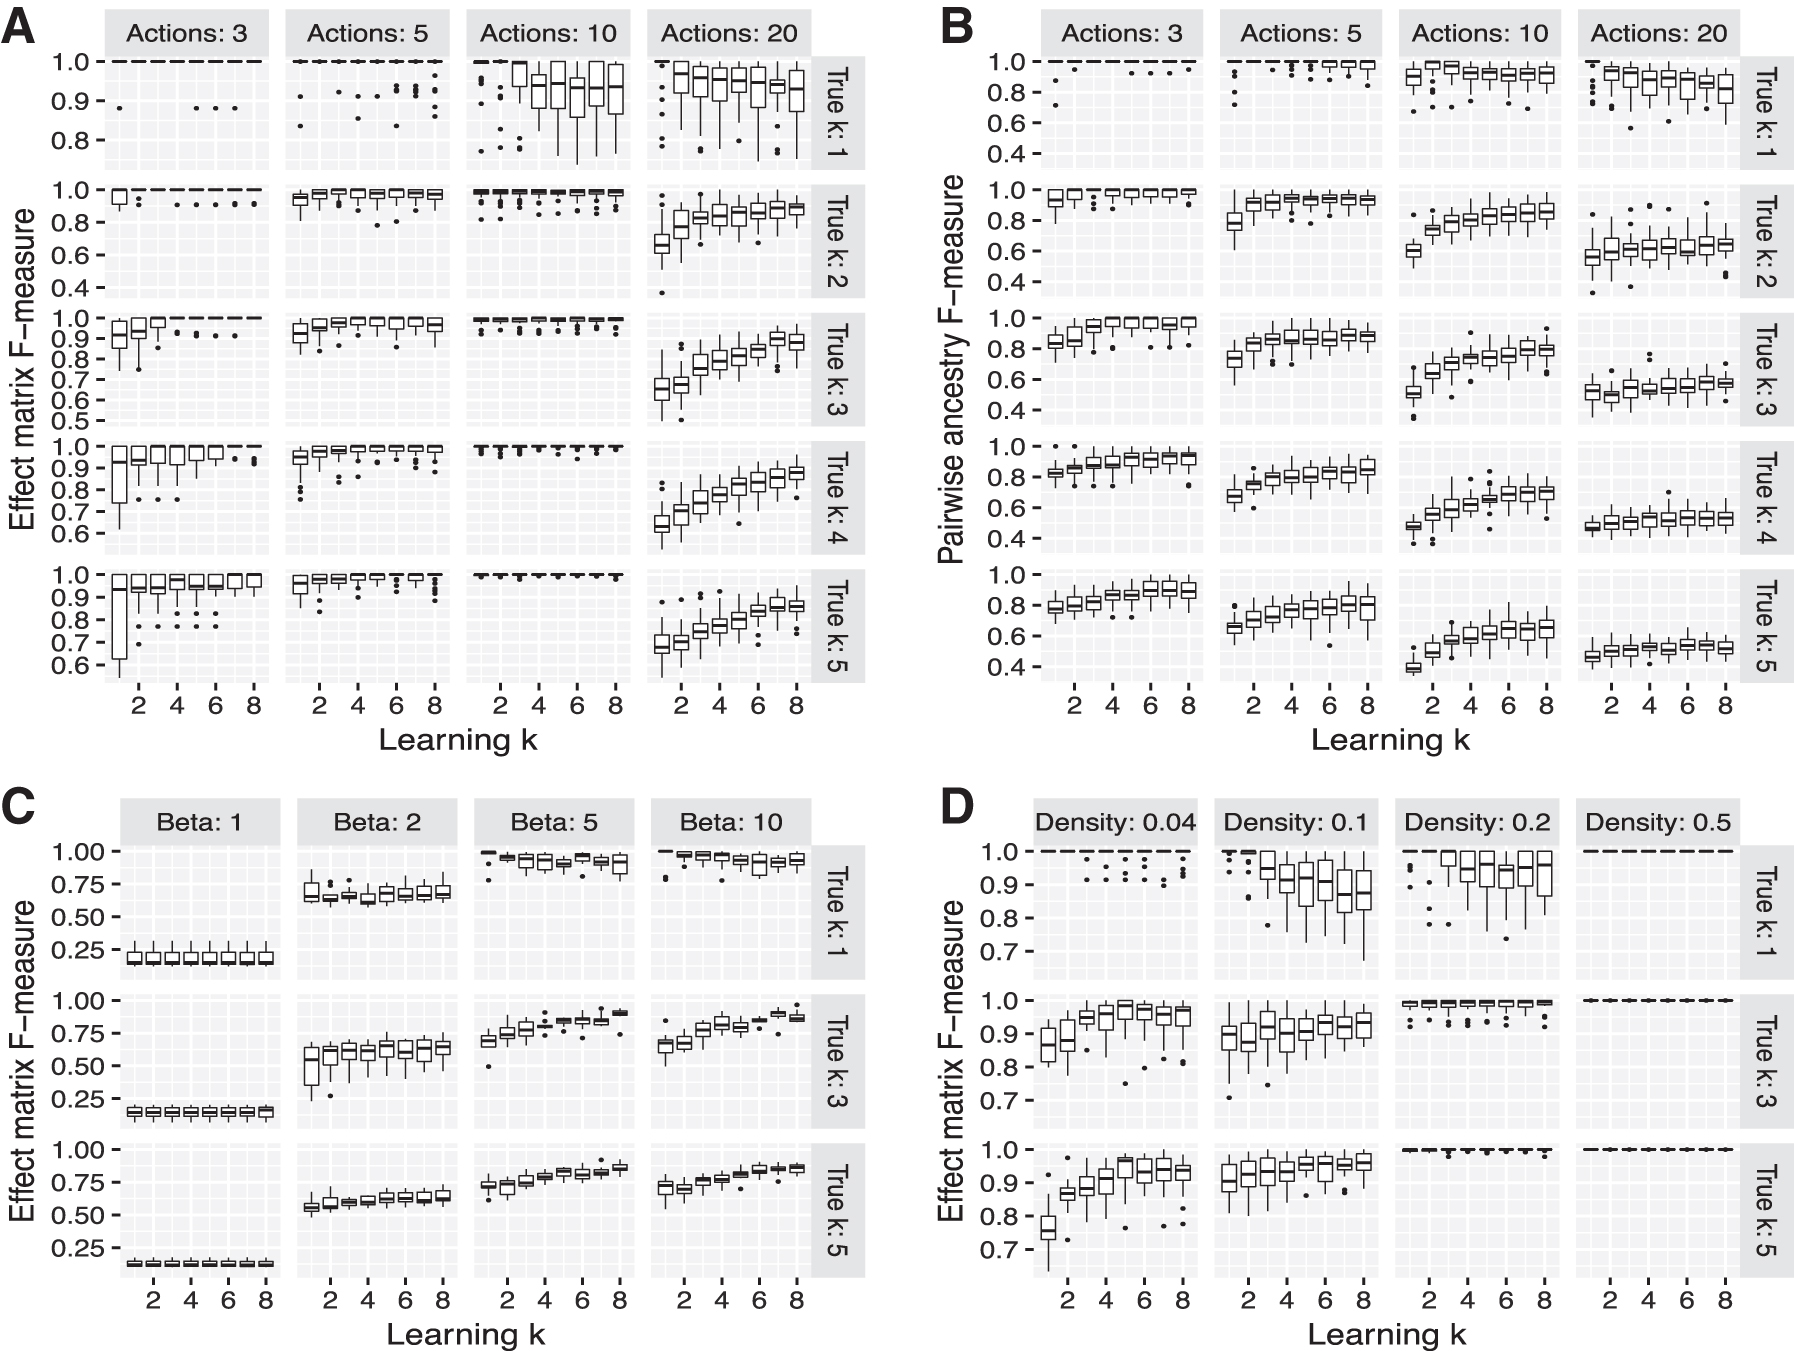
Box plots of simulation F-measures. Each plot represents an aggregate of results from 30 random simulation replicates. Grid rows correspond to the number of contexts in the generating model, the x-axis in each of the grid cells indicates the number of contexts in the learned model, and the y-axis represents:
To compare the learned graph structures with the generating graph structures, we must first determine which contexts in the learned model correspond to which contexts in the generating model. For each action a in each model, we obtain a list of contexts that are distinguishable in terms of which actions are ancestors of the action a. We then match each of these contexts in each model to their best match in the other model. Each ancestor that the two contexts in the best match have in common counts as a true positive, each ancestor that appears in the context from the learned model but not in the context from the generating model counts as a false positive, and each ancestor that appears in the context from the generating model but not in the context from the true model counts as a false negative. We use these counts to summarize agreement between the structures of two CSNEMs in terms of an F-measure, which we call the pairwise ancestry F-measure. Figure 5B shows the pairwise ancestry F-measures across our simulations.
When the learned model is a plain NEM (k = 1), we see that as the generating model has more contexts, the recovery of both the effect and the ancestry pattern worsens (with the exception of the 10 actions case, examined below). This confirms that a CSNEM is necessary when multiple contexts are indeed in play in the generating system. When the learned model has multiple contexts, even when the number of contexts in the learned model exceeds the number of contexts in the generating model, the approach does not seem to be susceptible to overfitting. This pattern holds as we increase noise (decrease β) in data generation.
At
4.2. Application to NaCl stress response in S. cerevisiae
We apply our method to the exploration of NaCl stress response pathways in S. cerevisiae. We consider data obtained from a WT strain and 28 knockout strains. Transcript abundances were measured by microarray for each strain before NaCl treatment and 30 minutes after 0.7 M NaCl treatment. The data collection was described in detail in previous work (Berry and Gasch, 2008; Lee et al., 2011).
We are interested in how the gene knockouts change the cells' response to stress. Therefore, the actions
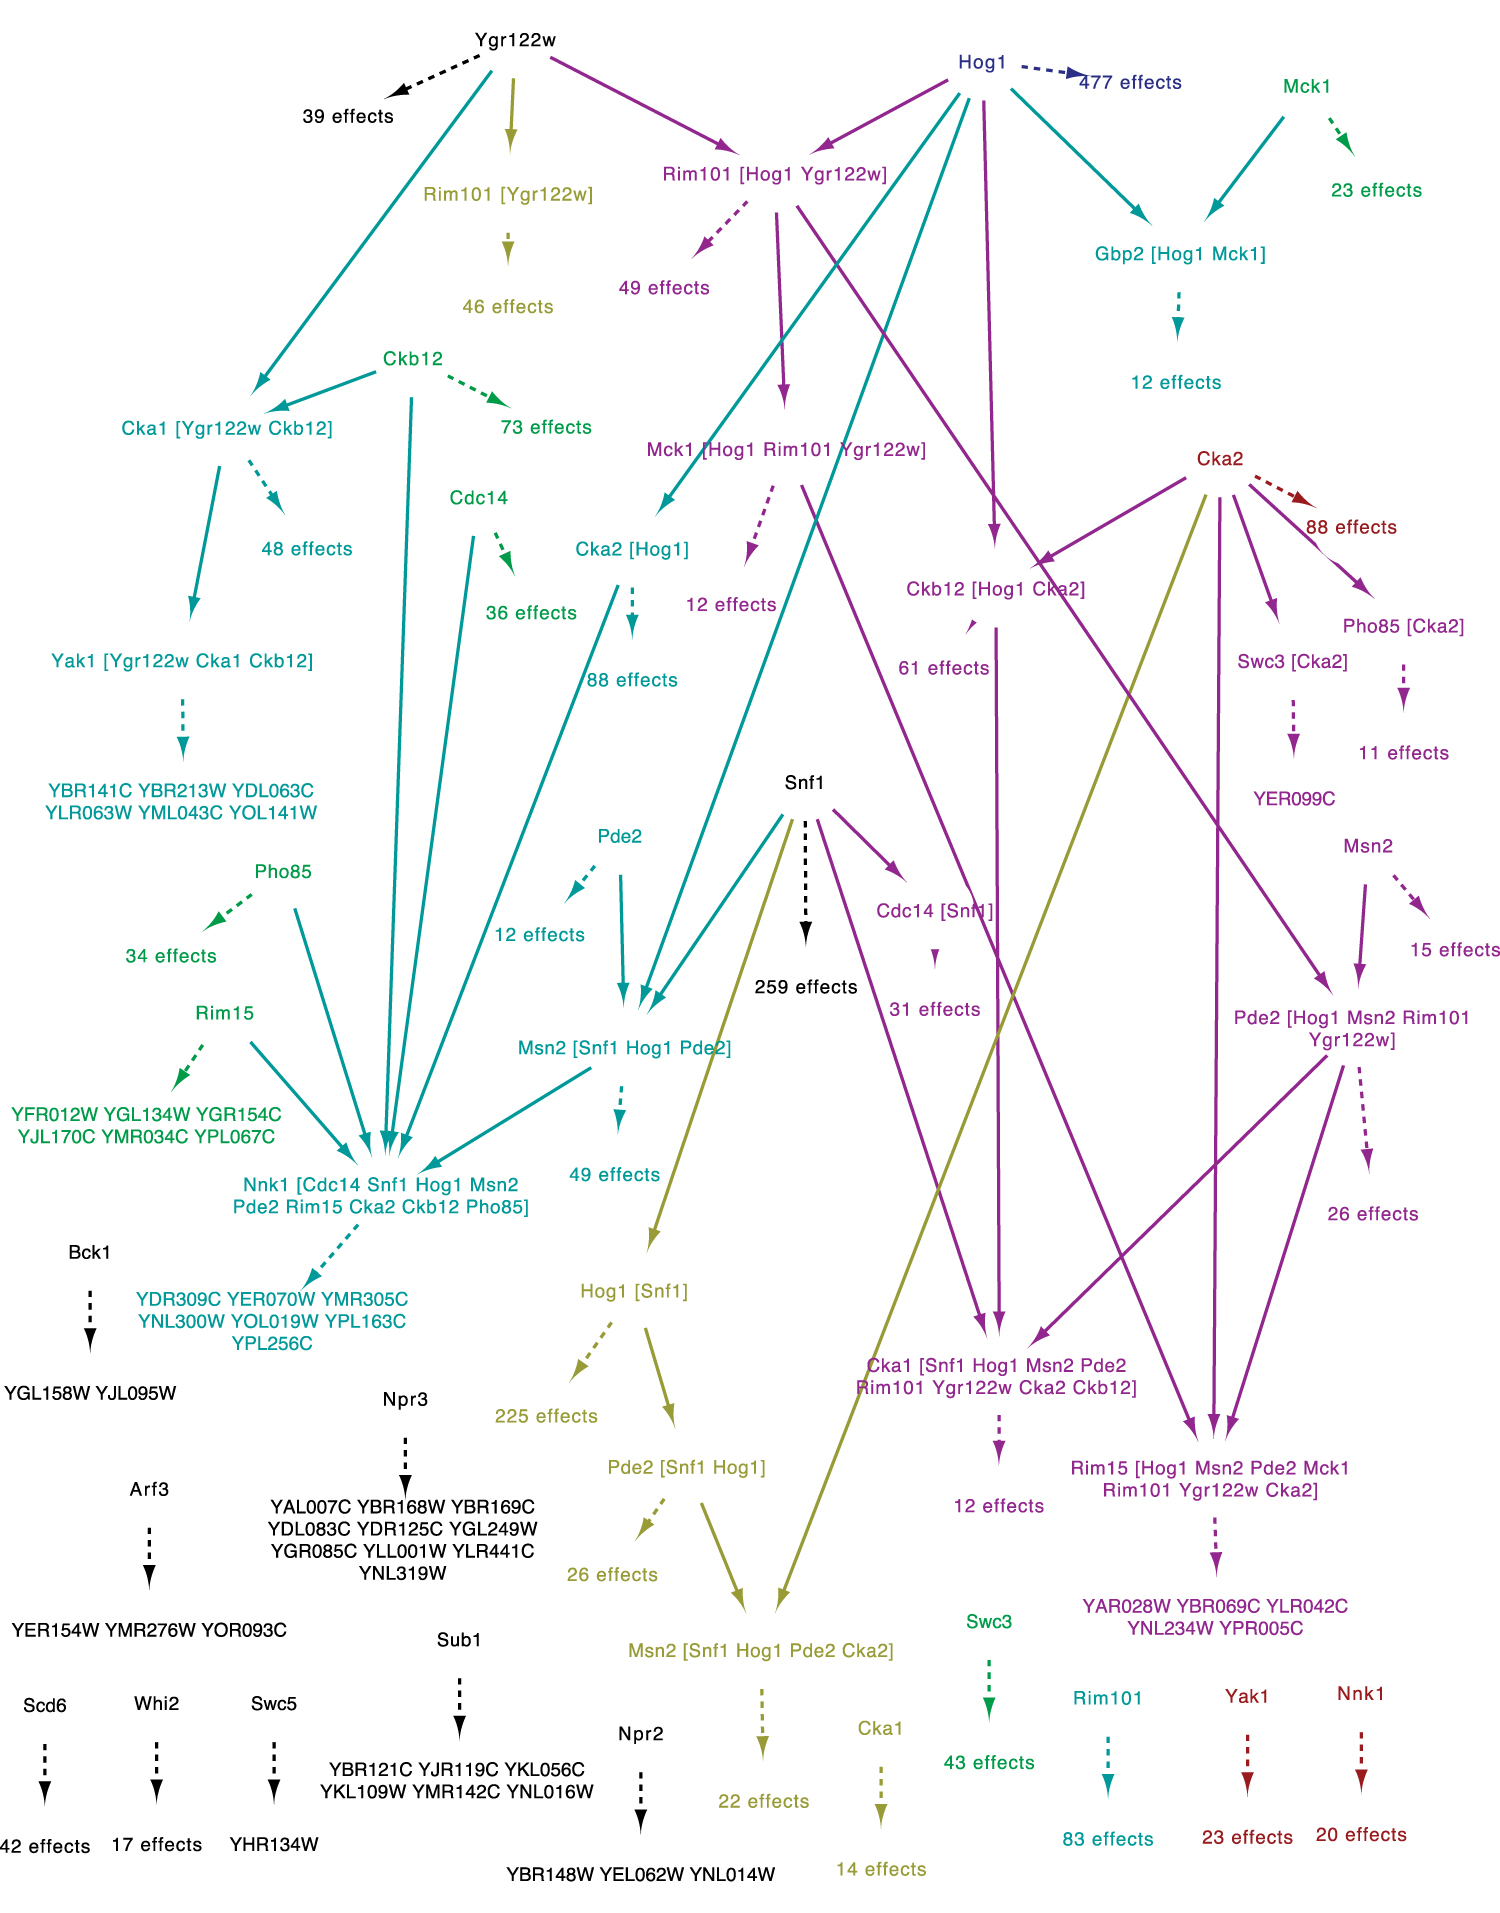
The 3-CSNEM network learned from Saccharomyces cerevisiae NaCl stress knockout microarray data. Action nodes and action-action edges are colored according to the NEM member in the mixture from which they came, in cyan, magenta, or yellow. Nodes that were merged because of identical ancestors in multiple mixture members are colored according to subtractive color mixing (cyan and magenta make blue, cyan and yellow make green, magenta and yellow make red, and all three make black). Effects are colored and grouped according to the actions to which they are attached. Where the number of effects in a group is less than 10, the effects are listed. Where it is 10 or more, the number of effects in the group is shown. Action-action edges are solid and action-effect edges are dashed.

The NEM network learned from S. cerevisiae NaCl stress knockout microarray data. Action nodes are in black and effect nodes are in blue. Effects are grouped according to the actions to which they are attached. Where the number of effects in a group is less than 10, the effects are listed. Where it is 10 or more, the number of effects in the group is shown.
The inferred network captures many known and several new features of the yeast stress responsive signaling network. The Hog1 kinase is a master regulator of the osmotic stress response (Nadal and Posas, 2015). The CSNEM network correctly places Hog1 at the top of the hierarchy in paths with known coregulators. For example, the network captures paths containing Hog1 and CK2 complex subunits Cka2 and Ckb1/2; Hog1 is known to interact physically with Cka2, and the two kinases regulate an overlapping set of genes (Chasman et al., 2014). The network also correctly predicts that the transcription factor Msn2 is regulated by Hog1, Pde2, and Snf1—all known regulators of Msn2 ( Rep et al., 2000; Mayorodomo et al., 2002; Lee et al., 2008; Petrenko et al., 2013); yet a separate branch represents only Pde2 and Msn2, consistent with Pde2 playing a more significant role in regulating this transcription factor during salt stress (Chasman et al., 2014). Another example is seen in YGR122W, a poorly characterized protein required for processing the transcriptional repressor Rim101—the CSNEM correctly puts YGR122W and Rim101 in the same paths, with at least one regulatory branch shared with Hog1 control.
The CSNEM naturally produces groups of effects where each group comprises those effects (i.e., transcripts) that are reachable from contexts of actions in the graph. We examined the groups of effects in terms of Gene Ontology (GO) enrichments. Figure 8 shows a comparison of these enrichments to those obtained from grouping effects by the attachments from a learned NEM. The figure also shows a coarser split of the effects into groups based on CSNEM contexts: if an action was merged from two or more contexts in the single-network CSNEM representation, all the effects attached to it are considered reachable from both (or all three) contexts from which the action was merged. Each column in the figure corresponds to a GO term and each row corresponds to a combination of contexts or an action. A point in the figure indicates that the set of effects reachable from the context(s) or action was found to be significantly enriched for the GO term. Significance was defined according to a hypergeometric test with the Benjamini–Hochberg method used to control the false discovery rate at 0.05; only groups of five or more effects were considered for enrichment analysis.
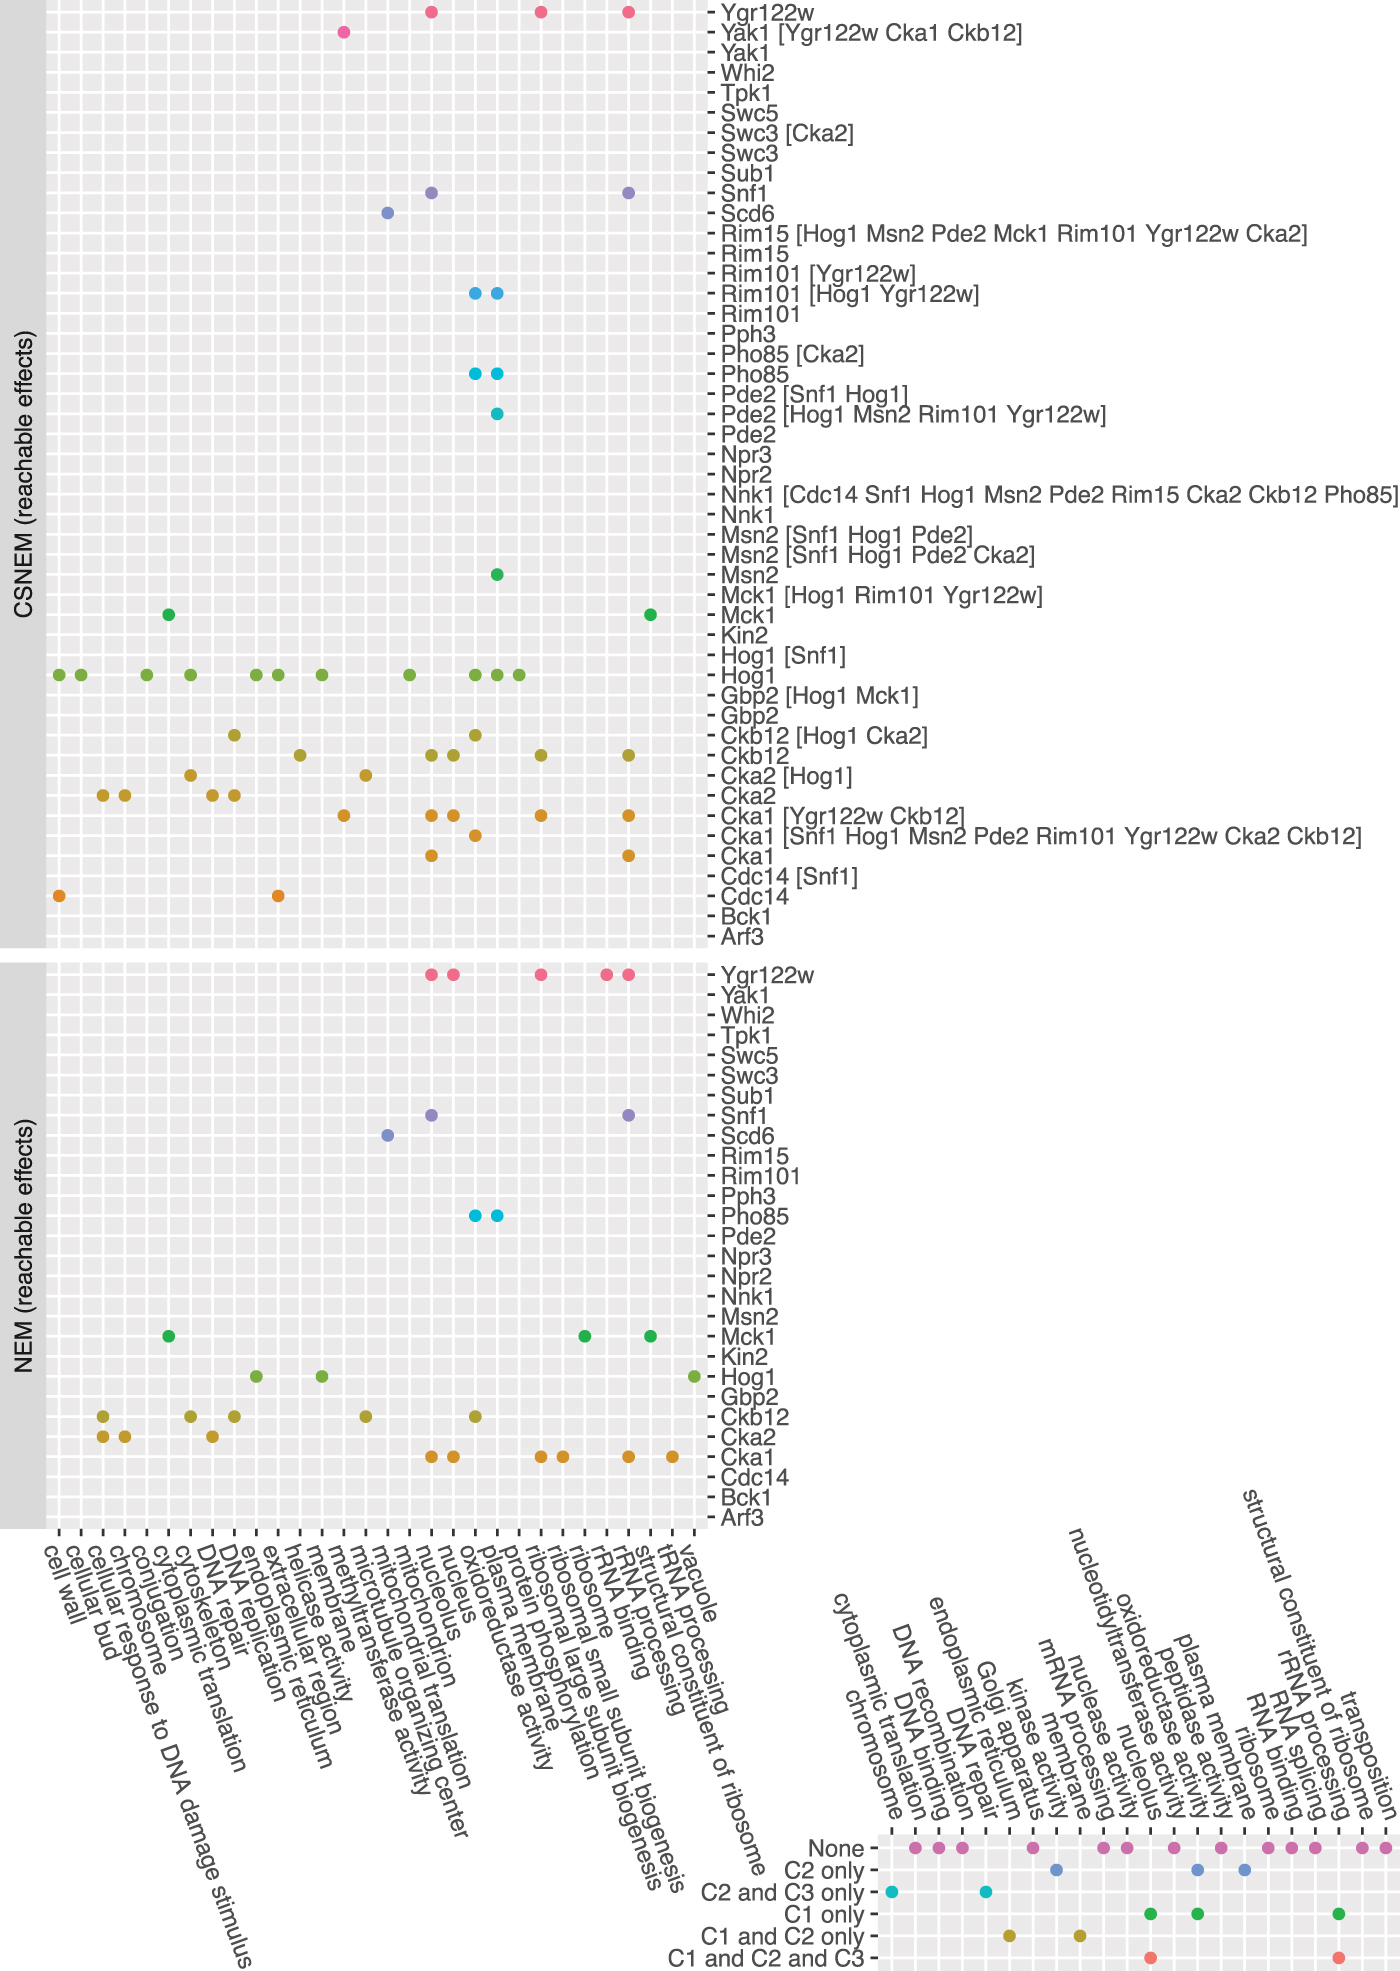
Comparison of effect group GO term enrichments. Columns correspond to GO terms and rows correspond to actions in the NEM and CSNEM, and to possible combinations of contexts of the 3-CSNEM. A point indicates that a GO term was found to be significantly enriched. Points are colored by knockout in the NEM and CSNEM plots and by context in the context-membership plot. GO, Gene Ontology.
A key advantage of our approach is that regulators can be represented in multiple pathways, capturing regulators that may have distinct roles in different cellular compartments or cell cycle phases. In fact, several of the GO terms for which the CSNEM effect groups are enriched are associated with subcellular localization and include transcripts encoding proteins localized to the nucleus, nucleolus, plasma membrane, endoplasmic reticulum, mitochondria, peroxisome, and cytoskeleton. The coarser split of effects by contexts also shows that there are clear divisions of localization across contexts in the CSNEM.
An interesting example of the benefits of the CSNEM approach is seen in its ability to capture the disparate signaling roles of the phosphatase Cdc14, a key regulator of mitotic progression in dividing cells (Weiss, 2012). Inactive Cdc14 is tethered to the nucleolus during much of the cell cycle but released upon mitosis to other subcellular regions where it dephosphorylates cyclins and other targets (Wurzenberger and Gerlich, 2011). Separate from its role in the cell cycle, Cdc14 was recently linked to the stress response in yeast (Breitkreutz et al., 2010; Chasman et al., 2014), although its precise role is not clear.
The CSNEM network places Cdc14 in multiple pathways that capture the distinct functions of the phosphatase. One path represents an isolated connection of Cdc14 to a group of genes regulated by the cell cycle network. Many of these genes are known to be regulated by Cdc14 during normal cell cycle progression. But consistent with a second role in the stress response, Cdc14 is also nested in a path regulated by Snf1, a kinase that responds to both nutrient/energy restriction and osmotic stress resulting from salt treatment (Ye et al., 2008). The Snf1-Cdc14 pathway is connected to 31 effectors that include genes induced by stress and related to glucose metabolism. Work from the Gasch laboratory previously showed through genetic analysis that Snf1 and Cdc14 function, at least in part, in the same pathway during the response to salt stress (Chasman et al., 2014). Yet both Cdc14 and Snf1 have other functions in the cell, leading to the regulation of only partially overlapping gene sets. Thus, the CSNEM approach successfully captured this complex regulatory distinction for Cdc14 and Snf1.
5. Discussion
We have introduced CSNEMs, a generalization of NEMs, which can explicitly model the different interactions that genes may have in different contexts. We have shown that how a CSNEM can be viewed as a mixture of NEMs and that the task of learning such a mixture can be cast as a single NEM-learning task with a modified data matrix and constrained action graph structure in which actions are replicated k times. Particularly, we took the approach of using a hard mixture where effects and actions are assigned to different contexts. A natural avenue for future investigation would be the exploration of soft-mixture approaches, which may prove more scalable for larger numbers of contexts and actions.
Applying our method to simulated data has shown that learning CSNEMs leads to good recovery of the effect patterns and ancestry relations that were present in the generating model. The results also show that a CSNEM is necessary when the generating model truly has multiple contexts, but slight overestimation or underestimation of the number of contexts does not seem to lead to overfitting. In practice, the correct number of contexts that a learned model should have is not known, and optimal selection of k is still an open problem that we plan to explore in future work. Existing approaches to model selection, such as a search for a plateau in likelihood, or the use of model complexity measures such as AIC point to possible solutions for this problem.
Our analysis of a CSNEM network learned from S. cerevisiae NaCl stress knockout microarray data revealed that the CSNEM does recover known regulatory patterns and, moreover, captures known patterns of context specificity in the genes under study. Analysis of GO term enrichments of the effects reachable from CSNEM nodes shows that many effect groups are associated with subcellular localization, a pattern even more evident in examining a coarser division of the effects, based on mixture contexts. We believe that localization may be one source of context specificity that is relevant in many applications. The main motivation for developing CSNEMS was the observation that effect nesting may not be an appropriate assumption for some settings because of the context-specific nature of interactions that some genes can have, and perhaps, more explicit modeling of contexts of interaction can lead to more faithful representations of the underlying biology.
6. Proofs
In this section, we derive Equation (5).
Recall that given k contexts,
Let us define a mapping of effect indices
Given this partition of the effect space, the likelihood of a CSNEM is defined as the product of the NEM likelihoods per partition:
where
Let Ri be a matrix in
With



Where we get Equation (14) because
Footnotes
Acknowledgment
We thank anonymous reviewers for many constructive comments.
Author Disclosure Statement
The authors declare they have no competing financial interests.
Funding Information
This research was supported by NIH/NLM grant T15 LM0007359, NIH/NIAID grant U54 AI117954, and NIH/NIGMS grant R01 GM083989.