
Abstract
An important goal in microbial computational genomics is to identify crucial events in the evolution of a gene that severely alter the duplication, loss, and mobilization patterns of the gene within the genomes in which it disseminates. In this article, we formalize this microbiological goal as a new pattern-matching problem in the domain of gene tree and species tree reconciliation, denoted “Reconciliation-Scenario Altering Mutation (RSAM) Discovery.” We propose an
1. Introduction
Prokaryotes can be found in the most diverse and severe ecological niches of the planet. Adaptation of prokaryotes to new niches requires expanding their repertoire of protein families, via two evolutionary processes: first, by selection of novel gene mutants carrying stable genetic alterations that confer adaptation, and second, by dissemination of an adaptively mutated gene. These two processes are correlated: an adaptation-conferring mutation in a gene could accelerate its mobilization across bacterial lineages populating the corresponding environmental niche (Poirel et al., 2009), and vice versa, the mobilization of a gene by transposable elements increases its chances to mutate or “pick up” novel genomic context. Thus, an important research goal is to identify gene-level mutations that affect the spreading pattern of the mutated gene within and across the genomes harboring it.
For example, consider mutations conferring adaptation of bacteria to a human pathogenesis environment. Here, a mutation to a resistance or virulence factor could enhance pathogenic adaptation, thus increasing the horizontal mobilization of the mutated gene within other human pathogens inhibiting this niche (Poirel et al., 2009). In this case, we say that the mutation has a causal association with the observed dissemination pattern of the mutated gene (i.e., the increased mobilization of the gene among pathogenic bacteria). Identifying such mutations could inform infectious disease monitoring and outbreak control, and assist in identifying potential drug targets.
The coevolution of genes and their host species is classically described by computing the most parsimonious reconciliation scenario between a given gene tree G and the corresponding species tree S, that is, a mapping of each vertex An example of a DLT scenario. 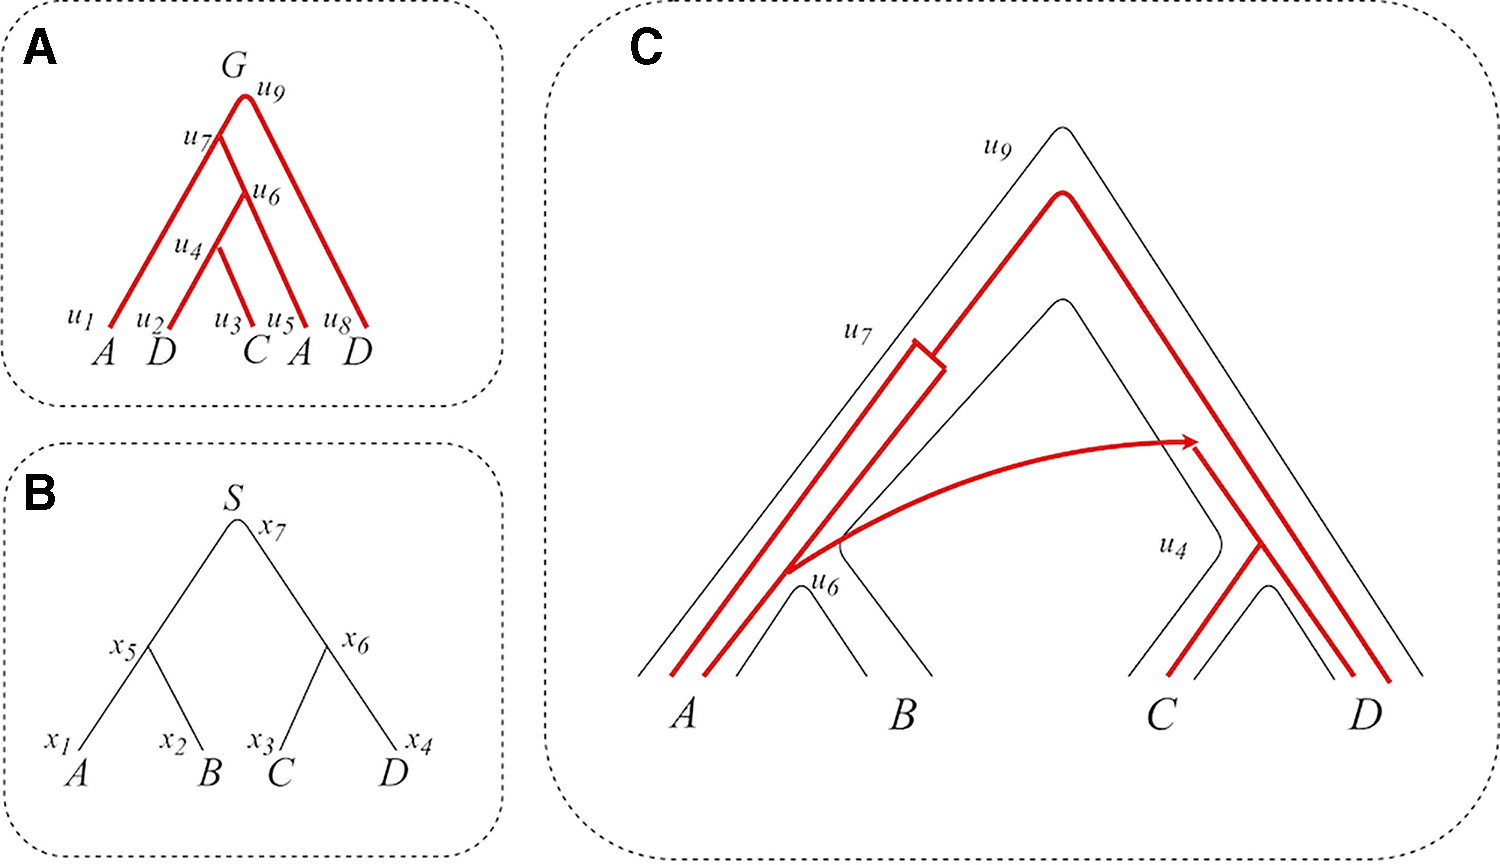
Motivated by examples such as the one given above, we formalize a new pattern-matching problem in the domain of DLT reconciliation. Given are a gene tree G, a corresponding species tree S, a mapping
In what follows, we propose a three-stage solution to the RSAM Discovery problem defined above (illustrated in Fig. 2). The first stage constructs a hypergraph High-level overview of the RSAM-finder algorithm. RSAM, Reconciliation Scenario Altering Mutation.
The construction of
We remark that a simpler
Our proposed solution to the problem defined in this article is implemented as a tool called RSAM-finder, publicly available in Zoller (2019). We assert the performance of RSAM-finder in large-scale simulations, and exemplify its application to the identification of RSAMs across a data sets spanning hundreds of species.
1.1. Previous related works
The DLT reconciliation problem has been extensively studied. In particular, two main DLT variants have been considered: (1) the undated DLT-reconciliation, where the species are undated, and (2) the fully dated DLT-reconciliation, where either each vertex in the species (and gene) tree is associated with an estimated date or the vertices of the species (and gene) tree are associated with a total order, and any reconciliation must respect these dates or order (i.e., a horizontal transfer (HT) event can occur only between coexisting species).
In the acyclic version of these variants, there cannot exist two genes such that one is a descendant of the other, yet the descendant is mapped (in the species tree S) to an ancestor of the other. Tofigh et al. (2011) showed that the acyclic undated version is NP-hard. However, the acyclic dated version becomes polynomially solvable (Libeskind-Hadas and Charleston, 2009).
Tofigh et al. (2011), Tofigh (2009), and David and Alm (2011) studied a version of the undated (cyclic) problem that ignores losses and proposed an
It is well known that the biological data used as input to the DLT reconciliation problem could be inaccurate, whether due to a sequencing problem, a problem in the reconstruction of G or S (Bapteste et al., 2009), or due to some other problem caused by noise. To overcome this problem, previous works try to examine more than one optimal solution, for example, see Donati et al. (2015) and Scornavacca et al. (2013). A probabilistic method for exploring the space of optimal solutions was suggested in Bansal et al. (2013) and Doyon et al. (2009), where the latter was improved in Doyon et al. (2011). Additional studies considered a space of candidate co-optimal scenarios within special variants of the DLT problem, some of which used special constraints to drive the search (Charleston, 1998; Merkle et al., 2010; Stolzer et al., 2012; To et al., 2015). Although all of the previous works reviewed in this paragraph compute a space of candidate reconciliation scenarios, none of these works considered the application of pattern matching on this space, as we do in this work.
DLT reconciliation variants where the reconciliation computation is guided by constraints derived from vertex-coloring information were proposed in applications studying host/parasite coevolution, such as Berry et al. (2018), where the vertex coloring (in both G and S) represents the geographical area of residence. However, the applied constraints were “hard-wired” to the specific problem addressed in that article. In contrast, the approach proposed in this article is more general, supporting a pattern search that is guided by a user-defined pattern. Our tool RSAM-finder provides the users with a query language able to express more robust patterns, according to the various applications where the pattern search is to be used.
2. Preliminaries
For a (binary) rooted tree T, let
2.1. DLT scenario
A DLT scenario for two binary trees G (the gene tree) and S (the species tree) is a tuple
Consistency of
Consistency of
(a)
(b) At least one of
Identifying horizontal transfer edges. For each edge
Associating events with internal vertices. For each
(a) Speciation.
(b) Duplication.
(c) Horizontal transfer.
Figure 1 demonstrates a DLT scenario. The species are written below the leaves of S. The (noninjective) mapping
2.2. Losses
Our definition of a loss event is based on the definition given by Bansal et al. (2012). Consider a gene tree G, a species tree S, and a corresponding DLT scenario

Recall that
2.3. Costs
Let
3. Hypergraph of k-Best Scenarios
To represent k-best solutions,* we use a directed hypergraph denoted by Various aspects of the problem addressed in this article. 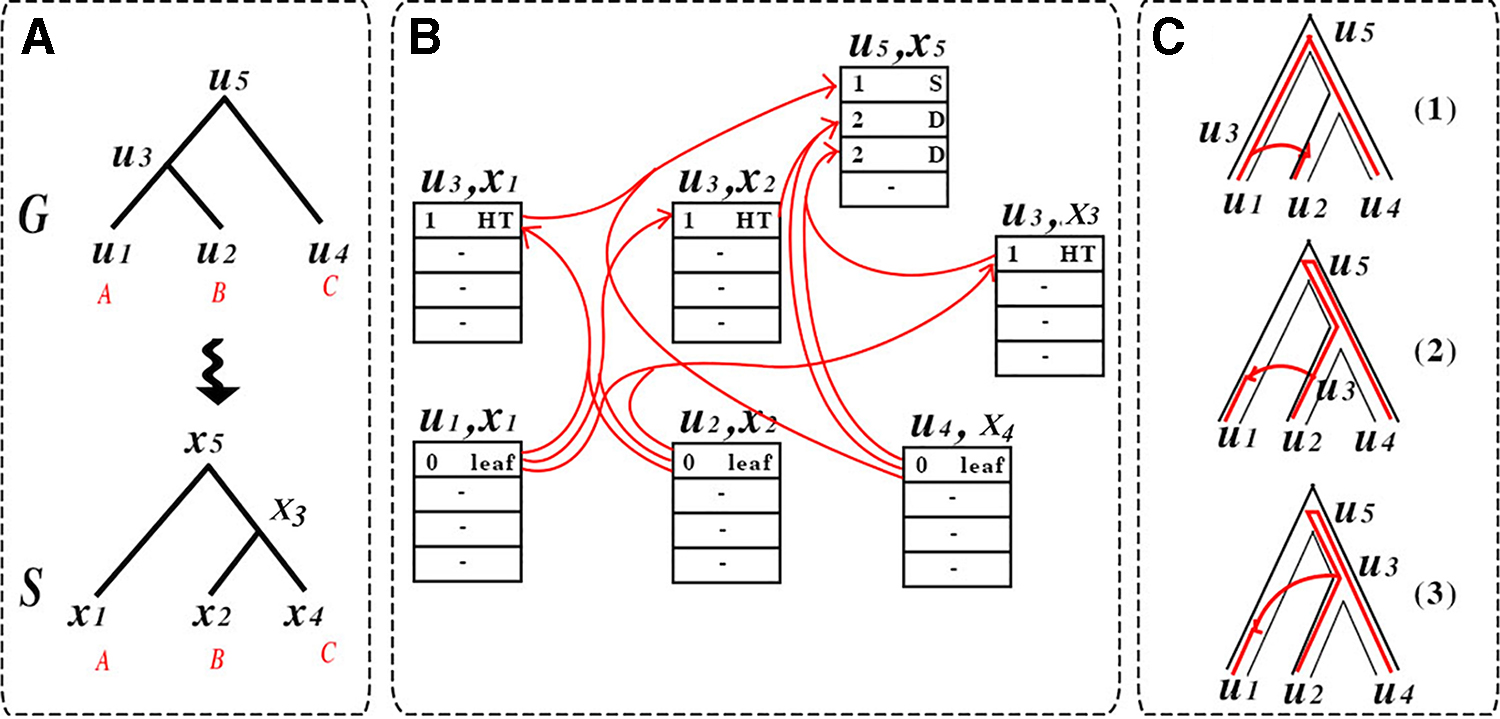
The second best solution [solution (2) in part C of the figure] is extracted in the same manner—now, we start with the hypernode
Hypernodes. For every vertex u in G, a vertex x in S, and an integer
Supernodes. For any vertex
Hyperedges. We remind the reader that each hypernode
4. Framework and Algorithms
In this section, we elaborate on each of the three stages of the workflow in Section 1.
4.1. Stage 1: Hypergraph construction
The first stage of our framework is to construct the hypergraph described in Section 3. To this end, we develop an efficient algorithm that runs in time
4.1.1. An overview of the algorithm
We iterate over all
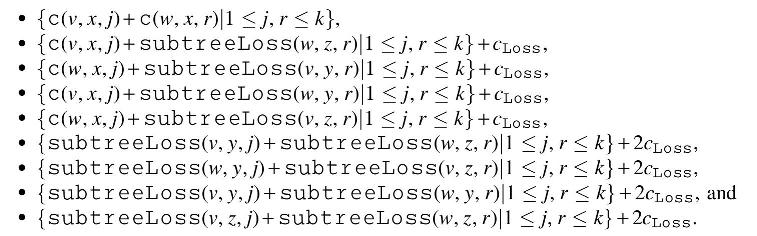
To avoid repetitive computation, we maintain three additional lists: subtree, subtreeLoss, and incomp. Intuitively, (u, x, i) represents the ith best cost of reconciliation of the tree rooted in u, such that u may be mapped to any
The efficient computation of
Having constructed all hypernodes of the form
4.1.2. Pseudocode
The pseudocode is given in Figures 4 and 5. We use the notation Pseudocode of the algorithm (first part). The pseudocode is continued in Figure 5. Pseudocode of the algorithm (second part). This figure continues the pseudocode given in Figure 4.
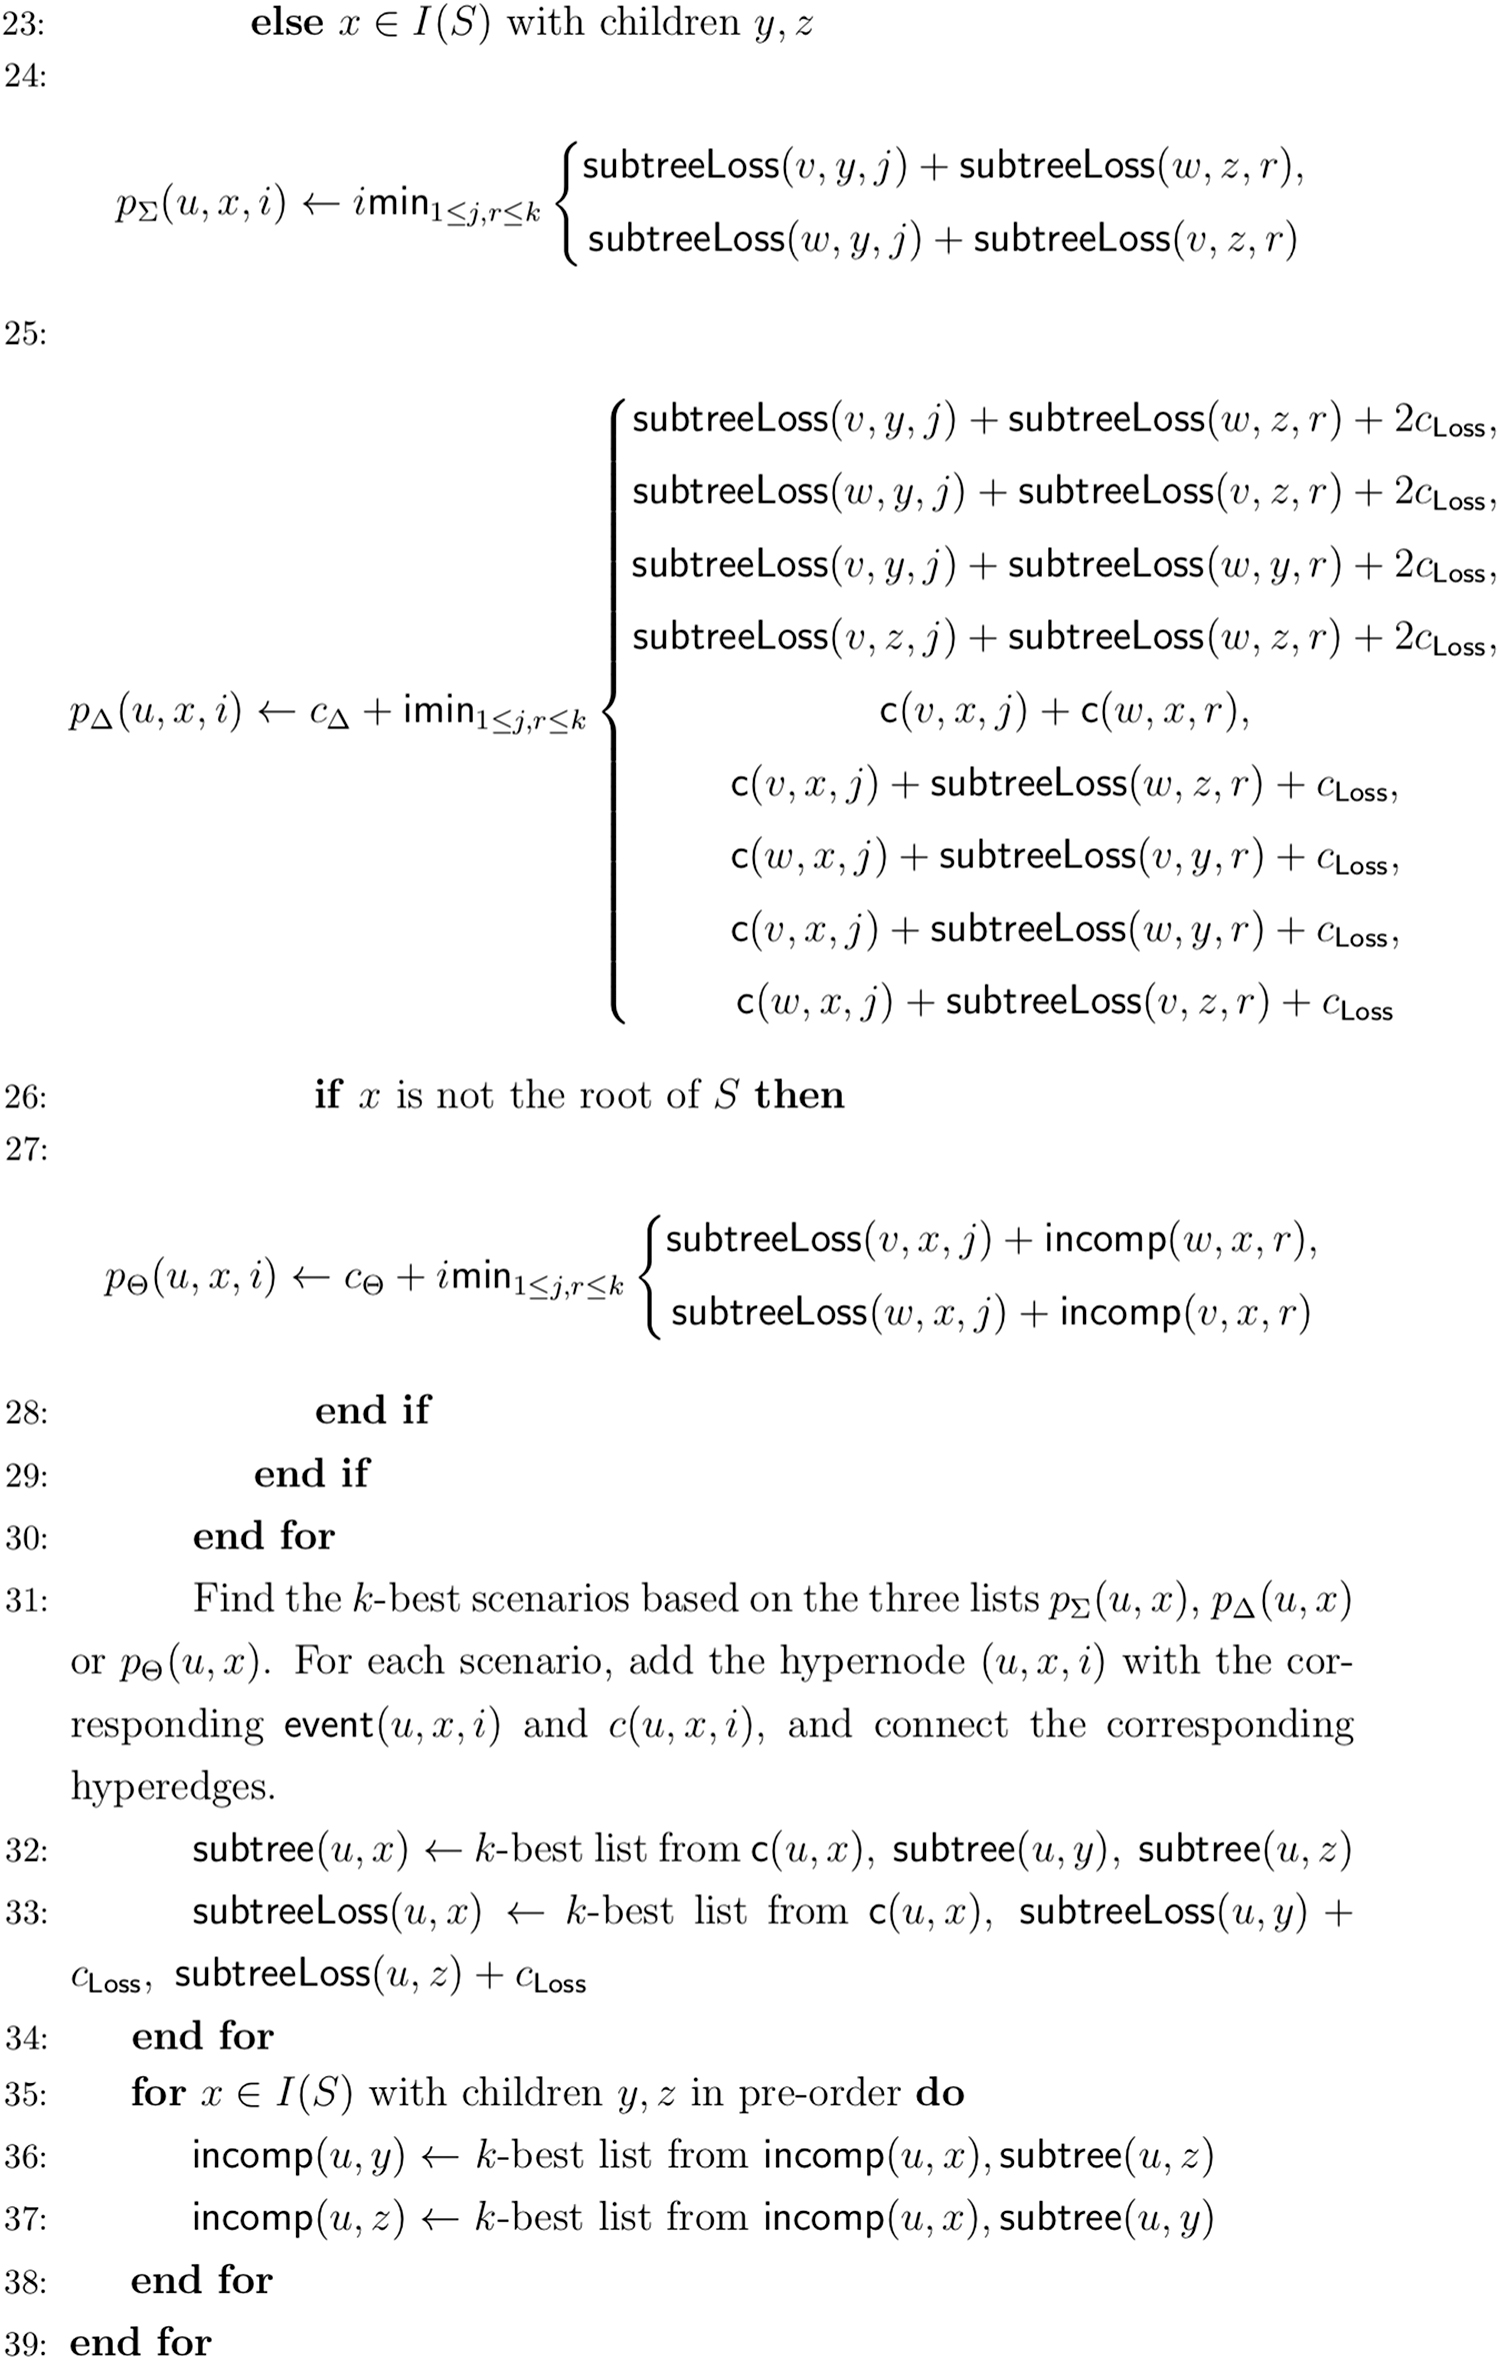
We proceed with a few clarifications of the pseudocode.
Proof of Lemma 1. We prove that for every pair of vertices
subtreeLoss(u, x, i) is the ith best cost of a DLT scenario mapping the subtree of G rooted in u to some subtree of S whose root is a vertex y that is a descendant of x, with additional cost of one loss per each edge in the path from x to y.
subtree(u, x, i) is the ith best cost of a DLT scenario mapping the subtree of G rooted in u to some subtree of S whose root is a vertex y that is a descendant of x.
incomp(u, x, i) is the ith best cost of a DLT scenario mapping the subtree of G rooted in u to some subtree of S whose root is a vertex y that is incomparable to x.
The proof is by induction on the order of computation.
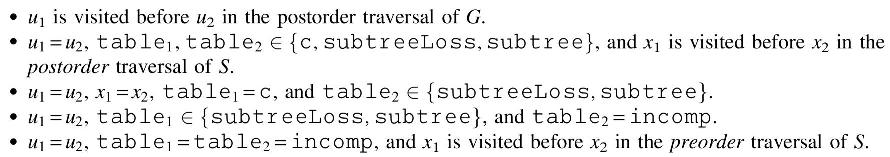
In particular, table1(u1,x1)<table2(u2,x2) where table1,table2∈{c,subtreeLoss,subtree,incomp} if one of the following conditions holds:
The basis of the induction comprises the computation of hypernodes of the form
For the inductive step, we consider some pair of vertices
First, consider the case where table = incomp. By the pseudocode, if x is the root of S, then
Second, consider the case where
Toward the proof of the statement, consider the list

Observe that the lists
Now, consider the list
Observe that the lists
Thus, by the inductive hypothesis, we have that (i)
Finally, consider the list

Observe that the lists
Proof of observation 1. For each pair of vertices
4.2. Stage 2: Assigning probabilities
In the second stage, we assign a probability to each hypernode in
4.2.1. Weight computation
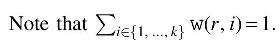
Let
Denote
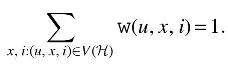
We now turn to define the weight of a hypernode
Now, consider v that is not the root of G. We define
Proof of Lemma 2. We will verify a stronger property than the one in the statement of the lemma: for every vertex u in the gene tree G, it holds that
Before we verify this property, observe that when u is a leaf, then
To prove the (stronger) property above, we use induction. In the basis, u is the root of the gene tree G. Then, we have that

Here, the first equality follows directly from the definition of weights. The second equality follows from the fact that each hypernode
4.3. Stage 3.1: Pattern discovery
The current version of RSAM-finder allows pattern queries to be specified as follows. A pattern specification consists of a tuple
For a colored query (having the second parameter in the specification set to
In addition to the settings described above, the user can select one of two modes:
Single-pattern mode. In this mode, the user specifies a single pattern and a threshold, and the sought RSAMs are identified as nodes
Dual-pattern (contrasting) mode. In this mode, the user specifies two patterns and one threshold, and the sought RSAMs are identified as nodes
The Pattern Identification algorithm proceeds as follows.
For each pattern
Reflect the interesting nodes identified in
Based on the specified mode of the query (single pattern or dual pattern), identify the t top scoring vertices
4.4. Stage 3.2: Score computation.
For each defined pattern
That is, for each vertex

where
5. Experimental Results
We implemented the algorithm described in this article as a tool, denoted RSAM-finder, and made it publicly available via GitHub (Zoller, 2019).
In this section, we test and exemplify the performance of RSAM-finder. The tests are based on large-scale simulations, where we demonstrate the engine's tolerance to noise (Section 5.2) and measure the practical running times of the proposed hypergraph construction algorithm as a function of increasing input size (Section 5.3). In Section 5.4, we exemplify an application of our proposed approach to the discovery and analysis of RSAMs in a beta-lactamase gene. However, first, in Section 5.1, we give the technical details regarding our simulations, tests, and experiments.
5.1. Methods and databases
Genes in our experiment are represented by their membership in cluster of orthologous genes (Tatusov et al., 2000). The STRING database (Szklarczyk et al., 2016) was used to extract the chromosomal protein sequences for the cluster of orthologous groups (COGs) of interest, annotated with their corresponding species names as well as the corresponding NCBI IDs. Protein sequences were subjected to multiple sequence alignment and dendrogram construction via Clustal Omega (Sievers and Higgins, 2018). The list of NCBI IDs was used as input for NCBI Taxonomy Browser, which provided a (nonbinary) species tree. Both gene and species trees were converted to binary trees via the Ape R package (Popescu et al., 2012). Habitat labels for the species were extracted from PATRIC, and missing tags were manually annotated by information from the GOLD database (Mukherjee et al., 2016) and from literature. CD Search (Marchler-Bauer and Bryant, 2004) was used to seek statistically significant discriminating domain-level mutations (i.e., the gain or loss of a protein functional domain). The simulator and our algorithm were implemented in Python, using NetworkX package, DendroPy (Sukumaran and Holder, 2010), and ETE Toolkit (Huerta-Cepas et al., 2016). Visualization of the trees and plots were created using Matplotlib and Seaborn tools.
For the simulation-based experiments, we generated random binary trees. The generation of a random binary tree was done in a top-down manner, using the ETE Toolkit (Huerta-Cepas et al., 2016). We began with a given set of vertices, based on which we created a random binary tree. The tree was duplicated and one copy was denoted G, while the other was denoted S. The function
To implant the pattern in the resulting random trees, we picked a random vertex
5.2. Testing for noise tolerance
We tested our tool on a random data set that was generated as described above, by introducing into the simulations an additional “noise factor” affecting horizontal transfers and colors. Each noise level represents the level of random changes in
Figure 6A demonstrates the advantage of our approach across different noise levels, following the strategy described above to generate randomized phylogenetic gene and species trees with a planted pattern. First, we constructed random phylogenetic species and gene trees with 600 leaves and one planted pattern (marked in purple in Fig. 6A). For each noise level between 0% and 20%, we constructed the corresponding hypergraph. For all experiments, we used 
We found that, at the lower noise levels, the score of the planted vertex
5.3. Running time measurements
To demonstrate the practicality of the theoretical improvements presented in Section 4.1, we compared the running times of the efficient,
The inputs to the compared algorithms were generated as follows. We picked random binary trees denoted S and G, with number of leaves ranging from 100 to 1000. For each number of leaves, we randomly created 10 such pairs of trees, and ran both the naive and the efficient algorithms on both data sets.
Figure 6B summarizes the measured time results. The green triangles correspond to the average of the time measured for the efficient version of the algorithm, and the red circles correspond to an average of the time measured for the naive version of the algorithm.
We found that as we increase the number of leaves, the differences in practical running times between the naive and the efficient algorithms become more significant. Furthermore, as expected in practice, the running time of the efficient algorithm is linear in the input size, while that of the naive one behaves as a nonlinear function.
5.4. Example: RSAM discovery in a beta-lactamase
Beta-lactamases are versatile enzymes, conferring resistance to the beta-lactam antibiotics, found in a diversity of bacterial sources. Their commonality is the ability to hydrolyze chemical compounds containing a beta-lactam ring (Bush, 2018). The secretion of antimicrobial compounds is an ancient mechanism with clear survival benefits for microbes competing with other microorganisms. Consequently, mechanisms that confer resistance are also ancient and may represent an underestimated reservoir in environmental bacteria (Bush, 2018). Antibiotic resistance factors, conferring adaptation to the pathogenesis environment, are widely spread by horizontal gene transfer mechanisms such as conjugation, transformation, and transduction (Navarro, 2006; Poirel et al., 2009). The persistent exposure of bacterial strains to a multitude of beta-lactams has induced dynamic and continuous production and mutation of beta-lactamases in these bacteria, expanding their activity even against the newly developed beta-lactam antibiotics (Stapleton et al., 2016). Thus, an important objective is to identify mutations in beta-lactamase genes conferring adaptation to human and animal hosts.
Motivated by the above, we exemplify a microbiological application of RSAM-finder to the discovery of RSAMs in beta-lactamase genes that confer adaptation to human and animal hosts. To this end, we use the pattern
Among the known classes (A–D) of beta-lactamase, class D (represented by COG2602) is considered to be the most diverse (Evans and Amyes, 2014). Thus, we selected COG2602 (622 genes in 543 genomes) as the data set for our example. Parameters were set as follows:
Within the top-ranking result for this query, we were interested in the subtree matching the first part of pattern (i.e., enrichment in red-to-red HT edges). The gene set represented by the leaves of this subtree (denoted “identified gene set”) was found to be enriched in an additional domain, BlaR, a signal transducer membrane protein regulating beta-lactamase production (87/119 in the identified gene set vs. 118/622 in the background, p-value = 3.94e-52). The only transcriptional regulator currently known for beta-lactamase genes is the repressor protein BlaI, previously predicted to operate in a two-component regulatory system together with BlaR in Class A beta-lactamase (Alksne and Rasmussen, 1997). The positions adjacent to the instances of the identified gene set in the corresponding genomes were found to be enriched in BlaI (70/119 of the identified gene set instances vs. 90/622 of the background gene set instances, hypergeometric, p-value = 1.11e-41). Note that this result was obtained with
In contrast to the identified gene set, the genes represented by the subtree that matches the second part of the pattern (frequent black events of all types) are not enriched in the BlaR domain (2/36), nor is there contextual enrichment in BlaI (4/36) in positions immediately adjacent to instances of these genes. Applying RSAM-finder to these data with simpler queries that take into account only enrichment in environmental coloring does not yield this result, nor does the application of RSAM-finder to these data with any part of the pattern on its own. This result is demonstrated in Figure 7.
Application of RSAM-finder to genes belonging to the class D beta-lactamase family. The sought pattern is 
The identified gene set for this result spans a wide range of Firmicutes, including both pathogenic (e.g., staphylococcus) and nonpathogenic species (e.g., various gut microbes from the Clostridiales order). Homology between BlaR receptor proteins and the extracellular domain of Class D beta-lactamases was previously observed (Massidda et al., 1996; Brandt et al., 2017), mainly in gram-negative bacteria (with focus on clinical samples). Thus, RSAM-finder identifies a putative beta-lactamase system in gram-positive bacteria, consisting of a COG2602-BlaR beta-lactamase receptor protein and its BlaI family repressor, predicted to confer adaptation to animal and human host environment. Further comparative sequence-level analysis (Toth et al., 2016) may reveal the affinity of this beta-lactamase system to specific beta-lactam drugs.
6. Conclusions
We defined a new optimization problem in the DLT reconciliation domain. The input to this problem consists of a gene tree, constructed for a given gene orthology group, a species tree constructed for the species harboring one or more members of this gene orthology group, and a pattern representing a sought scenario in the reconciliation of the two trees. The sought pattern could imply some evolutionary process of interest, such as a gene conferring adaptation of the species to a specific environmental niche. The goal of the problem is to compute, for any vertex in the gene tree, a score reflecting the probability that the genomic mutations associated with the edge leading into this vertex confer the occurrence of the sought pattern within high-scoring reconciliations of the subtree rooted by this vertex with corresponding subtrees in the species trees.
To solve this new problem, and overcome some of the noise associated with gene tree and species tree reconstruction, we proposed an algorithm that first constructs a hypergraph
Interesting open problems include the goal of extending the tool to handle more robust variations of phylogenies, such as polytomies and phylogenetic networks. It may also be helpful to consider bootstrapping methods to train the parameters and thresholds utilized by RSAM-finder.
Footnotes
Author Disclosure Statement
The authors declare they have no conflicting financial interests.
Funding Information
This work was supported by ISF Grant Nos. 1176/18 and 939/18 and by the Lynn and William Frankel Center for Computer Science.