
Abstract
Precision medicine has become a trend in the field of biomedical research. Analysis of mRNA and microRNA (miRNA) is a basis of it. Although the analyses of mRNA and miRNA in different cancers have been studied widely, only a few integrated studies concerning their interactions on large patient cohorts have been done. In this article, we study the integrated significance of mRNA, miRNA, and their interactions in the survival analysis of breast cancer (BRCA). We detect differential expression genes, then we analyze significant genes of BRCA by the Cox model. The model described in this article has better performance than the model without predictors of interactions of miRNA and mRNA. The average C index considering miRNA–target interactions is 0.7, which achieves 84% improvement compared with the model without interactions, which is 0.38.
1. Introduction
Precision medicine is a new approach to treating and preventing diseases that take into account individual genes, climate, and lifestyle variation for each person. Genetic analysis is the foundation of precision medicine. It is key to precision medicine that figures out significant genes of the disease by genes and clinical big data. mRNA, microRNA (miRNA), and miRNA–target interactions all influence the relapse and therapy of diseases.
This article studies significant genes of breast cancer (BRCA). Although much is known about mRNA and miRNA in BRCA, a few studies concerned miRNA–target interactions. Volinia et al. (2013) used a univariate Cox regression and Kaplan–Meier (KM) test to analyze mRNA and miRNA, but they did not consider miRNA–target interactions. miRNA is a noncoding RNA molecule of ∼22 nucleotides. It is involved in the regulation of post-transcriptional gene expression in plants and animals (Bartel, 2004). miRNAs play significant roles in neoplasia, metastasis, and therapeutic effect in different cancers (Friedman et al., 2009; Garzon et al., 2009; Ambros, 2011; Starega-Roslan et al., 2011; Iuliano et al., 2013). miRNAs cannot influence disease independently, they influence disease by regulating mRNAs. So, we should not consider mRNAs and miRNAs independently, we should consider interactions between miRNAs and mRNAs.
In this study, we make a global expression analysis of mRNA and miRNA and their interactions on 626 BRCA cases from The Cancer Genome Atlas (TCGA) by penalized Cox model. Experiments show that the Cox model in this article has better performance than the model without miRNA–target interactions. This article includes the following studies. (1) Properly preprocessing: removing batch effect genes and noncoding mRNAs. (2) Finding differential expression genes of BRCA. (3) Finding miRNA–target interactions. (4) Building an interpretable and stable Cox model by comprehensive analysis of mRNAs, miRNAs, and miRNA–target interactions of BRCA.
The remainder of this article is organized as follows. In Section 2, we introduce the Cox proportional hazards model. In Section 3, we show the methods and tests of the penalized Cox model on real data. In Section 4, we report our results and make discussions.
2. Cox Proportional Hazards Model
Survival analysis is used to model time-to-event data. It reveals relationships between the given covariates and time distributions. Cox proportional hazards model (Cox, 1972) is one of the most common approaches to survival analysis. Cox proportional hazards model is a famous semiparametric model having advantages of parametric and nonparametric models. It is similar to the parametric model in expression form, but it is not influenced by the distribution of parameters of model. Considering the usual survival analysis framework, we have data for the ith observation with the form (yi,Xi,
where
where
Scaled log partial likelihood (m is the number of failure times),
A key feature of genomic data is that dimension p can be much larger than the sample size n, so that traditional methodology cannot be directly applied. To make inferences for a high-dimensional Cox model, a variety of regularization approaches have been proposed. Tibshirani (1997) proposed the Lasso method. Zou and Hastie (2005) proposed an elastic network in linear regression. Park and Hastie (2007) applied elastic network in the Cox model. After that, there are many methods to solve the Cox model (Eq. 1). Simon et al. (2011) solved the Cox model with elastic network by the coordinate descent method. We estimate it by maximizing the partial likelihood as follows.
where
3. Methods
The algorithm proposed in this article is implemented with R. The RNA-Seq, microRNA-Seq, and clinic data were downloaded from TCGA (https://tcga-data.nci.nih.gov/tcga/) in January 2018. We selected 626 BRCA samples with mRNA, miRNA, and clinical data among which 560 samples are censored data, others are uncensored data.
3.1. Data preprocessing
3.1.1. Differential expression gene analysis
Leek et al. (2010) mentioned batch effects may be correlated with an outcome of interest and lead to incorrect conclusions. The batch effect occurs when tests are influenced by laboratory conditions, reagent lots, and variations in staff. So we need to remove batch effects before building the model. Noncoding RNA refers to an RNA sequence that does not encode protein sequences or that can only produce noncoding RNA molecules. Finding differential expression (DE) genes between healthy people and patients is the foundation of precision medicine. DE analysis refers to analyzing the normalized read count data of different experimental groups by statistical methods to discover quantitative changes in expression levels. There are different methods for DE analysis such as edgeR (Robinson et al., 2010) and DESeq (Anders and Huber, 2010) based on negative binomial distributions or baySeq (Hardcastle and Kelly, 2010) and EBSeq (Leng et al., 2013), which are Bayesian approaches based on a negative binomial model. In this article, we use Deseq to analyze DE. First, we remove batch effects (Ritchie et al., 2015) and noncoding mRNAs of the original 20531 mRNAs and 1870 miRNAs. Then we perform differential gene analysis on the processed data. Finally, we get 807 mRNAs and 608 miRNAs.
3.1.2. miRNA–target interactions
miRNAs are a type of noncoding single-stranded RNA molecules of ∼22 nucleotides. They are involved in the regulation of post-transcriptional gene expression in plants and animals. They play important regulatory roles in many biological processes, including differentiation, metabolism, development, and cellular signaling. Thus, identification of miRNA–target mRNAs is important for studying biological processes of disease. There are some miRNA–target tools, such as TargetScan (Agarwal et al., 2015), miRanda (Enright et al., 2003; John et al., 2004; Betel et al., 2008, 2010), TarpmiR (Ding et al., 2016), and miRWalk (Sticht et al., 2018). miRWalk can provide comprehensive prediction and experimentally verified miRNA–mRNA interactions. miRWalk not only records miRNA binding sites within the whole sequence of a gene, but also combines this information with a comparison of binding sites resulting from 12 existing miRNA–target prediction programs to build new comparative platforms of binding sites for the promoter (4 prediction data sets), cds (5 prediction data sets), 5′- (5 prediction data sets), and 3′-UTR (13 prediction data sets) regions. It also documents experimentally verified miRNA–target interaction information collected through an automated text-mining search and data from existing resources (miRTarBase, PhenomiR, miR2Disease, and HMDD) offering such information. We get 77,697 pairs of miRNA–mRNA interactions by miRWalk2.0.
3.2. Analysis based on regularized Cox model
We analyze data modeled by the Cox model with R package glmnet (Hastie and Qian, 2014). Predictor variables are differential mRNAs, miRNAs, and miRNA–target mRNA pairs. The whole data set is randomly split into one training data set and one test data set. The ratio of the training set to the validation set is 3. We use C index to assess the prediction performance of the model, log-rank test, and area under the receiver operating characteristic (ROC) curve (AUC) to assess the discrimination of the model. Harrell et al. (1996) and Pencina and D'Agostino (2004) developed the overall C index as a metric describing the probability of conditional agreement between survival time and predict time. Concordance is defined as Pr (agreement) for any two randomly chosen observations, in this case, agreement means that the observation with shorter survival time also has a larger risk. We compute C index using SurvConcordance function from survival package (Therneau and Lumley, 2014). Log-rank test (Mantel, 1966) compares the differences between KM survival curves.
We build a Cox model using a training set and compute PIs (prognostic indices) of every patient in test set with
4. Results and Disscussions
mRNAs influence overall survival of BRCA, miRNAs are modulators of the cellular processes responsible for cancer that are encoded by mRNAs. Because of these relations, we performed integrated survival analysis on a large BRCA cohort of 626 patients, using genome-wide data for mRNA, miRNA expression, and miRNA–target interactions. We assumed model A is a model that only considers predictors without miRNA–target interactions, and model B is a model that takes miRNA–target interactions into considerations. Because of random subsampling during building the model, the same model has slightly different C index on test in different runs. The average C index is 0.38 in model A and 0.7 in model B when we run models A and B 10 times, respectively. Experiments show model B has better performance than model A.
The following figures show the ROC and KM curves of models A and B in one run. Figure 1 shows ROC curves of model A at different observation times in one run. Figure 2 shows KM curves of model A at different thresholds in one run. Figure 3 shows ROC curves of model B at different observation times in one run. Figure 4 shows KM curves of model B at different thresholds in one run.
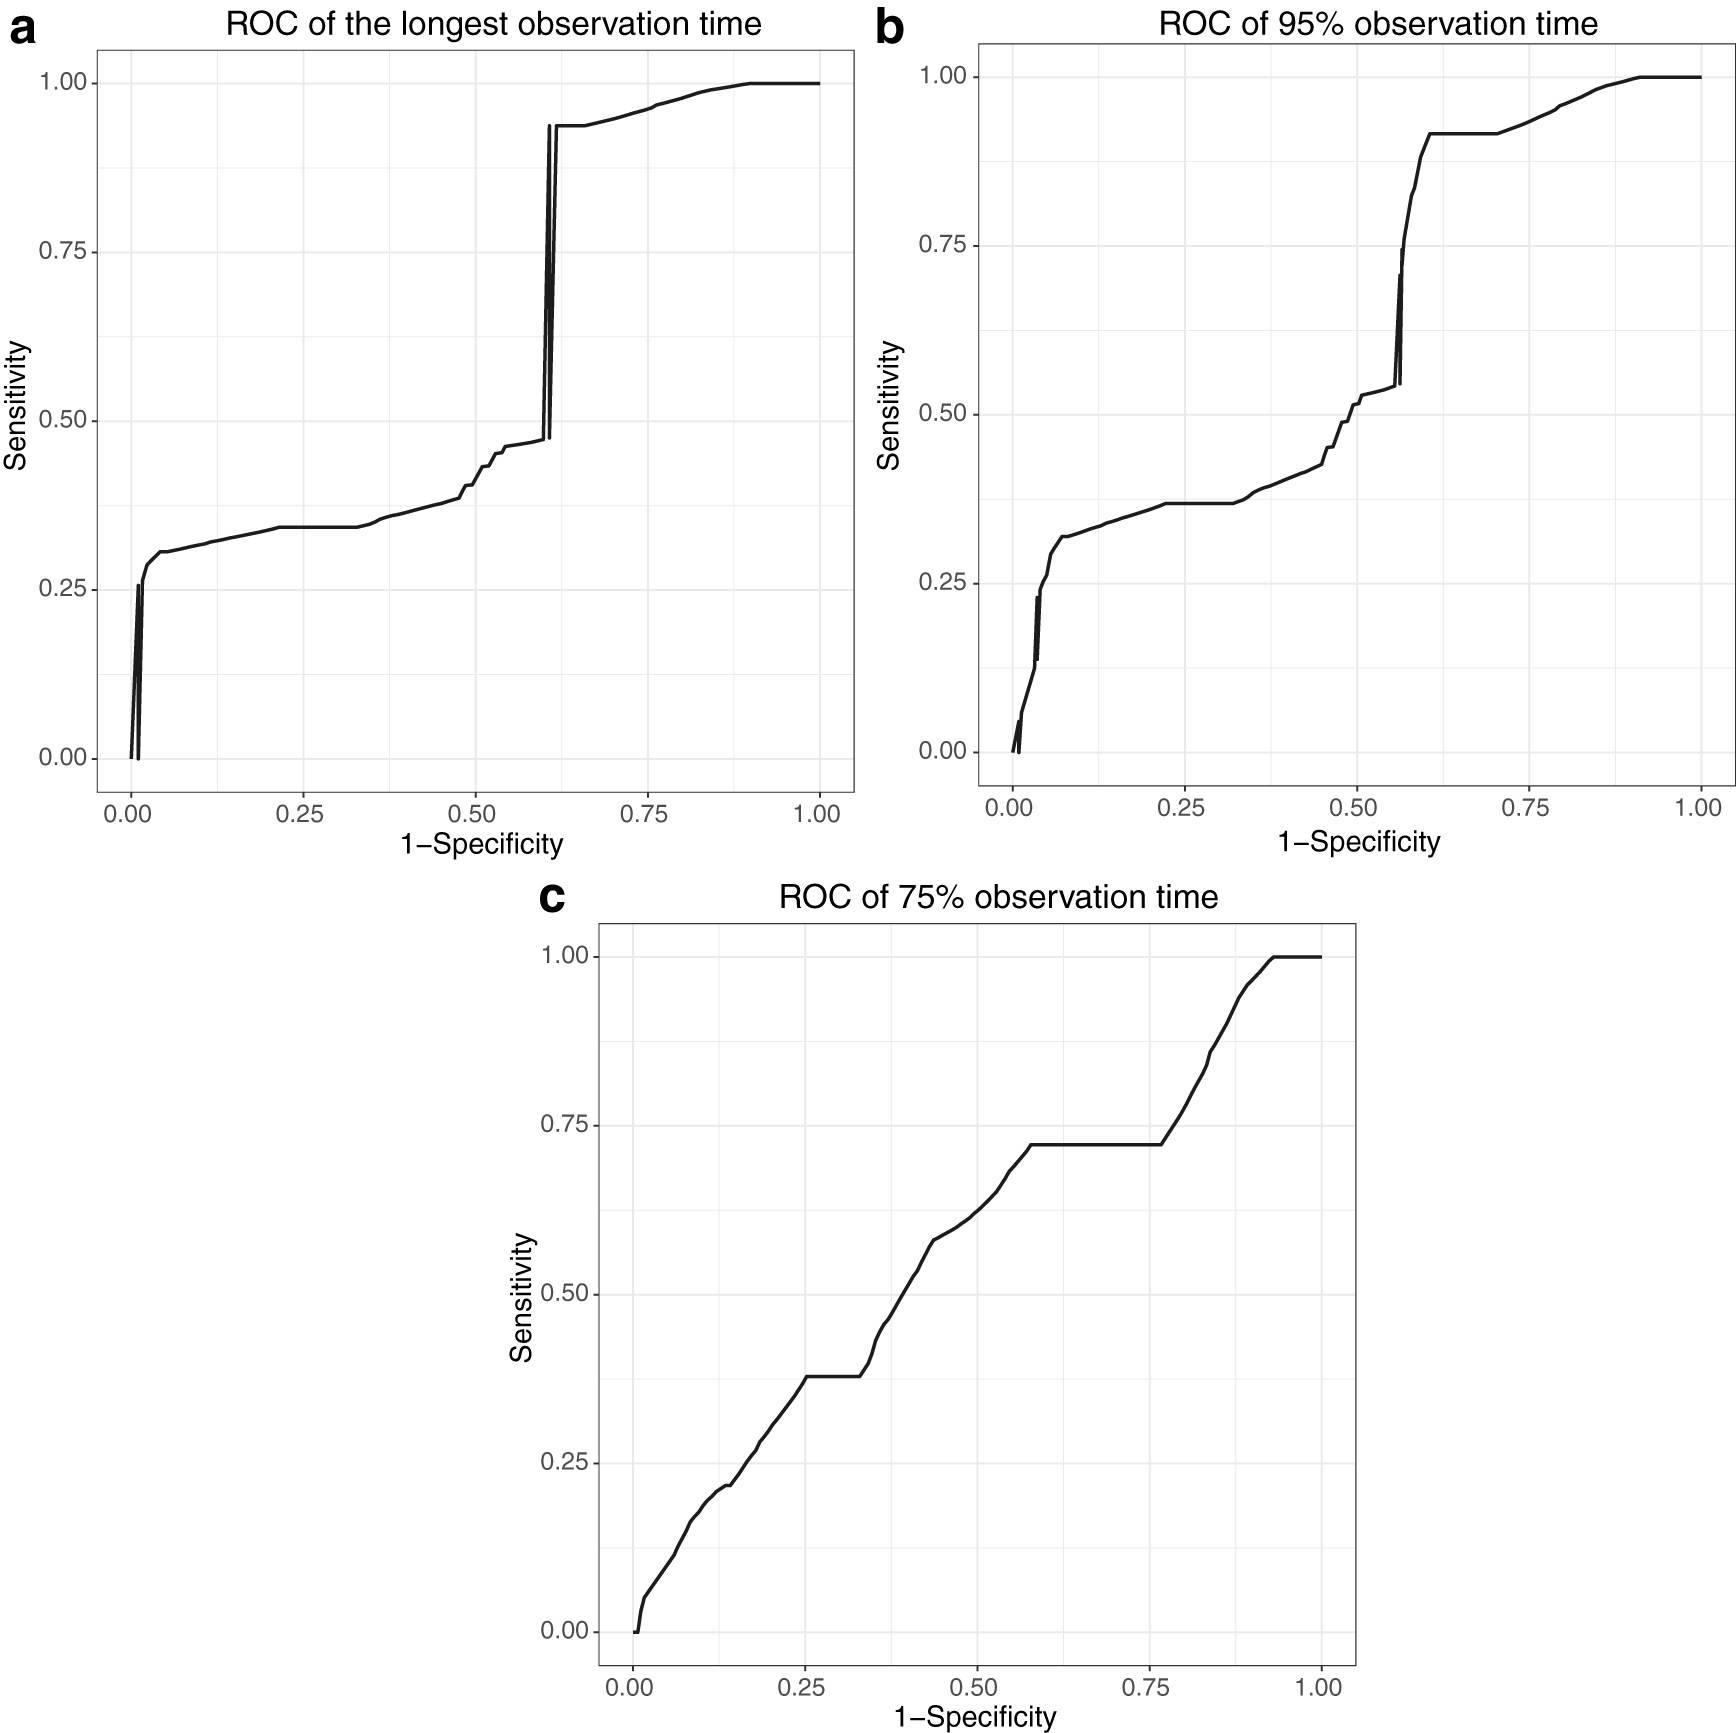
ROC curves of model A.

KM curve of model A.

ROC curves of model B.

KM curves of model B.
Experiments show miRNA–target interactions influence the concordance and discrimination of the model prediction. When we build a gene model for precision medicine, we should consider not only mRNAs and miRNAs, but also miRNA–target interactions. The approaches in this article are not only applicable to BRCA data but also to other disease data.
Footnotes
Acknowledgments
Thanks are due to XiaoDong Cai (University of Miami) for conceiving the idea and Xin Zhou (University of Miami) for valuable discussion.
Author Disclosure Statement
The authors declare they have no conflicting financial interests.
Funding Information
This study is supported by the PhD research promotion project of Communication University of China (No. CUC200D030).