
Abstract
By using next-generation sequencing technologies, it is possible to quickly and inexpensively generate large numbers of relatively short reads from both the nuclear and mitochondrial DNA (mtDNA) contained in a biological sample. Unfortunately, assembling such whole-genome sequencing (WGS) data with standard de novo assemblers often fails to generate high-quality mitochondrial genome sequences due to the large difference in copy number (and hence sequencing depth) between the mitochondrial and nuclear genomes. Assembly of complete mitochondrial genome sequences is further complicated by the fact that many de novo assemblers are not designed for circular genomes and by the presence of repeats in the mitochondrial genomes of some species. In this article, we describe the Statistical Mitogenome Assembly with RepeaTs (SMART) pipeline for automated assembly of mitochondrial genomes from WGS data. SMART uses an efficient coverage-based filter to first select a subset of reads enriched in mtDNA sequences. Contigs produced by an initial assembly step are filtered using the Basic Local Alignment Search Tool searches against a comprehensive mitochondrial genome database and are used as “baits” for an alignment-based filter that produces the set of reads used in a second de novo assembly and scaffolding step. In the presence of repeats, the possible paths through the assembly graph are evaluated using a maximum likelihood model. Additionally, the assembly process is repeated for a user-specified number of times on resampled subsets of reads to select for annotation of the reconstructed sequences with highest bootstrap support. Experiments on WGS data sets from a variety of species show that the SMART pipeline produces complete circular mitochondrial genome sequences with a higher success rate than current state-of-the-art tools, particularly for low-coverage WGS data sets.
1. Introduction
The mitochondria are cellular organelles often called the powerhouses of the cell due to their key role in the production of ATP. Found in nearly all eukaryotic organisms, the mitochondria have their own circular genomes. They are inherited maternally in most animals and are typically present in thousands of copies in the cytoplasm of each cell, although the copy number varies between cells of different tissues (Veltri et al., 1990). Single nucleotide polymorphisms in mitochondrial genomes have long been used for tracking human migrations (Alves-Silva et al., 2000). Mitochondrial DNA (mtDNA) mutations and heteroplasmy (simultaneous presence of multiple mitochondrial sequences in an individual) have also been associated with human diseases (Stewart and Chinnery, 2015). Moreover, mtDNA analysis can be a useful tool in forensics, especially when a crime scene sample contains degraded DNA not suitable for nuclear DNA tests (Melton et al., 2012). Last but not least, mitochondrial genome sequences are commonly used for evolutionary studies of non-model species for which nuclear genomes are not yet available (Kurabayashi and Sumida, 2013).
mtDNA can be experimentally separated from the nuclear DNA and sequenced independently, but such protocols are laborious (Al-Nakeeb et al., 2017). More commonly, the mitogenomes are assembled from whole-genome sequencing (WGS) data, which consist of reads generated from both the nuclear and mitochondrial genomes. Unfortunately, assembling WGS data with standard de novo assemblers often fails to generate high-quality mitochondrial genome sequences due to the large difference in copy number (and hence sequencing depth) between the mitochondrial and nuclear genomes (Hahn et al., 2013). This has led to the development of specialized tools for reconstructing mitochondrial genomes from WGS data.
Although assembly of mitochondrial genomes from long-read WGS data has been demonstrated (Soorni et al., 2017), the high coverage required (>50 × ) and the relatively high cost of long-read sequencing make this approach uncommon. Consequently, tools for mtDNA assembly have focused on the most abundant type of WGS data currently available, which consist of relatively short reads, typically around 100 bp. These tools can be grouped into three main categories: reference-based, seed-and-extend, and de novo assembly. Reference-based methods such as MToolBox (Calabrese et al., 2014) require the mtDNA sequence of the species of interest or a closely related species. These approaches have the lowest running time and memory requirements but cannot be used for non-model organisms for which such a reference is not available.
MITObim (Hahn et al., 2013) and NOVOPlasty (Dierckxsens et al., 2017) are two tools that implement the seed-and-extend approach for reconstructing circular organelle genomes including mitogenomes (MITObim also implements reference-based assembly). The results in Hahn et al. (2013) show that the seed-and-extend approach can successfully assemble mitochondrial genome sequences starting from a very short seed such as the sequence of the cytochrome c oxidase subunit I (COI) gene, which is commonly used as a DNA barcode for animals (Hebert et al., 2003) and is widely available for numerous species (Ratnasingham and Hebert, 2007). However, due to their inherently greedy approach, the seed-and-extend methods have difficulty in handling repetitive regions present in some mitochondrial genomes (Kurabayashi and Sumida, 2013). Norgal (Al-Nakeeb et al., 2017) is a recent tool implementing a de novo approach to mitochondrial genome reconstruction from WGS data, without the need for either a reference or a seed sequence. A similar approach is used by plasmidSPAdes (Antipov et al., 2016) for de novo assembly of circular plasmid genomes from WGS data. Although these tools are broadly applicable, they can have prohibitive running times and may still fail to reconstruct complete mitogenomes, particularly in the presence of repeats shared between the nuclear and organelle genomes (Antipov et al., 2019).
In this article, we describe the Statistical Mitogenome Assembly with RepeaTs (SMART) pipeline for de novo assembly of mitochondrial genome sequences from WGS data. To ensure a high assembly success rate even from low-coverage WGS data and in the presence of repeats, SMART employs several novel techniques. First, SMART uses an initial coverage-based filtering step to enrich for mtDNA reads. Although coverage-based filtering has been previously used in de novo pipelines such as Norgal (Al-Nakeeb et al., 2017) and plasmidSPAdes (Antipov et al., 2016), the approach taken in SMART is different. Norgal and plasmidSPAdes attempt to remove reads from the nuclear genome by performing an assembly of the full set of reads and then using the read coverage of the longest contigs to estimate the coverage of the nuclear genome. In contrast, SMART estimates the mean and standard deviation of mtDNA k-mer counts in WGS reads based on a seed sequence and then positively selects reads with observed k-mer counts falling within three standard deviations of the estimated mean. As shown in Section 3, the positive selection approach of SMART is robust to large variations in mtDNA read content and yields higher enrichment for mtDNA reads than the negative selection implemented by Norgal for low-depth WGS data sets. Furthermore, positive selection based on k-mer counting removes the need to assemble all WGS reads, a CPU, and memory intensive step required by Norgal and plasmidSPAdes.
Second, SMART iteratively refines the set of selected reads and uses a maximum likelihood model to increase assembly accuracy. Reads passing the coverage-based filter are assembled using Velvet to generate a preliminary set of contigs. Preliminary contigs are themselves filtered using the Basic Local Alignment Search Tool (BLAST) searches against a comprehensive mitochondrial genome database to extract likely mitochondrial contigs, which are then used as “baits” for an alignment-based filter that produces a refined set of reads used in a second de novo assembly and scaffolding step using SPAdes (Bankevich et al., 2012) and SSPACE (Boetzer et al., 2010). This process is repeated if the assembly graph is not Eulerian, and in the presence of repeats, the possible paths through the assembly graph are evaluated using the assembly likelihood evaluation (ALE) maximum likelihood model (Clark et al., 2013). Finally, the assembly process is repeated for a user-specified number of times on re-sampled subsets of reads to select for annotation of the assembled sequences with highest bootstrap support.
2. Methods
2.1. Statistical Mitogenome Assembly with RepeaTs pipeline interface
The SMART pipeline is publicly available at https://neo.engr.uconn.edu/?tool_id=SMART through an easy-to-use web interface deployed on a customized instance of the Galaxy framework (Afgan et al., 2018). The pipeline was designed for processing paired-end WGS reads in fastq format. In addition to the fastq files, the user specifies the sample name and a seed sequence in fasta format. Optional parameters include the number of bootstrap samples (default 1), the number of read pairs per bootstrap sample (default 10,000,000), the k-mer size (default 31), the number of CPU threads (default 16), and the genetic code to be used for annotation (default: vertebrate mitochondrial code). All experimental results in Section 3 used the default settings, unless otherwise indicated.
Upon successful completion, SMART generates three files:
A zip file including the assembled sequence in fasta and GenBank formats as well as annotation files generated using MITOS (Bernt et al., 2013). When bootstrapping is used, annotations are generated for the consensus sequence of each cluster of bootstrap samples, as detailed below. A detailed pdf report that includes statistics and visualizations of various pipeline steps and the final mitogenome annotations. A detailed log file that contains additional information including timing for each pipeline step.
2.2. Seed selection
Similar to the seed-and-extend tools such as MITObim (Hahn et al., 2013) and NOVOPlasty (Dierckxsens et al., 2017), SMART requires as input a seed sequence. However, unlike MITObim and NOVOPlasty, SMART uses the seed sequence only for estimating mtDNA k-mer coverage and implementing an efficient coverage-based read filter—all assembly steps are performed de novo using Velvet (Zerbino and Birney, 2008) and SPAdes (Bankevich et al., 2012). As shown in Section 3, high-quality mitogenome sequences can be obtained using seed sequences as short as a few hundred bases. Additionally, although seed sequences from the same species are preferable, assembly can succeed even with seeds from closely related species. For ease of use, SMART includes a tool for importing to Galaxy seed sequences from GenBank based on their accession number. A widely available seed sequence is the COI mitochondrial gene, which is commonly employed as a DNA barcode for species identification (Hebert et al., 2003). The largest repository of COI sequences is the Barcode of Life Data System (BOLD) (Ratnasingham and Hebert, 2007), which, as of December 2019, includes 1,880,132 public barcode sequences from 175,144 animal species.
2.3. Statistical Mitogenome Assembly with RepeaTs workflow
The main stages of the SMART pipeline (Fig. 1) are as follows:
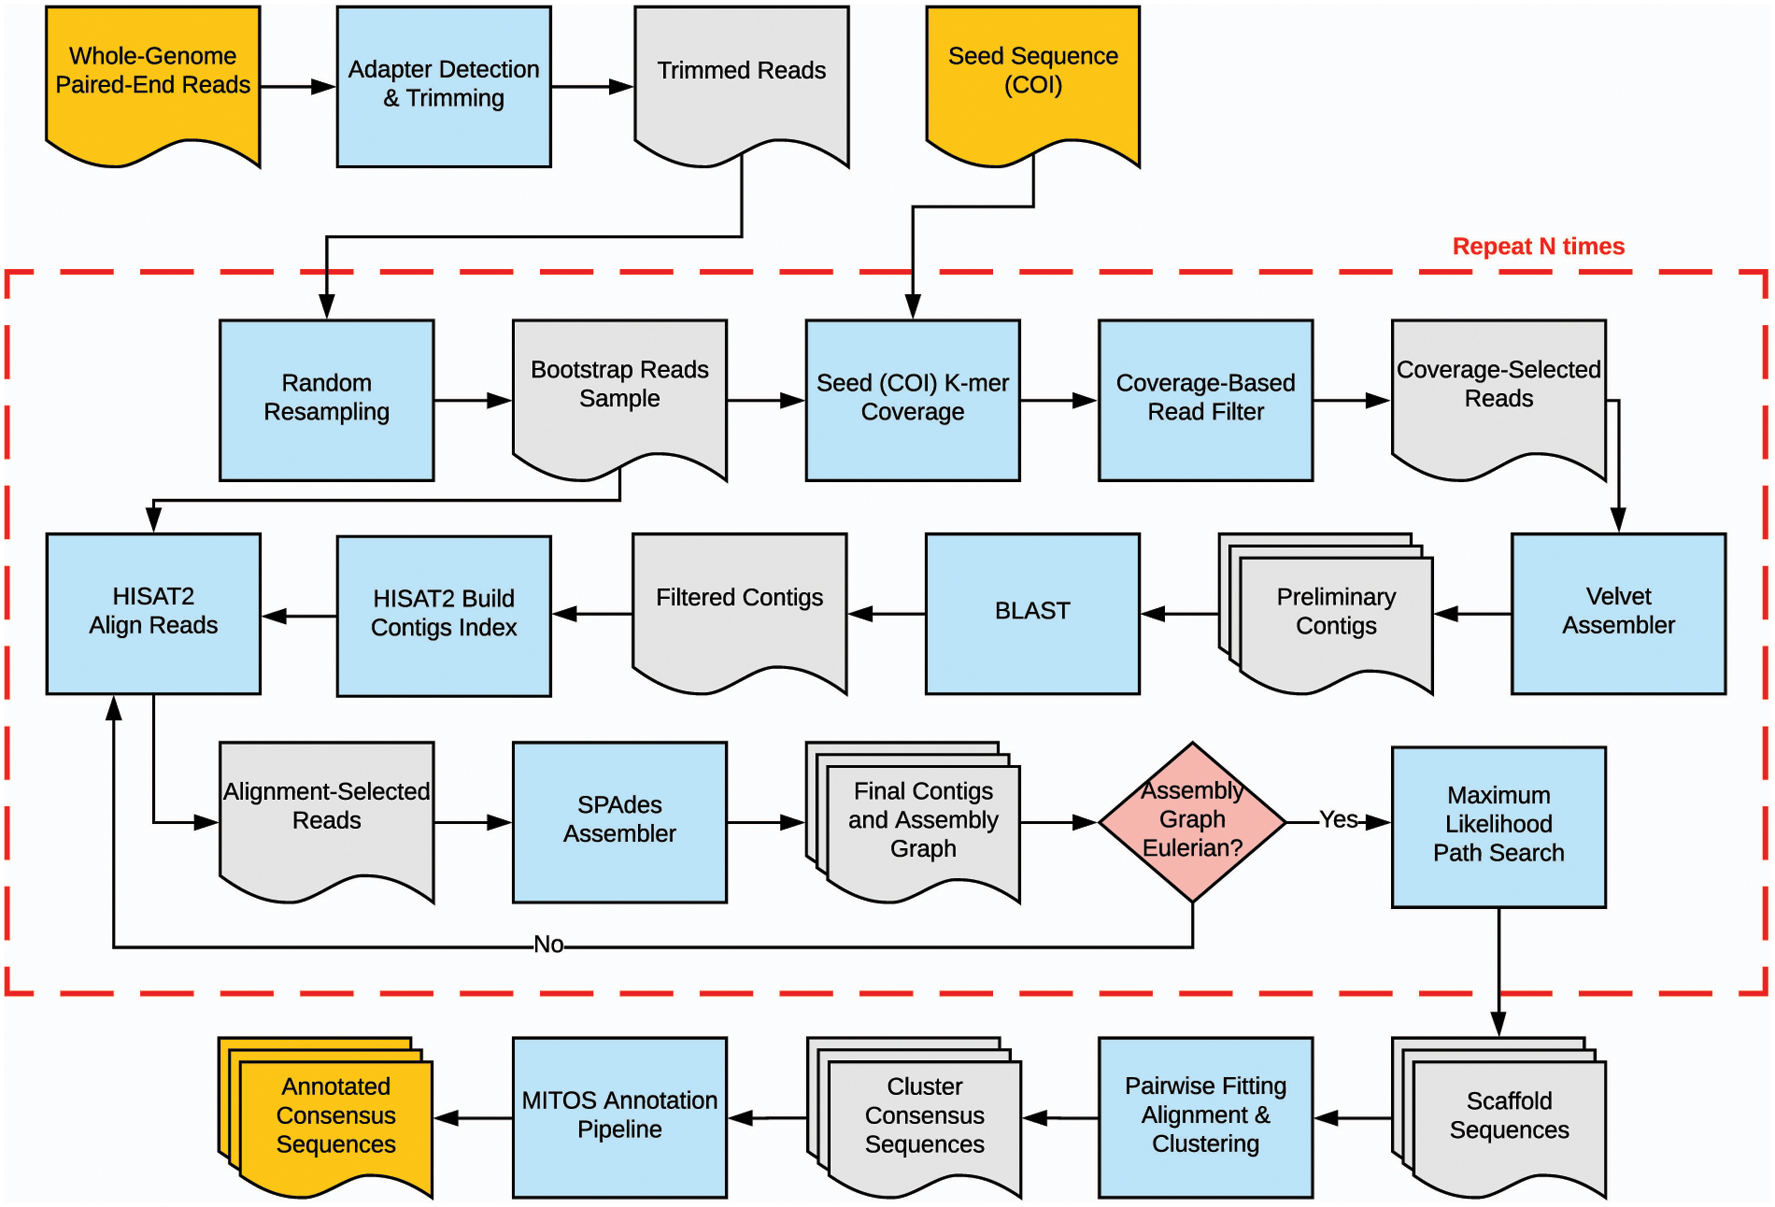
SMART pipeline flowchart. SMART, Statistical Mitogenomes Assembly with RepeaTs.
Automatic adapter detection and trimming.
Random re-sampling of a user-specified number of trimmed read pairs.
Coverage-based filtering of the reads based on the seed sequence.
Preliminary assembly of reads passing the coverage filter.
Filtering of preliminary contigs by BLAST searches against a local mitochondrial database.
Secondary read filtering by alignment to preliminary contigs that have significant BLAST matches.
Secondary de novo assembly.
Iterative scaffolding and gap filling based on maximum likelihood.
Prediction and annotation of mitochondrial genes.
By default, the above process is executed only once, but SMART users can specify the number of times steps 2–8 should be repeated to compute the bootstrap support for the assembled sequences. When the number of bootstrap samples is greater than one, the resulting sequences are clustered based on their pairwise edit distances, and the annotation step is performed on the consensus sequence obtained for each cluster. Details on each of the workflow steps are provided below.
2.3.1. Adapter detection and trimming
Due to variability in sample quality and library preparation protocols, next-generation sequencing data can include substantial amounts of sequencing errors and other technical artifacts such as adapter contamination. Since such artifacts can negatively impact downstream analyses including de novo assembly, there are numerous tools that can be used for quality checking and filtering WGS data. However, many of these tools require interactive user intervention (Andrews, 2010; Patel and Jain, 2012). To minimize user involvement, SMART incorporates a strategy for automatic adapter detection and removal. Specifically, we detect and trim adapters using tools included in the IRFinder package (Middleton et al., 2017). These tools take advantage of the fact that for paired-end WGS data adapter sequences are included in both reads when the target DNA fragment is shorter than the read length. This allows highly accurate automatic identification of adaptor sequences from a small data sample as well as confident detection and precise trimming even for reads that contain just a few adapter bases.
2.3.2. Random read re-sampling
After adapter trimming, SMART generates a user-specified number of bootstrap samples by re-sampling. These samples are generated using the FASTQ-SAMPLE tool from the FASTQ-TOOLS package (Jones, 2012).
2.3.3. Coverage-based read filtering
The aim of this step is to filter out nuclear reads by taking advantage of the difference in copy number between the nuclear and mitochondrial genomes. Due to this difference, the counts of k-mers that originate from the mitochondrial genome are expected to be much higher than that of k-mers from the nuclear genome, with the possible exception of k-mers that originate from nuclear genome repeats with similar copy number. To implement a filter based on this observation, we use the Jellyfish package (Marçais and Kingsford, 2011) to efficiently count the number of times each k-mer appears in the reads of the bootstrap sample. To account for sequencing errors and low degrees of dissimilarity between the sequenced mitogenome and the seed sequence, for each k-mer of the seed sequence, we augment the observed Jellyfish count by adding the counts of the k-mers at Hamming distance one. Although most seed sequence k-mers are expected to have high augmented counts, k-mers from regions of the seed sequence that have high dissimilarity to the homologous region of the sequenced mitogenome will still have zero or near-zero augmented counts. Consequently, we run MCLUST (Scrucca et al., 2016) to fit a two-component Gaussian mixture model to the one-dimensional distribution of augmented k-mer counts and use the mean μ and standard deviation σ of the upper component as the estimate for the corresponding mtDNA k-mer count statistics.
To efficiently extract putative mitochondrial reads, a hash table is populated with all read k-mers (not just seed sequence k-mers) that have a count within 3 standard deviations of the estimated mtDNA k-mer count mean, that is, all k-mers x for which
A read of length l in the bootstrap sample is then considered to be of mitochondrial origin if at least l−(2k − 1) of its k-mers are found in the hash table, that is, satisfy (1). We allow up to 2k − 1 of the k-mers to violate (1) to ensure that we retain mitochondrial reads with a single sequencing error since such an error can create up to 2k − 1 “novel” k-mers that would not match the expected count distribution. Both reads in a pair must satisfy this test in order for the pair to be kept; if either one of the reads or both fail the test the pair is removed. Experimental results in the next section show that the coverage-based filter typically leads to a substantial enrichment in mitochondrial reads, even when the coverage estimates are based on relatively few reads and short seed sequences.
2.3.4. Preliminary assembly
The goal of this step is to generate longer contigs from the enriched set of mitochondrial reads that pass the coverage-based filter. For time and memory usage efficiency, we use Velvet (Zerbino and Birney, 2008), a fast short-read assembler based on de Bruijn graphs. Since some nuclear genome reads are expected to pass the coverage-based filter, the output of Velvet is typically a mixture of mitochondrial and nuclear genome contigs.
2.3.5. Preliminary contig filtering
The aim of this step is to filter out nuclear genome contigs. This is accomplished by searching each contig against a local database of 8376 complete eukaryotic mitogenomes downloaded from The National Center for Biotechnology Information (NCBI) by using nucleotide–nucleotide BLAST 2.7.1+. As a result of this step, we retain only contigs that have hits with an E-value of 10−10 or less.
2.3.6. Alignment-based read filtering
In this step, SMART identifies additional mitochondrial reads that are missed by the coverage filter using an alignment-based approach reminiscent of the seed-and-extend methods. To implement this step efficiently, we build an index for the contigs with significant BLAST matches and then align all bootstrap reads against the index by using HISAT2, a fast and sensitive aligner for next-generation sequencing reads (Kim et al., 2017). Since the set of preliminary contigs is likely incomplete, both reads in a pair are kept even when only one of them is aligned. Specifically, all reads in a bootstrap sample are aligned using HISAT2 as single reads, and the union of all read IDs is given to the SEQTK tool (Li, 2019) to pull from the bootstrap sample the read pairs that have at least one of the reads aligned.
2.3.7. Secondary assembly
The goal of this step is to assemble a high-quality mitochondrial sequence using the reads that pass the alignment-based filter. SMART performs the secondary assembly using SPAdes, a multi-kmer de Bruijn graph assembler with robust performance even in the presence of non-uniformities in read coverage (Bankevich et al., 2012).
Since mitochondrial genomes are circular, SMART checks if the result of SPAdes assembly is an Eulerian graph using a custom python script. If so, SMART moves to the scaffolding step, otherwise it repeats the alignment-based read filtering and secondary assembly for up to five iterations. As a result of these iterations, the number of selected reads and the length of the assembled contigs typically increase.
2.3.8. Scaffolding
When SPAdes produces an Eulerian assembly graph or the maximum number of iterations is reached, SMART begins the scaffolding step. SMART generates all paths of the Eulerian graph using a depth-first approach. For each explored path, SMART generates a scaffold sequence by trying to overlap adjacent contigs or closing gaps between contigs using SSPACE (Boetzer et al., 2010). To select the most likely assembly, SMART uses the ALE tool (Clark et al., 2013) to compute the likelihood of each scaffold sequence and outputs the sequence with maximum likelihood. The ALE likelihood model is based on four subscores: placement scoring takes into account how well read sequences agree with the scaffold sequence, insert scoring assesses how well insert lengths implied by the alignments of paired reads match the expected insert length distribution, depth scoring reflects how well the read depth at each location agrees with the depth expected after GC-bias correction, and k-mer scoring shows how well k-mer counts of each contig match the multinomial distribution estimated from the entire assembly. The ALE likelihood assessment is particularly useful for selecting high-confidence assemblies when the Eulerian graph has duplicated contigs.
2.3.9. Clustering
When the user chooses to use multiple bootstrap samples, SMART consolidates the results and computes the bootstrap support for the final set of sequences. The output of each run is either a circular scaffold sequence or a linear scaffold sequence in case the assembly graph is not Eulerian. Furthermore, the scaffold sequences produced in each run may be generated from either the forward or reverse strands. The first step in the SMART consolidation process is to compute for each pair of scaffold sequences, an alignment score that accommodates any combination of circular and linear sequences and is invariant to strand choice and rotations of the circular sequences when present. This is performed by using dynamic programming to compute the optimal fitting alignment under the edit distance scores between a duplicated version of the longest sequence (arbitrarily linearized in case it is circular) and both the shortest sequence (again arbitrarily linearized in case it is circular) and its Watson–Crick complement. The smaller of the two edit distances, which is computed in time proportional to the product between the lengths of the two sequences, has the desired invariance properties. Indeed, the duplicated sequence contains as substrings all possible linearizations of the longest string and the fitting alignment algorithm finds the substring that has minimum edit distance to the (arbitrarily selected) linearization of the second string. By computing the fitting alignment against both the shortest string and its Watson–Crick complement, we ensure that one of the computations has the two strings in compatible orientations.
Once all pairwise distances are computed, SMART runs the hierarchical clustering algorithm implemented by the hclust R package and automatically cuts the resulting dendrogram into clusters using a 95% identity cutoff. Sequences within each cluster are flipped to the same strand and rotated to a consistent linearization using MARS (Ayad and Pissis, 2017). Finally, SMART runs the MAFFT multiple sequences alignment tool (Katoh et al., 2002) to generate a consensus sequence for each cluster.
2.3.10. Annotation
Each cluster consensus sequence is annotated using the MITOS de novo mitochondrial genome annotation pipeline (Bernt et al., 2013), which identifies protein coding genes based on BLAST searches against previously annotated protein sequences and annotates tRNA and rRNA genes based on manually curated covariance models capturing both sequence and secondary structure similarity to known sequences. MITOS can annotate species that use one of these mitochondrial genetic codes: vertebrate, mold/protozoan/coelenterate, invertebrate, echinoderm/flatworm, ascidian, and alternative flatworm.
3. Results and Discussion
3.1. Data sets
To compare SMART with prior methods and assess its effectiveness, we used two groups of data sets. The first group, composed of eight human data sets, was used for a detailed assessment, including evaluation of the accuracy of various read filtering strategies and comparison with previous methods. Accession numbers and basic statistics for the human data sets are provided in Table 1. Six of the human data sets were generated using the WGS strategy, whereas the other two data sets were generated using whole-exome sequencing, a sequencing protocol that has been previously shown to yield sufficient reads for mitogenome reconstruction using a reference-based approach (Picardi and Pesole, 2012). The second group (Table 2) consists of WGS data sets from 11 nonhuman species with published reference mitogenomes. These species are spanning the tree of life, including a primate data set (Pan troglodytes), three other mammals (Canis lupus, Capra hircus, and Mus musculus), a bird (Grus japonensis), three frogs (Rana temporaria, Pyxicephalus adspersus, and Xenopus laevis), an insect (Phlebotomus papatasi), a plant (Saccharina japonica), and a fungus (Aspergillus niger).
Human Whole-Genome Sequencing and Whole-Exome Sequencing Data sets Used in Evaluation Experiments
The number of read pairs varied between 2.5M and 25M. Unless otherwise noted, the 386 bp long human COI sequence with GenBank accession KC750830 was used as seed. mtDNA content was assessed by aligning the reads against the mtDNA sequence published for each sample by 1KGP.
1KGP, 1000 Genomes Project; COI, cytochrome c oxidase subunit I; mtDNA, mitochondrial DNA; WES, whole-exome sequencing; WGS, whole-genome sequencing.
Nonhuman Whole-Genome Sequencing Data sets Used in Evaluation Experiments, Including the Number of Read Pairs and Accession Numbers of COI Sequences Used as Seeds for the SMART Runs and the Reference Used for Assessing Assembly Accuracy
mtDNA content was assessed by aligning the reads against the indicated reference sequence.
Since the human data sets originate from individuals sequenced as part of the 1000 Genomes Project (1KGP), the mtDNA sequences reconstructed by 1KGP were used as ground truth for assessing accuracy. For nonhuman data sets, we assessed accuracy by using as ground truth, the published mtDNA sequences with accession numbers listed in the last column of Table 2. The published mitogenomes provide a close (although not perfect) approximation for the mitogenome sequences of the specimens used to generate the sequencing data.
A notable feature of the considered data sets is the highly variable percentage of reads of mitochondrial origin, estimated to range from 0.004% for P. adspersus to over 4% for A. niger. This percentage was estimated by aligning to the respective ground truth mtDNA sequence 25M read pairs (or the entire data set if composed of fewer than 25M read pairs) using Bowtie 2 (Langmead and Salzberg, 2012). The variability is not entirely a species effect—indeed, differences of more than an order of magnitude can be observed in the percentage of mtDNA reads of the human data sets in Table 1. Most likely, other important contributing factors to this variability include DNA extraction and library preparation protocols (Longchamps et al., 2019), the tissue of origin (Veltri et al., 1990), and the developmental stage of the sample (Aiken et al., 2008).
3.2. Read filtering accuracy
Figure 2 compares the accuracy of the read filter employed by Norgal with that of the coverage- and alignment-based filters of SMART on the human data sets described in Table 1. For each sequencing run, we subsampled between 2.5M and 25M read pairs from the full data set by using the FASTQ-SAMPLE tool from the FASTQ-TOOLS package (Jones, 2012). For the 2.5M read pairs data sets, Norgal's filter fails to select any mitochondrial reads on all but one of the runs. Although the Norgal filter's performance improves somewhat at higher sequencing depth, with three of the eight runs achieving a non-zero true positive rate (TPR) for 25M read pairs, its positive predictive value (PPV) remains close to zero, showing that the vast majority of reads that pass the Norgal filter have nuclear origin.

Assessment of read filtering accuracy for human data sets with 2.5M–25M read pairs.
Compared with Norgal, the coverage-based filter of SMART performs much better at all sequencing depths. It has positive TPR on all data sets and at all sequencing depths, with the average TPR increasing from 0.575 ± 0.192 for 2.5M pairs to 0.711 ± 0.183 for 25M pairs. The filter also has better average PPV than Norgal, ranging from 0.173 ± 0.259 for 2.5M pairs to 0.192 ± 0.258 for 25M pairs, although many filtered read sets still contain large numbers of reads of nuclear origin and the variability in PPV is quite high. The coverage-based filter's accuracy is likely to be negatively impacted by sequencing coverage non-uniformities along the mitochondrial genome (Ekblom et al., 2014) as well as the presence in the nuclear genome of repeats with similar copy number. Both these problems are mitigated by SMART's alignment-based filter, which has dramatically improved accuracy. Indeed, the average TPR of SMART ranges from 0.79 ± 0.222 for 2.5M pairs to 0.916 ± 0.168 for 25M pairs, with PPVs ranging from 0.728 ± 0.172 to 0.708 ± 0.292, respectively.
3.3. Comparison with other tools
Table 3 reports the percentage identity, computed using Mauve (Darling et al., 2004), between the sequences reconstructed by each compared method on the human data sets described in Table 1 and the 1KGP ground truth. For each method and each data set, the percentage identity is typeset in bold when the reconstructed sequence is a complete circular genome. Besides Norgal, NOVOPlasty, PlasmidSPAdes, and SMART, we also ran MITObim in de novo mode, but none of the MITObim runs completed successfully. Detailed commands for the compared methods are included in the Supplementary Material. The results in Table 3 show that, when runs are successful, the quality of the mitogenomes produced by Norgal, NOVOPlasty, PlasmidSPAdes, and SMART is very high. However, the success rates of different tools vary substantially. Norgal was successful in only 3 of the 32 runs (1 with 10M read pairs and 2 with 25M pairs) and none of the 3 assembled sequences was circular.
Assembly Accuracy Comparison on Human Data sets
The percentage identity to the 1KGP reference, computed using Mauve (Darling et al., 2004) for each method and each data set, is typeset in bold when the reconstructed sequence is a complete circular genome.
Consistent with the very low read filtering PPV reported in Figure 2, in 19 of the runs, Norgal generated nuclear contigs. NOVOplasty performed better, with 7 successful runs out of 32, and 6 of the 7 successful runs producing circular sequences. PlasmidSPAdes was successful in half of the runs, with 11 of the 16 successful runs producing circular mitogenomes. However, PlasmidSPAdes also had the highest running time, with four of the runs being stopped after 14 days. PlasmidSPAdes, which uses a negative read filtering strategy similar to Norgal's, also generated nuclear contigs in a large number of runs (11 of 32). SMART had the highest success rate on the human data sets, with 26 successful runs, of which, all but one produced circular sequences. For all methods, the success rate appears to increase with the sequencing depth; however, SMART outperforms the other methods at each of the considered sequencing depths.
3.4. Seed effect
A limitation that SMART shares with the seed-and-extend methods (Hahn et al., 2013) is the fact that it requires previous knowledge regarding the organism of interest in the form of a seed sequence. However, SMART uses the seed only to estimate the distribution of mtDNA k-mer counts and then extracts mtDNA reads based on their k-mer coverage instead of retrieving reads based on overlap with the seed sequence. We expect the SMART approach to work even with very short seed sequences, such as the COI gene, and with seed sequences from other species. To assess the effect of seed sequence length and degree of dissimilarity, we ran SMART on 2.5M–25M read pairs randomly sampled from WGS run ERR020236 and using seed sequences of varying length and origin. Details on these seed sequences, including their lengths and accession numbers, are given in Table 4. In addition to four human COI gene sequences of 386–1542 bp downloaded from the GenBank database at the NCBI and the BOLD, we included in the comparison a 386 bp COI sequence from the 1KGP individual that was the source of the WGS sequencing data and six COI sequences from four other primate species: three COI sequences from P. troglodytes and one sequence each from Pan paniscus, Gorilla gorilla, and Gorilla beringei.
Seed Sequences Used to Assess Accuracy of SMART Read Filters on Data sets with 2.5M–25M Read Pairs Randomly Selected from Whole-Genome Sequencing Run ERR020236
BOLD, Barcode of Life Data System; NCBI, The National Center for Biotechnology Information.
Figure 3 shows the number of mitochondrial (true positives or TP) and nuclear (false positive or FP) read pairs that pass the coverage- and alignment-based SMART filters, respectively. For all sequencing depths, the use of human seeds leads to recovery of almost all mitochondrial reads following the alignment-based filter, with relatively few FPs. For nonhuman seeds, the low sensitivity of the coverage-based filter leads to more variable performance of the alignment-based filter, although the number of FPs remains low. As shown in Figure 3 by the seed labels typeset in bold, SMART succeeded in assembling a complete circular mtDNA genome using all five human seeds, regardless of seed length and sequencing depth. SMART has a less-consistent but still high success rate at assembling complete circular mtDNA genomes when using seeds from related species. All reconstructed sequences had an overall average of 99.96% identity to the mitochondrial genome published by 1KGP for individual HG00501 as computed by Mauve (Darling et al., 2004); the average percent identity is 99.98% for mitogenomes reconstructed using human seeds.
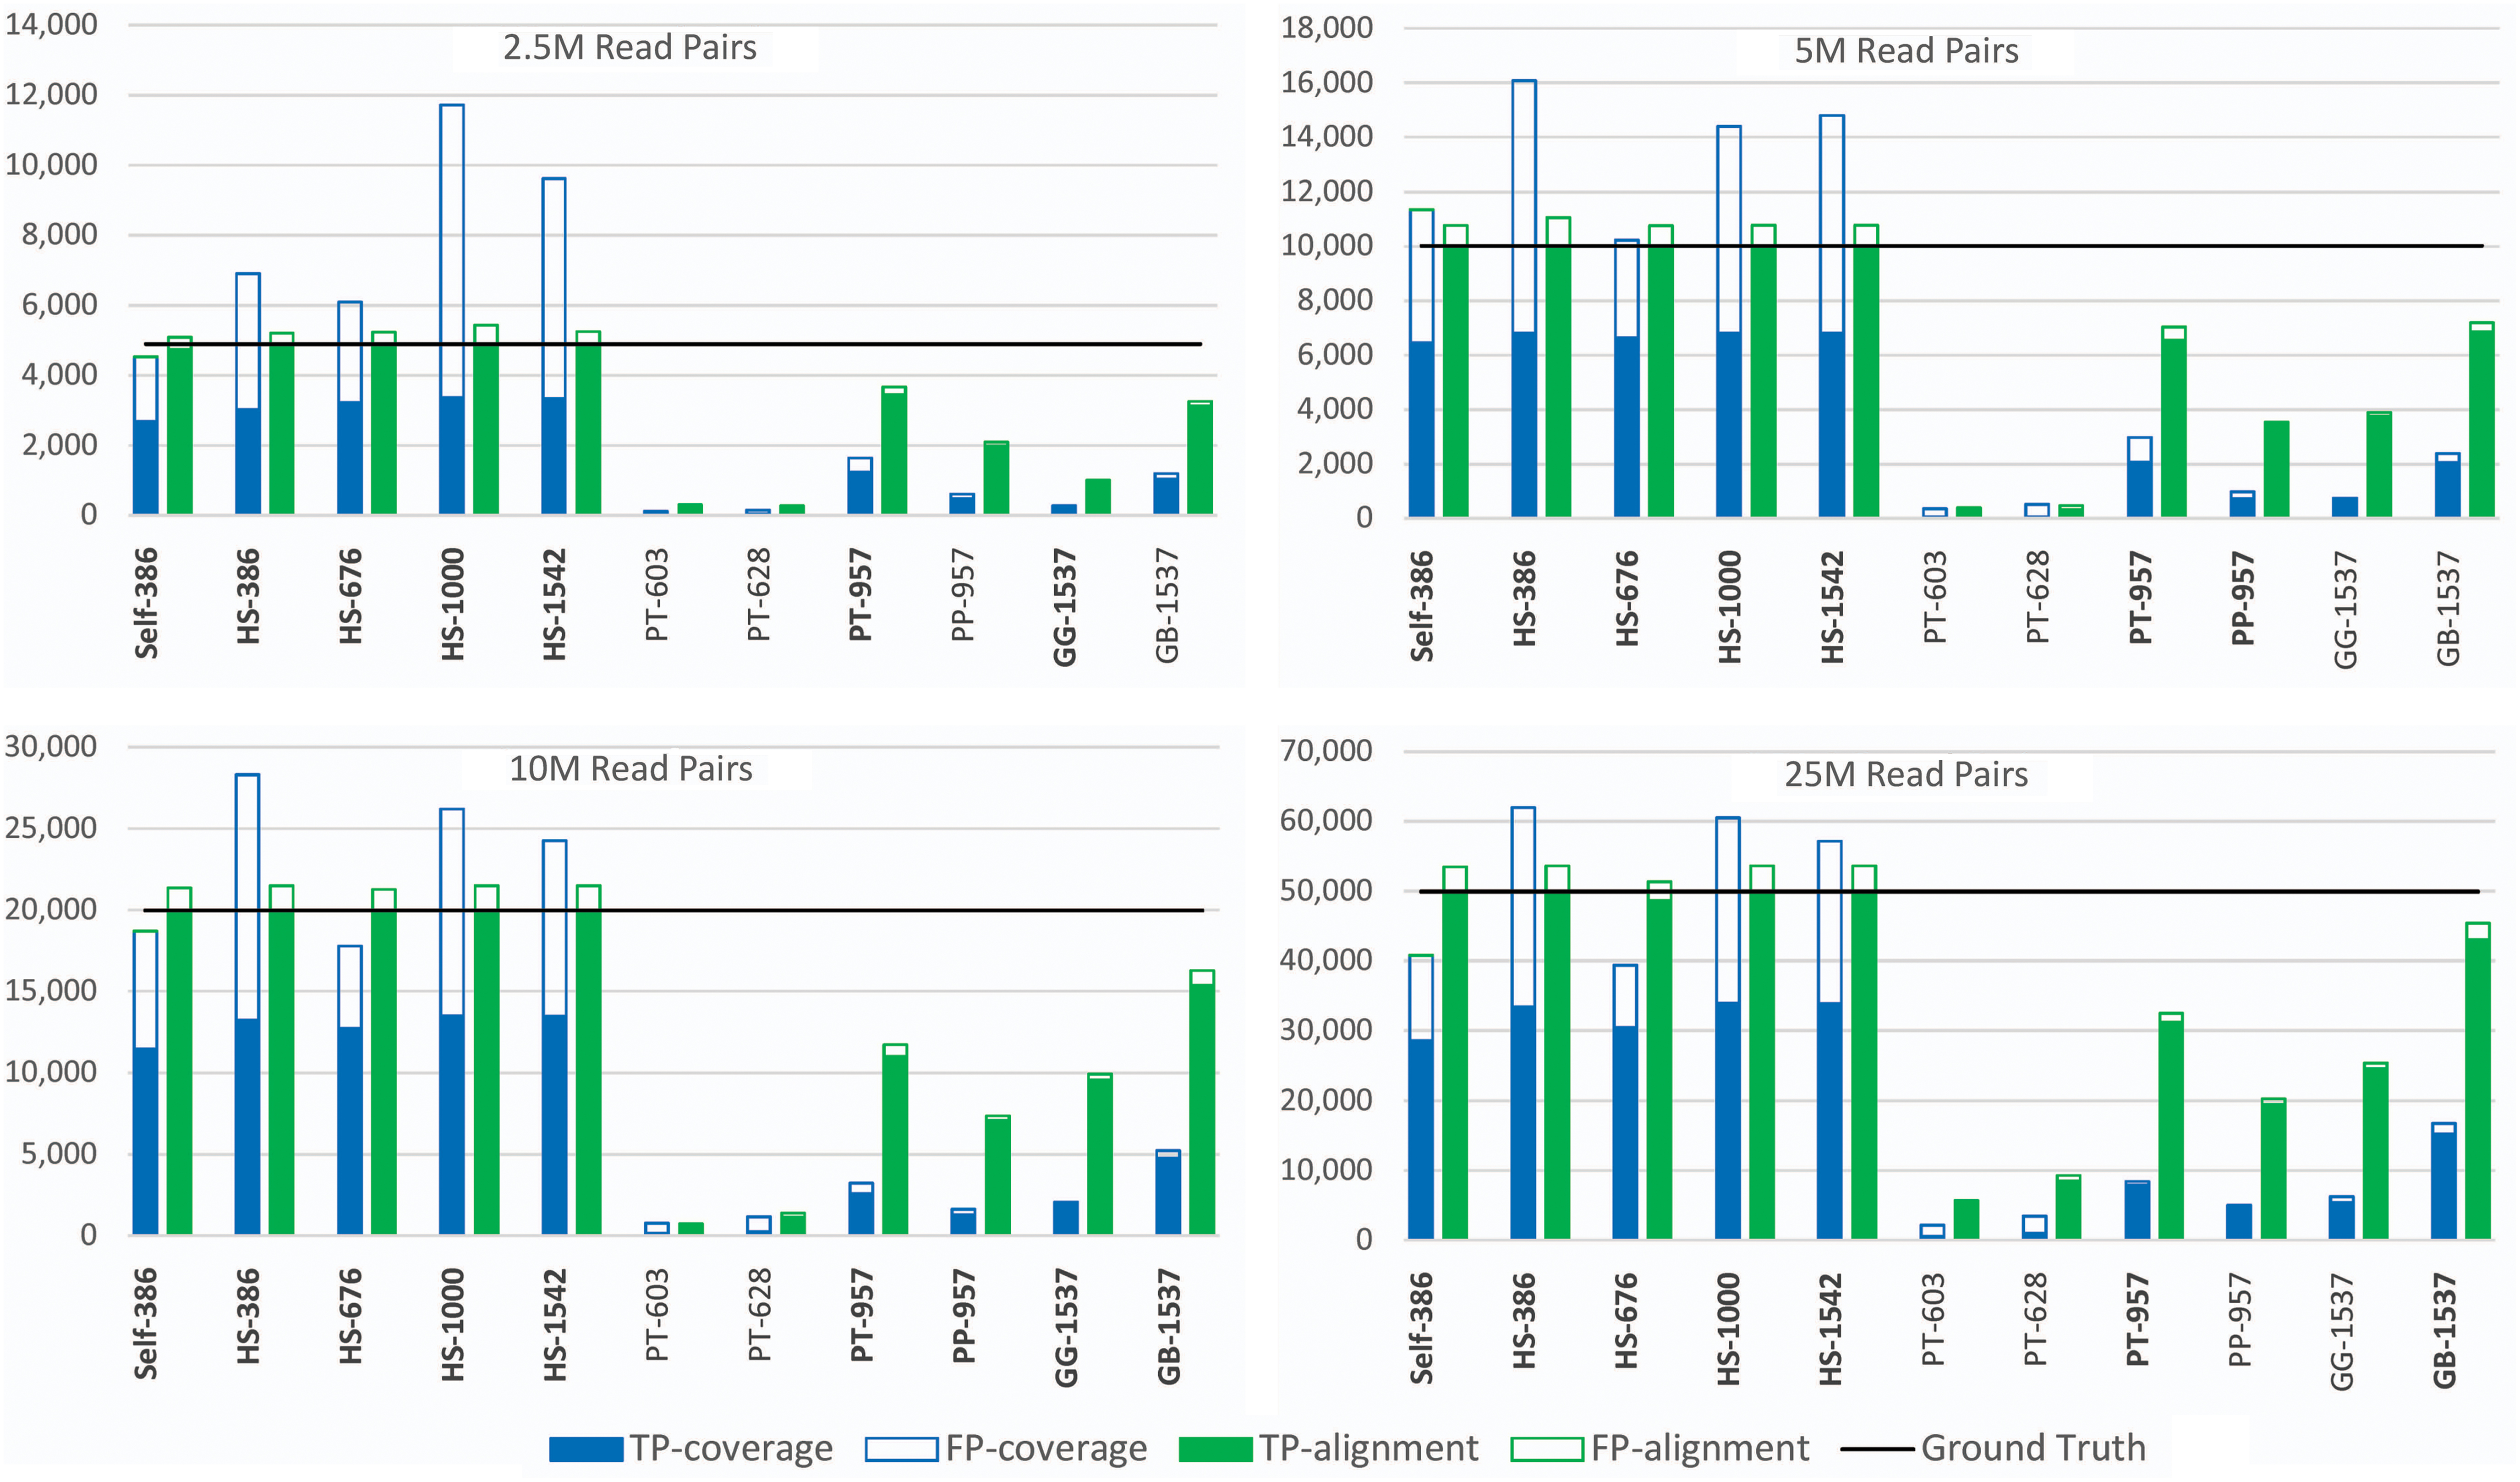
Effect of the seed on read filtering accuracy for 2.5M–25M read pairs randomly selected from WGS run ERR020236. The y-axis represents the number of read pairs output by SMART's coverage-based and reference-based filters. WGS, whole-genome sequencing.
3.5. Statistical Mitogenome Assembly with RepeaTs results for nonhuman species
SMART retained high success rate and assembly accuracy when assembling mitogenomes for the nonhuman data sets described in Table 2. All SMART assemblies except that of R. temporaria were circular. Table 5 gives the percentage identity between the SMART assemblies and the NCBI mitogenomes of the corresponding species computed using five different tools: Mauve (Darling et al., 2004), LASTZ (Harris, 2007), MUSCLE (Edgar, 2004), ClustalW (Thompson et al., 2003), and MAFFT (Katoh et al., 2002). Although there are minor differences between the percentage identity reported by different tools, the majority of values are higher than 99%, suggesting very high-quality assemblies. The slightly lower identities observed for A. niger, G. japonensis, and P. papatasi could be due the higher interindividual variability within these species.
SMART Assembly Accuracy on Data sets from Nonhuman Species with Published Mitochondrial DNA Reference Sequence
All SMART assemblies except R. temporaria are circular.
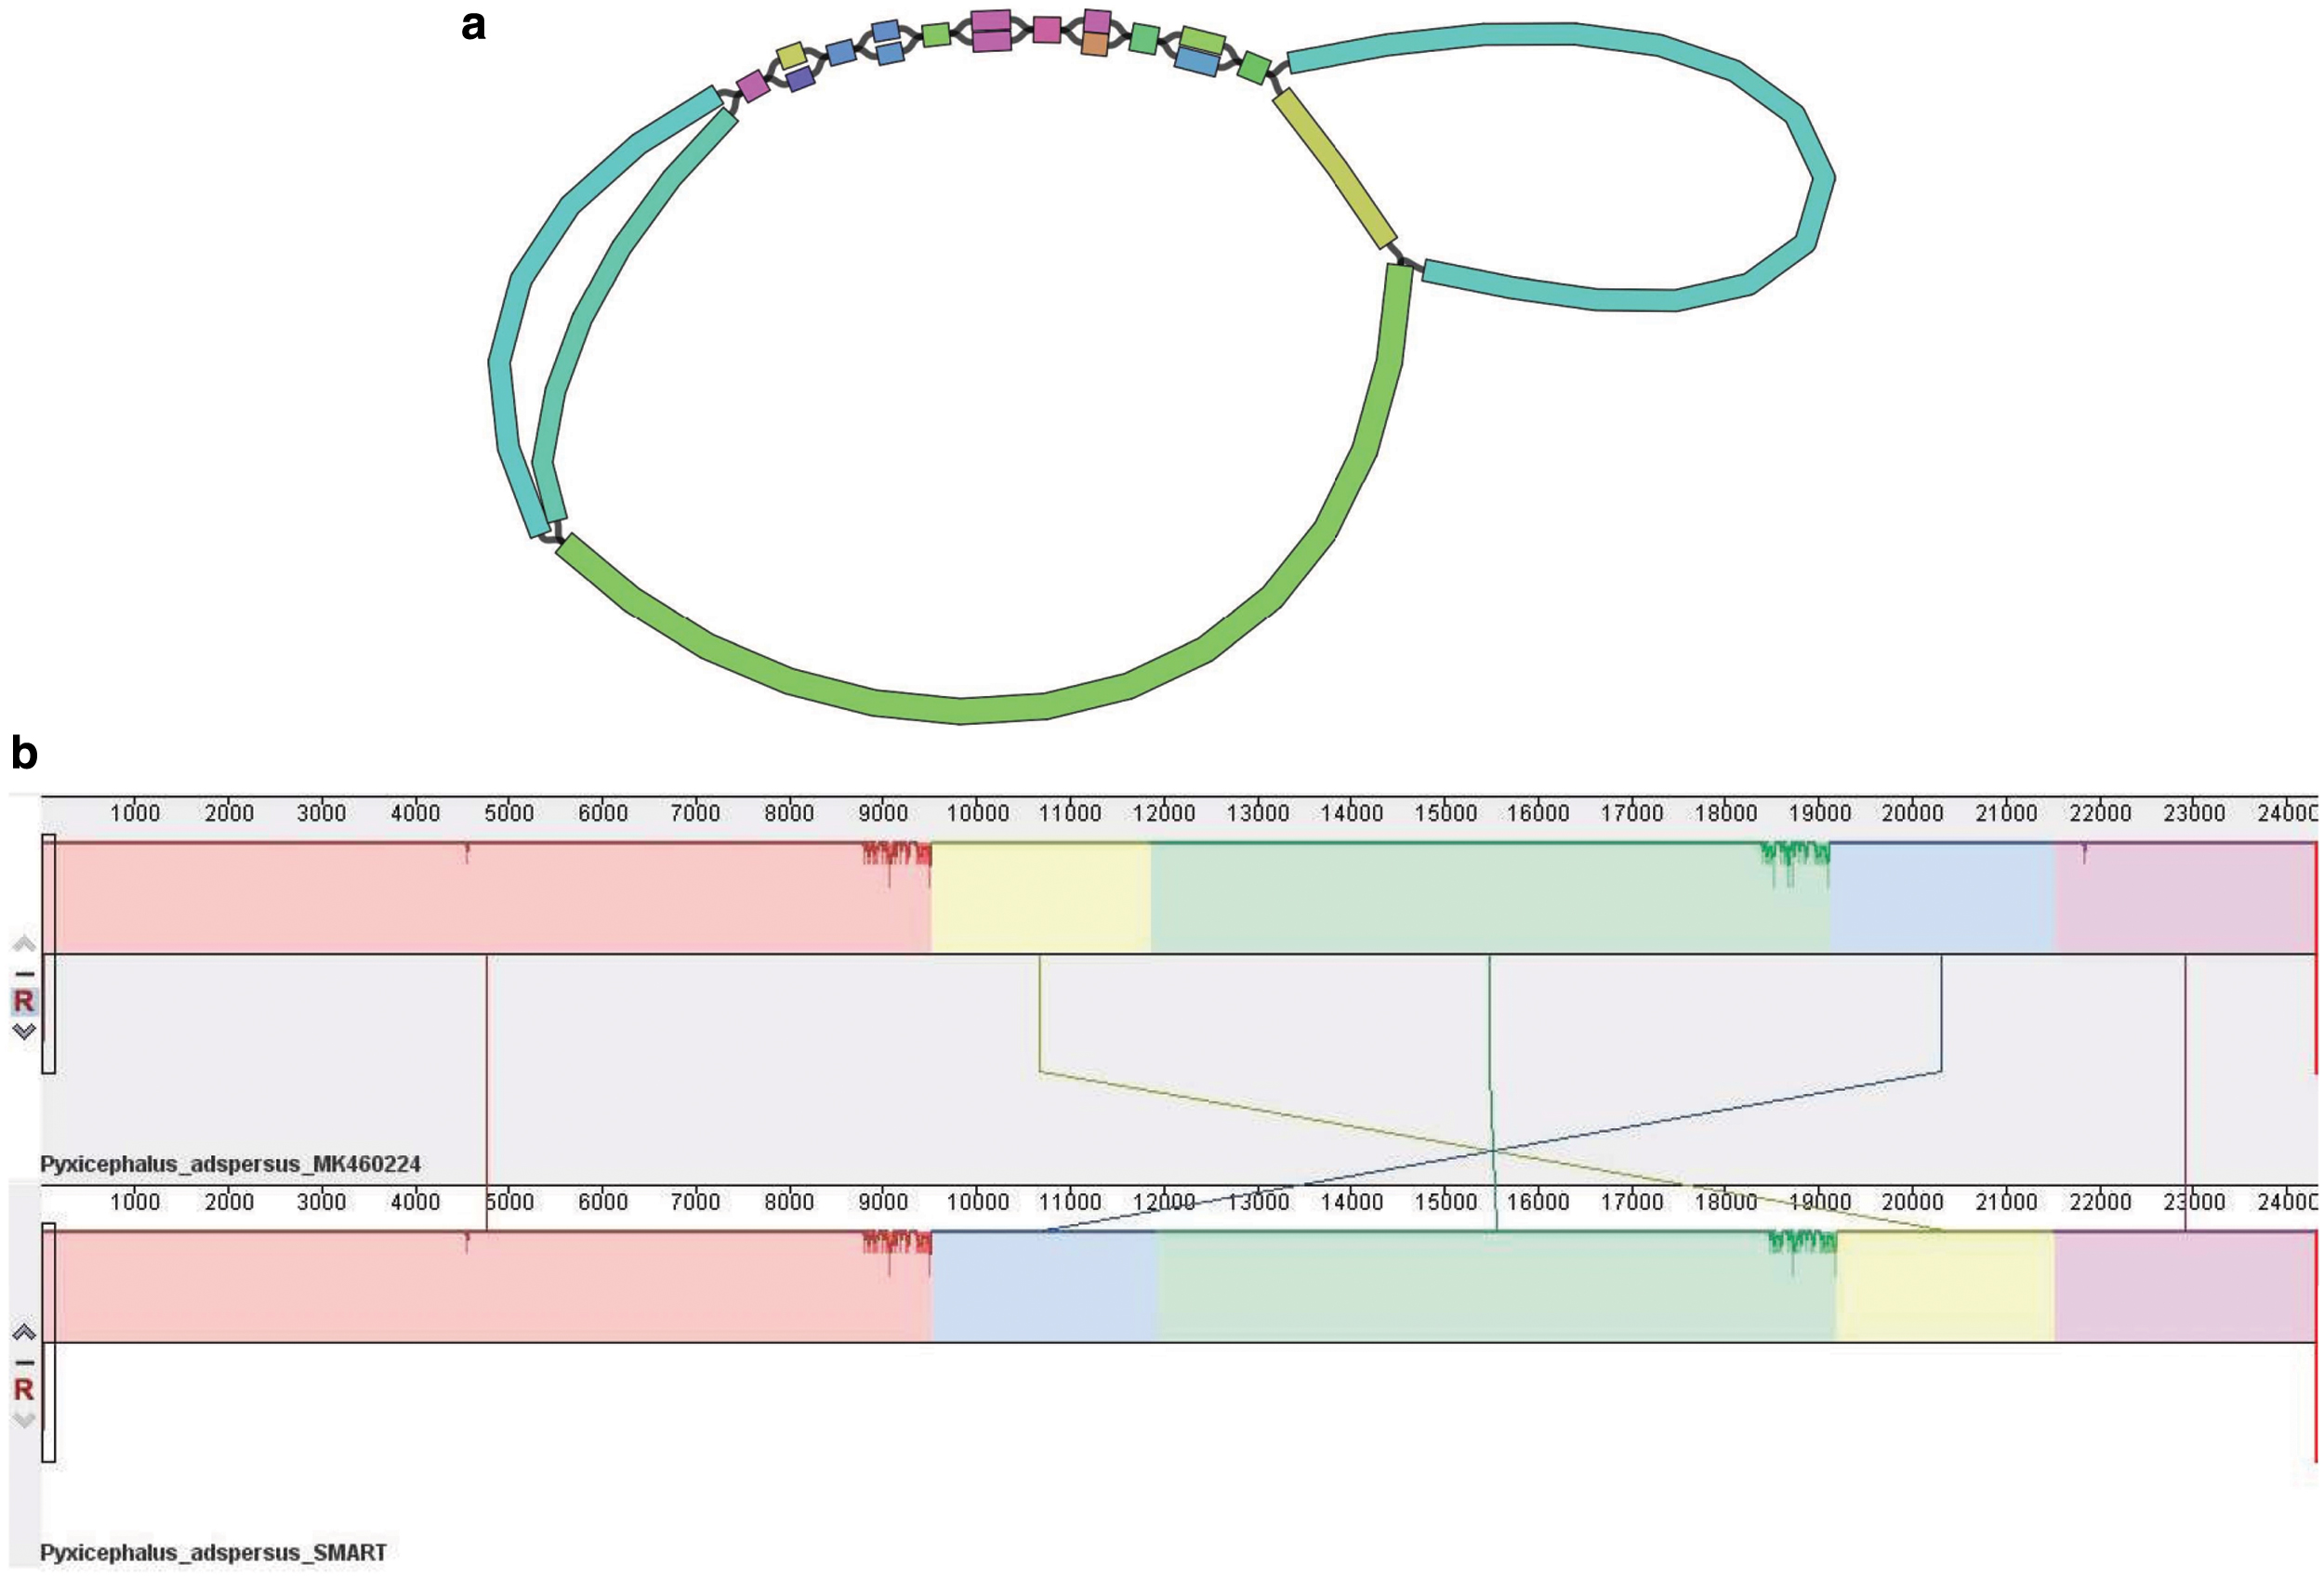
The circular mitogenome assembled by SMART for P. adspersus has the lowest percentage identity to the published reference. The 23,317 bp mitogenome of P. adspersus (GenBank ID MK460224) was recently assembled using Sanger sequencing and primer walking (Cai et al., 2019). Its size is the largest among the known anuran mitogenomes. The analysis in Cai et al. (2019) suggests that the unusually long length is the likely result of a whole-mitogenome duplication, followed by random gene losses. The repetitive nature of P. adspersus, including both large duplications and small tandem repeats, is apparent in the SMART assembly graph, visualized using Bandage (Wick et al., 2015) in Figure 4a. The alignment performed using Mauve between the reference and the mitogenome reconstructed by SMART (Fig. 4b) reveals that the main difference between the two sequences is a reversal that SMART failed to correctly resolve due to the relatively short insert length (550 bp) of the assembled WGS library.
4. Conclusions
In this article, we presented SMART, an automated pipeline for de novo mitogenome assembly from Illumina paired-end WGS reads. SMART is based on a novel statistical framework that includes probabilistic read filtering based on coverage, likelihood maximization for resolving ambiguities in the assembly graph, and assembly confidence estimation using bootstrapping. Experimental results on both human and nonhuman data sets show that SMART produces complete/circular assemblies with high success rate even for low-coverage WGS data sets and in the presence of repeats. The pipeline is publicly available at https://neo.engr.uconn.edu/?toolid=SMART via a user-friendly Galaxy interface. In ongoing work, the pipeline is being extended to handle multiple libraries and to automatically select the optimal number of read pairs used for each bootstrap.
Availability
The pipeline is publicly available at https://neo.engr.uconn.edu/?tool_id=SMART through an easy-to-use web interface.
Footnotes
References
Supplementary Material
Please find the following supplemental material available below.
For Open Access articles published under a Creative Commons License, all supplemental material carries the same license as the article it is associated with.
For non-Open Access articles published, all supplemental material carries a non-exclusive license, and permission requests for re-use of supplemental material or any part of supplemental material shall be sent directly to the copyright owner as specified in the copyright notice associated with the article.