
Abstract
Bacterial evolution is an important study field, biological sequences are often used to construct phylogenetic relationships. Multiple sequence alignment is very time-consuming and cannot deal with large scales of bacterial genome sequences in a reasonable time. Hence, a new mathematical method, joining density vector method, is proposed to cluster bacteria, which characterizes the features of coding sequence (CDS) in a DNA sequence. Coding sequences carry genetic information that can synthesize proteins. The correspondence between a genomic sequence and its joining density vector (JDV) is one-to-one. JDV reflects the statistical characteristics of genomic sequence and large amounts of data can be analyzed using this new approach. We apply the novel method to do phylogenetic analysis on four bacterial data sets at hierarchies of genus and species. The phylogenetic trees prove that our new method accurately describes the evolutionary relationships of bacterial coding sequences, and is faster than ClustalW and the existing alignment-free methods.
1. Introduction
Bacteria are widely distributed on the earth and have important research significance in many fields. For example, they promote the growth of the medical industry, improve the environment, and participate in human nutritional cycle. The study of bacterial phylogeny has drawn increasing attention (Mendler et al., 2019). The evolution of bacterial RNA polymerase, deoxyribonucleoside kinases, and so on has profound implications for large scales of bacterial phylogeny and gene studies (Kreth et al., 2009). With the development of sequencing and computer technology, more and more sequences are available to construct bacterial phylogeny at molecular level (Li et al., 2017a,b; Pei et al., 2019). Homologous sequences indicate that they are similar in function and evolutionary relationship, and the phylogenetic results can be represented by a phylogenetic tree, in which sequences are divided into groups on the basis of sequence similarities.
Based on biological sequences, common approaches to construct phylogenetic relationships include alignment and alignment-free methods in bioinformatics. Most alignment approaches depend on evolutionary model assumptions, they require long computation time to obtain results, and they cannot deal with large scales of data in a reasonable time. On the other side, alignment-free methods can achieve satisfactory results and need low computational complexity. In this case mathematical methods are often used to compare biological sequences and do phylogenetic analysis, such as moment vector (Dong et al., 2018), feature vector (Zhang et al., 2019), natural vector (NV) (Zheng et al., 2015; Li et al., 2016, 2017b), and graphical representation (Hoang et al., 2016). A density method for studying genome comparison has been proposed (Yu et al., 2011) before. However, the obtained density vector equals the length of the biological sequence, which means this method is not applicable for bacterial genome sequences of millions of base pairs. While this inspires us to cluster and classify bacteria from the perspective of probability.
Hence, we establish a new density approach, joining density vector method (JDVM), to overcome the earlier limitations. JDVM characterizes the features of coding sequence in a genome sequence, which fully shows the statistical information of sequences. JDVM is applied to the clustering and classification of four bacteria data sets. The results show JDVM clusters bacteria correctly. Besides, JDVM can deal with large-scale data set and is faster compared with previous proposed approach.
2. Methods
2.1. Bacteria data and tools
In this study, all bacterial data were from National Center Biotechnology Information (NCBI) in November 2019, All the programs in this article are written in MATLAB R2018a and run on the same laptop (MacBook Air, 1.8 GHz Intel Core i5, 8 GB 1600 MHz DDR3).
2.2. The density and distribution in probability
For a DNA sequence
n0 is sum of all coding sequence bases number:
For example, a bacterial DNA sequence is ACGTACGTAGC (Table 1). The first coding sequence is CGT, its positions are from the second nucleotide to the fourth; the second coding sequence is TACG, its positions are from the fourth nucleotide to the seventh; the third coding sequence is CGT, its positions are from sixth nucleotide to eighth. There are 10( = 3 + 4 + 3) bases for three coding sequences. Its density vector is defined as follows:
The Density Vector Example of a DNA Sequence
The corresponding distribution vector is
The density and distribution vectors' length equals the length of the bacterial genome sequence.
2.3. Normalized probabilistic density
We have obtained a discrete density vector utilizing bases' positions of coding sequence. However, the density vector's length is related to the genome sequence length, which limits the comparison of bacterial sequences with difference length. We need to normalize density vectors.
Based on the division algorithm (Zhao et al., 2011), we divide the density vector into segments. First, we fix k, which is a preset integer much less than N. N is a known integer. Then we define q as the quotient and r as the remainder in the following equation when dividing N by k:
Therefore, we divide the long density vector into k segments: The first r segments possess q + 1 elements and the remaining k − r segments possess q elements:
Then all elements in each segment are added together: DV(m, k) is the sum of density vector in the mth segment of the whole density vector. Equation (5) explains it clearly:
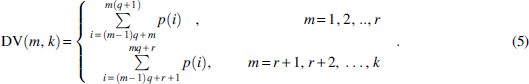
Next we combine these short discrete density vectors together to get the new vector, joining density vectors (JDVs):

Here
2.4. Similarity measure
Once every DNA sequence is numerically characterized by coding sequence density vector, an appropriate similarity measure between two discrete density vectors is required for further analysis. Presently the commonly used between two points is Minkowski distance in Euclidean space: for
Kullback–Leibler divergence is used to measure two discrete probabilistic density vectors p1 and p2 (Yu et al., 2011):
Cosine similarity is an angular distance that evaluates the similarity of two vectors by angle cosine values:
2.5. 1NN accuracy and area under the curve
k-Nearest neighbor (KNN) is a distance-based method (Thanh and Kappas, 2018), which can predict cluster accuracy when k = 1. The definition of 1NN accuracy can be described as follows: for all sample i in sample space, the nearest sample j can be determined, if the labels of sample i and j are the same, we consider that the cluster result is correct, then 1NN accuracy rate =
Receiver operating characteristic (ROC) curve can be used to measure the performance of a classifier (Hanley and Mcneil, 1982). In ROC curve, vertical axis indicates sensitivity, horizontal axis indicates 1-specificity. The closer the point in the curve is to (0,1), the better the classifier performance is. Area under the curve (AUC) is the area under the ROC curve. The greater the AUC value is, the better the classifier performance is. Tenfold cross-validation is used popularly now: the data set is divided into 10 parts, 9 of them are trained in turn and 1 of them is regarded as test set, the mean value of 10 results is viewed as the accuracy estimation of the algorithm.
3. Results
3.1. Determining set K
To determine set K, we randomly downloaded bacterial genome sequences from NCBI database and applied JDVM on this data set, then checked if the classification labels obtained by our method are consistent with those previous studied (Donovan et al., 2018). The data set includes 839 bacteria from nine genera (Supplementary Table S1). Calculation time consists of two parts: JDVs and accuracy values. Here 30 = 3 + 4 + 5 + 7 + 11. (See also Supplementary Tables S2, S3, S4, S5). Calculation process is as follows:
Step 1: Transform each bacterium i into a JDV:
Step 2: For
Step 3: Add all 1 together and divide the value by total number of bacteria to get the accuracy rates.
Step 4: Repeat above steps,
Table 2 shows that the larger the set K size, the longer the computation time. We take dimension as abscissa axis, and draw accuracy for different measures, the result proves that the accuracy rate of Manhattan distance is the biggest. We take different measures as x-axis, and draw accuracy for different dimensional JDVs, the result indicates that 79d JDV gives the best result (Supplementary Fig. S1). Thus, we determine K = {3, 4, 5, 7, 11, 13, 17, 19} and compare JDVs in
Performance Comparison of Different Dimension Joining Density Vectors and Measures
KLD, Kullback–Leibler divergence.
KNN is actually a classification method, the result may be overfitting. We provide AUC to measure the classification results (Supplementary Fig. S2). The results are obtained by 10-fold cross-validation,
3.2. Phylogenetic analysis of bacteria
JDVM is tested on four bacterial data sets (Table 3). Two hundred sixteen bacteria in the first data set are all from one family (Enterobacteriaceae). Bacteria in the second data set come from different families. To further illustrate the effectiveness of our method, we choose another two data sets (Pseudomonas, Streptococcus) and cluster bacteria in species level. The first step in this process is the same as Determining set K section, the next two steps are as follows:
Step 2: Calculate Manhattan distance matrix Step 3: Draw neighbor joining phylogenetic tree using Mega7.
Four Data Sets for Phylogenetic Analysis
3.2.1. Phylogenetic analysis of Enterobacteriaceae
Enterobacteriaceae is the intestinal flora, which is one of the most common pathogens in human beings. They spread easily from person to person (Nordmann et al., 2011). JDVM is applied on this data set and a phylogenetic tree was obtained (Fig. 1): these 216 bacteria are correctly clustered into six genera: Citrobacter, Enterobacter, Escherichia, Klebsiella, Salmonella, and Shigella. This phylogenetic tree agrees well with those in standard biological taxonomy (Donovan et al., 2018).

Phylogenetic tree of the first data set: 216 bacteria from six genera of Enterobacteriaceae. Bacteria from same genus are clustered together. The detailed bacterial information of each branch can be found in Supplementary Material.
We also compared it with NV method (Yu et al., 2013) (Supplementary Fig. S3) and Fast Fourier Transform (FFT) method (Hoang et al., 2015) (Supplementary Fig. S4); there are more than two branches for one genus for both of clustering results.
3.2.2. Phylogenetic analysis of bacteria from different families
The second bacterial data set from different families was selected for method's reliability and validity. Phylogenetic tree on the basis of 79 dimensional JDV is constructed (Fig. 2). Three hundred sixty-six bacteria are divided into 11 clades: Acinetobacter, Bacillus, Cloidioides, Enterococcus, Escherichia, Mycobacterium, Mycobacteroides, Salmonella, Staphylococcus, Vibrio, and Yersinia.
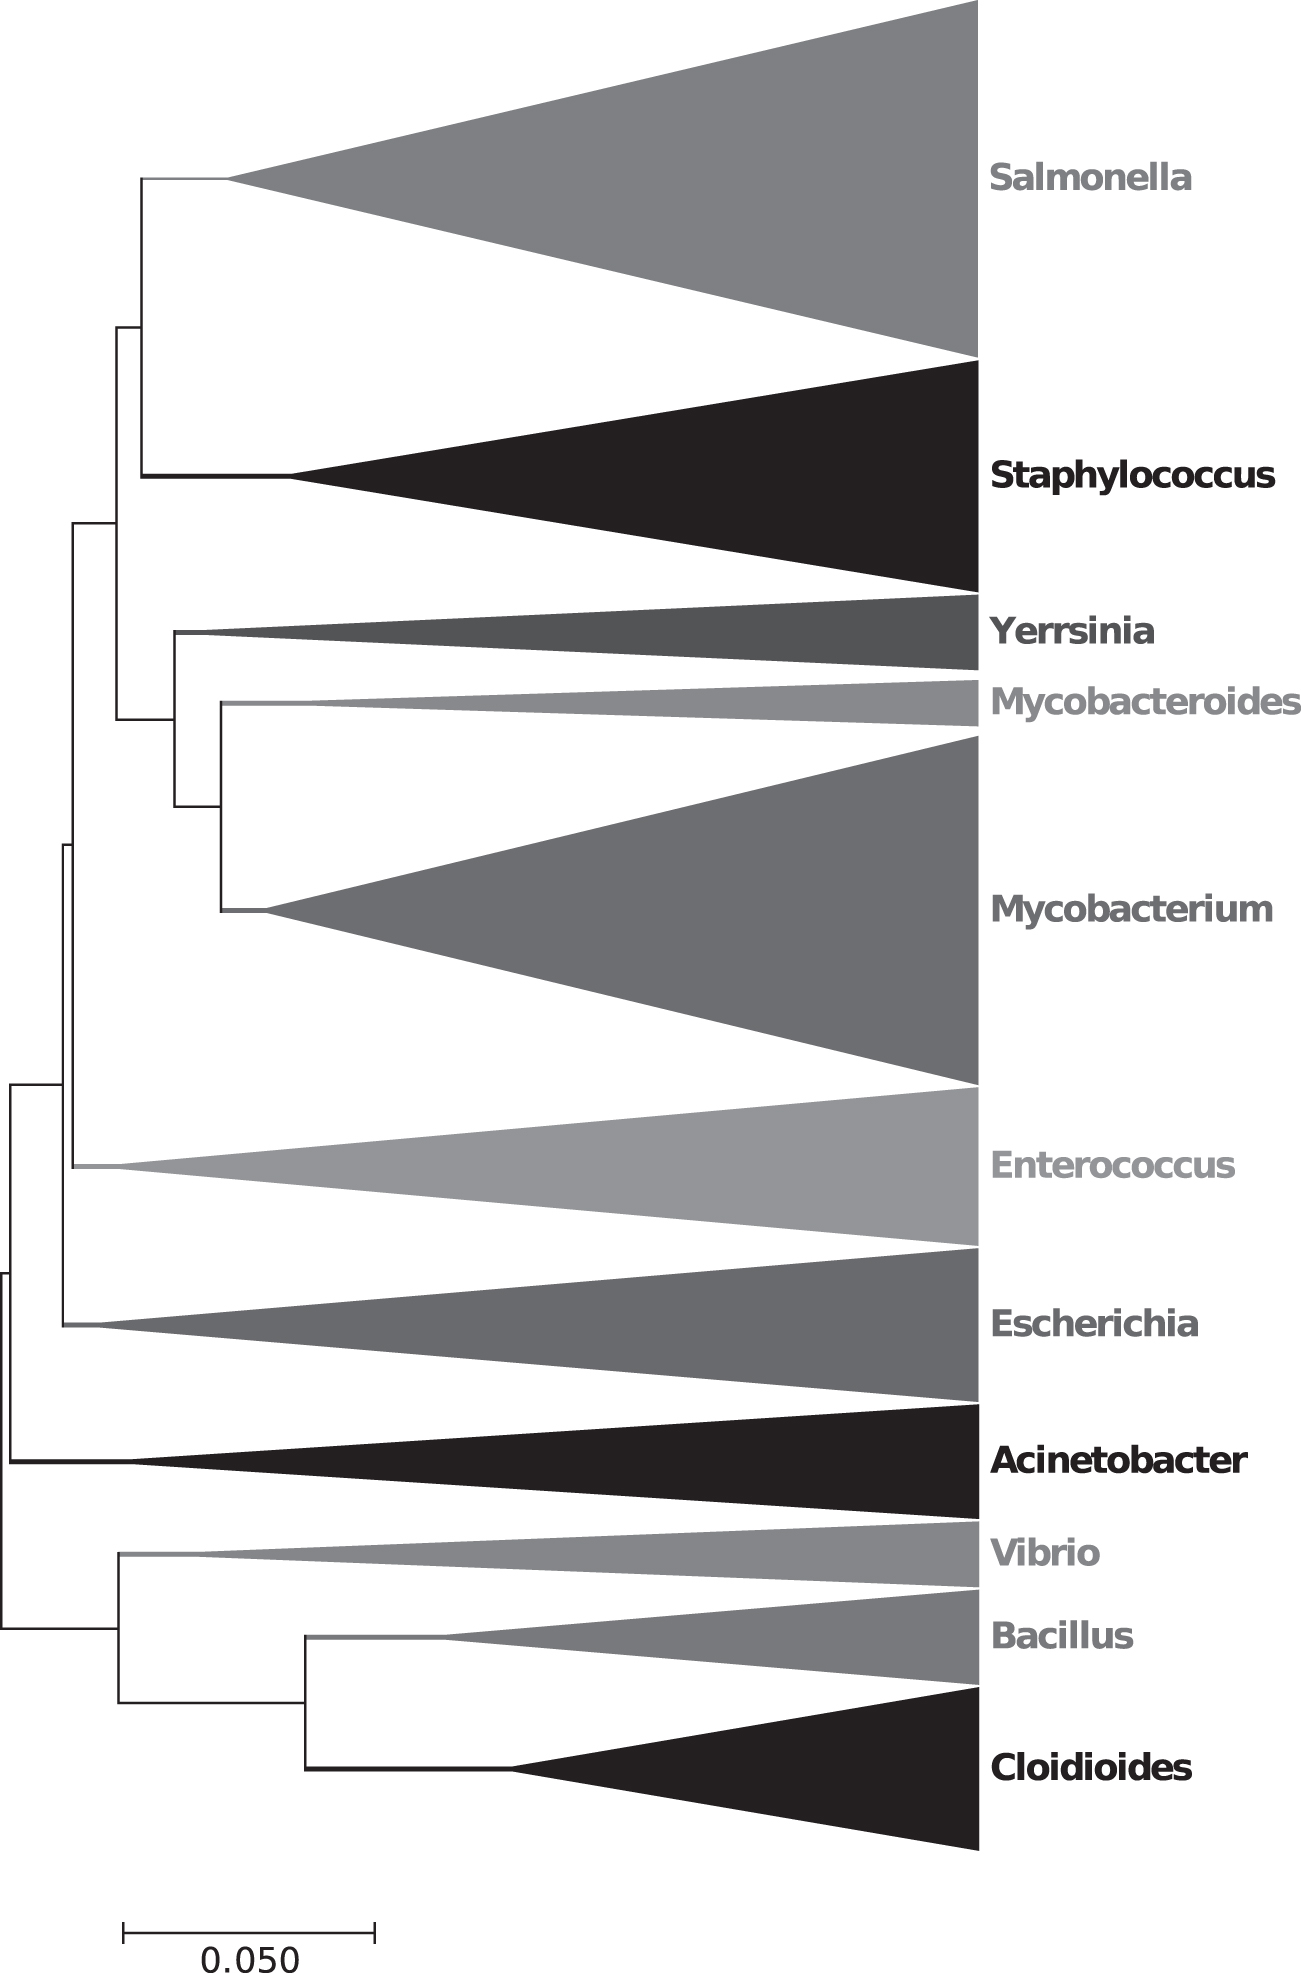
Phylogenetic tree of the second data set, 366 bacteria from different families. Eleven classes are distinguished.
Alignment-free method, NV, and FFT are also used to cluster these 366 bacterial complete genomes (Supplementary Figs. S5 and S6).
3.2.3. Phylogenetic analysis of Pseudomonas
Now we use the third data set, Pseudomonas, to do phylogenetic analysis on species level. Pseudomonas is a common pathogen, which mainly exists in soil and sea water. According to Figure 3, 101 bacteria are clustered into five groups correctly. NV and FFT have been employed to construct phylogenetic tree (Supplementary Figs. S7 and S8). We also modify the dimension of vector (K = {3, 4, 5, 7, 11, 13, 17}) to draw another tree (Supplementary Fig. S9). Pseudomonas stutzeri, Pseudomonas syringae, and Pseudomonas putida have two branches. The Euclidean distance of 79d JDVs is also calculated to get a result (Supplementary Fig. S10). Pseudomonas aeruginosa is not separate from other bacterial species.
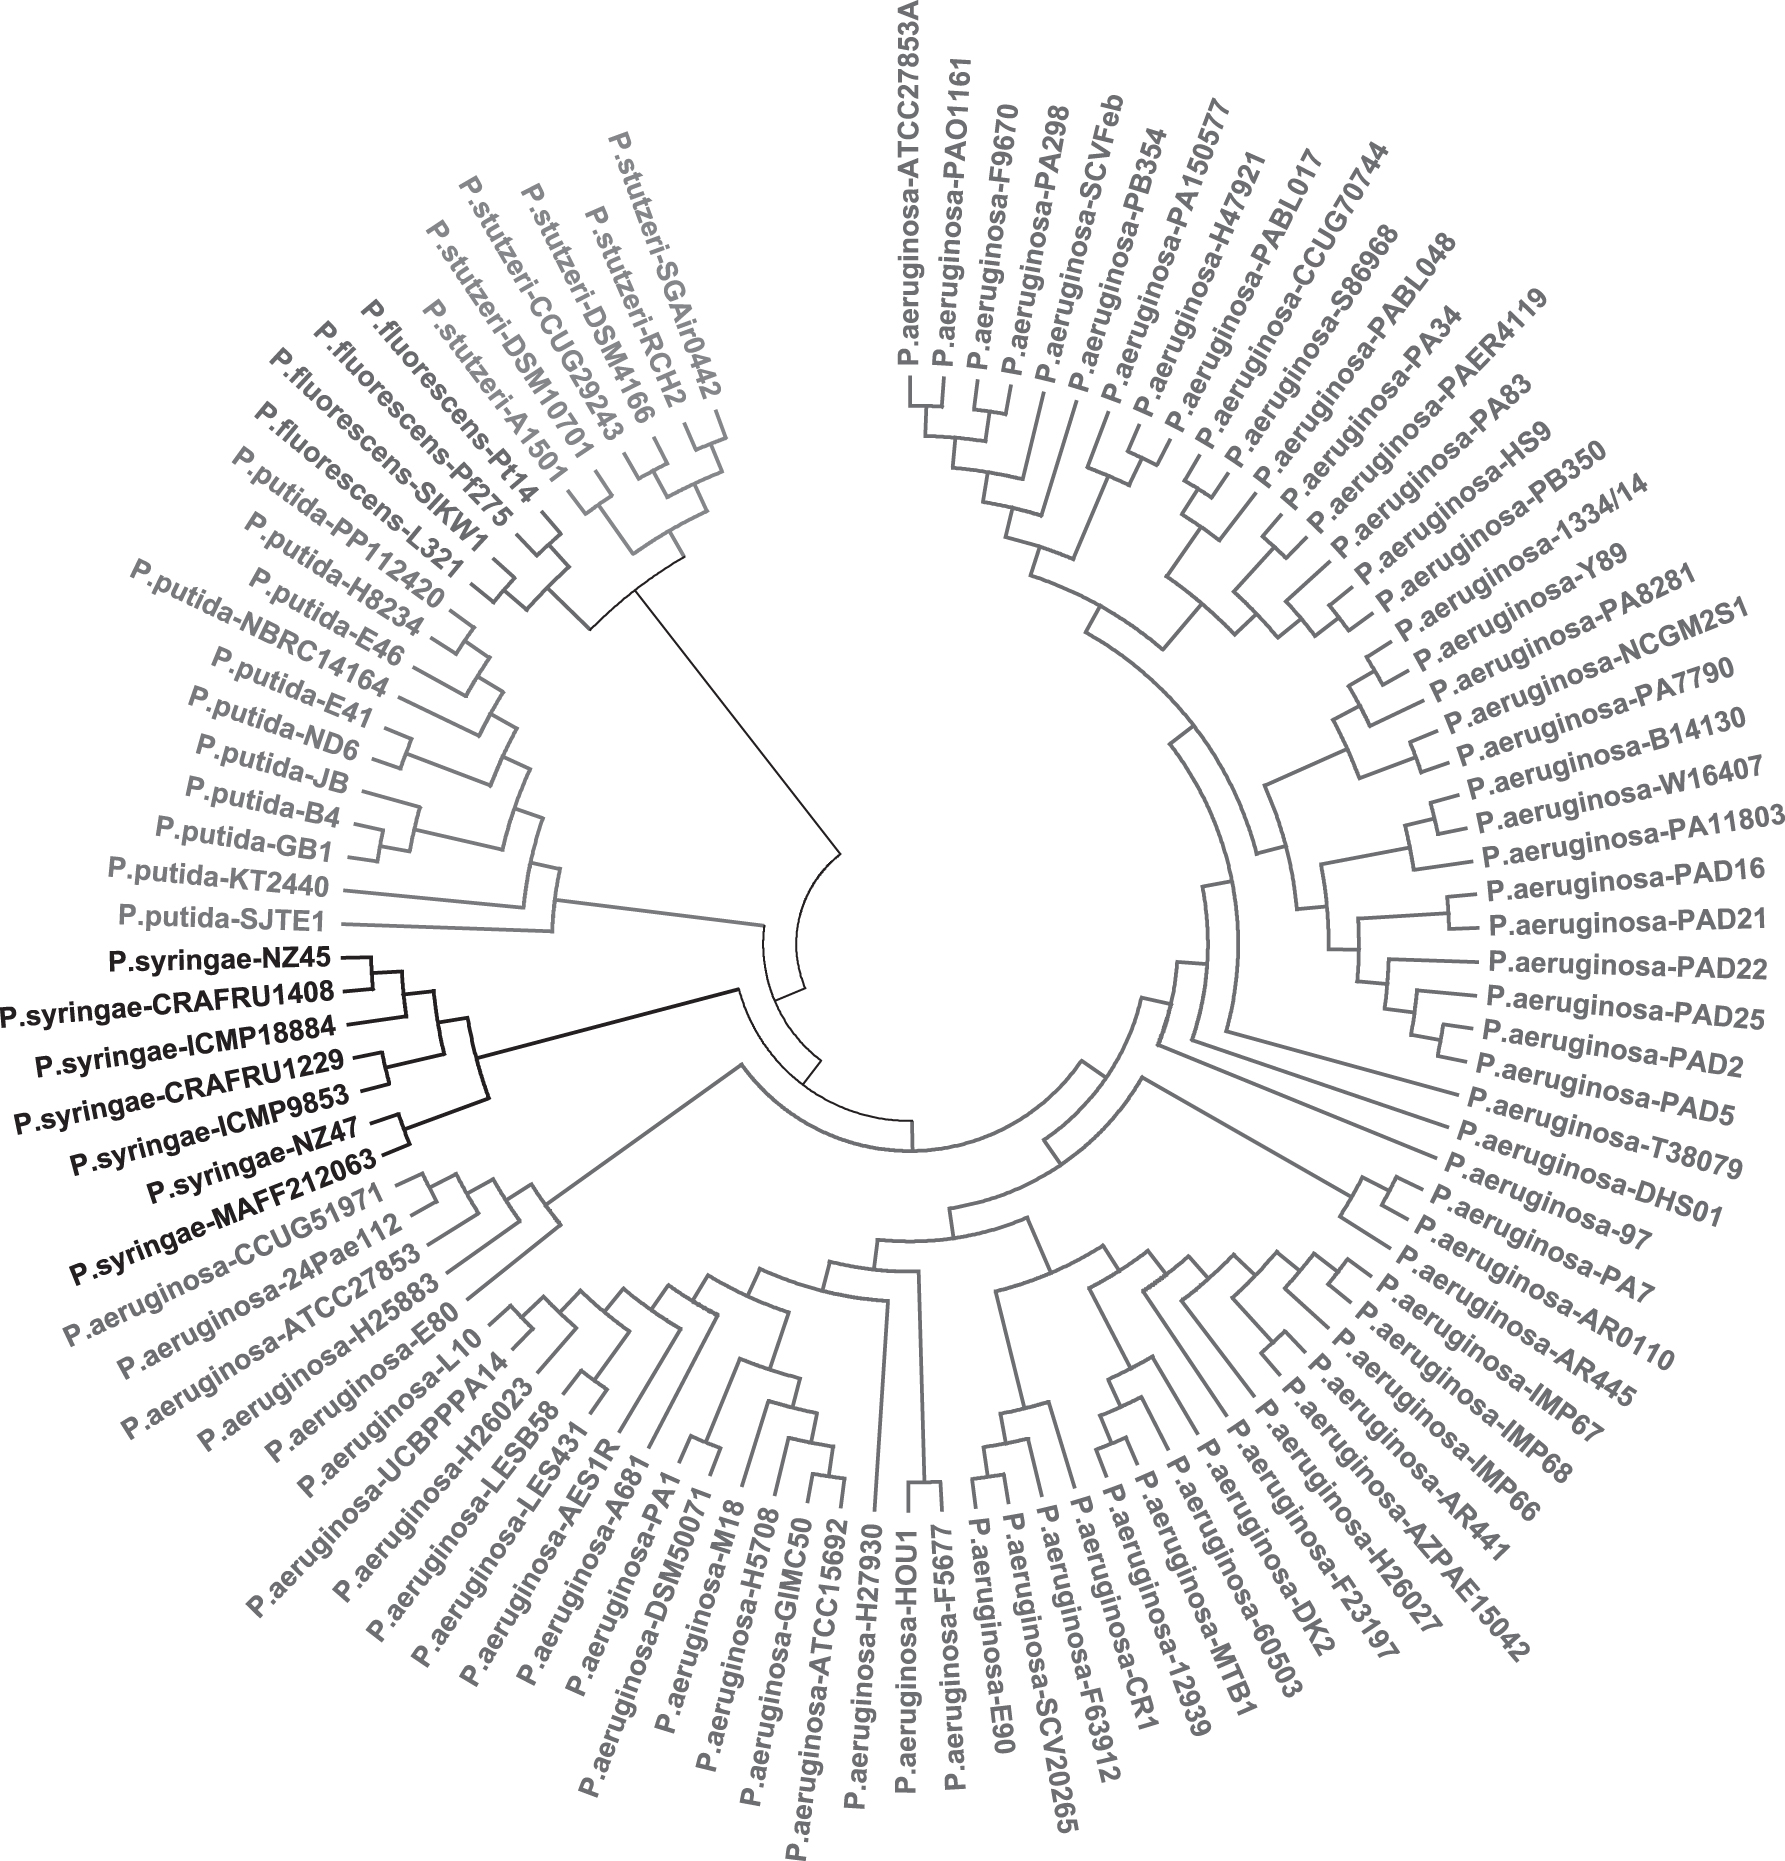
Phylogenetic tree of the third data set, 101 bacteria from Pseudomonas: P. aeruginosa, P. fluorescens, P. putida, P. stutzeri, P. syringae. All species from same group are clustered together.
3.2.4. Phylogenetic analysis of Streptococcus
The coding sequence numbers of Streptococcus in the fourth data set ranges from 1611 to 2508, and the average length of sequence is about 2,000,000 bp. The phylogenetic tree is shown in Figure 4, which includes eight clades. The results of FFT and chaos game representation (CGR) method (Hoang et al., 2016) are displayed in Supplementary Figures S11 and S12.

Phylogenetic tree of the fourth data set, 280 bacteria from eight species of Streptococcus: S. agalactiae, S. dysgalactiae, S. gallolyticus, S. pneumoniae, S. pyogenes, S. sobrinus, S. suis, and S. thermophilus.
4. Discussion
Our results would seem to demonstrate that JDVM can cluster bacterial sequence quickly and accurately. We compare the computing time of alignment-free methods and traditional alignment method for third and fourth data sets, as shown in Table 4. ClustalW is one of the most classic methods in the phylogenetic analysis. Data import and sequence alignment cannot be completed in 24 hours in Mega 7, but only few seconds are taken to calculate JDVs for the same data set: JDVM takes the least time (third data set: 52.5 seconds/fourth data set: 40.0 seconds) to calculate vector. CGR takes 1757.3 seconds for third data set and 1599.3 seconds for the fourth data set, Table 4 shows our method is more efficient than existing alignment-free methods. For pseudomonas genus, sequence average length is about 6.5 × 10⁶ bp, and Streptococcus genus sequence average length is about 2.0 × 10⁶ bp. The Streptococcus data set is larger, whereas it takes less time than pseudomonas data set, that is because our method is related with sequence lengths. JDVM does not require much memory to store large scales of bacterial sequence. However, ClustalW and FFT method need more memory to store sequences than JDVM.
Time Comparison of the Five Methods
FFT, Fast Fourier Transform; CGR, chaos game representation; JDVM, joining density vector method; NV, natural vector.
In addition, we calculate the 1NN accuracy rate for the third data set, and the value is 0.8614, which shows that most bacteria have the same label with their nearest bacterium. The distances are shown in Supplementary Table S6.
5. Conclusion
JDVM is proposed to analyze and cluster bacteria in this article. The novelty of this method is that it defines the density of coding sequence from probabilistic perspective. With this method, the features of coding sequences hidden in the sequence can be effectively extracted, and each sequence is numerically characterized by a JDV. Gene expression relies on coding sequence, thence this new method provides us with a meaningful direction to study phylogeny. The traditional sequence alignment method is accurate when constructing phylogenetic tree, but it is time-consuming. Compared with alignment and alignment-free method, JDVM overcomes the deficiency that can process data quickly and is suitable for large amounts of data. More importantly, the test results on several data sets show that it can give accurate clustering results of bacteria without evolutionary assumptions.
The new method can be utilized to explore the phylogeny of coding sequences. Our phylogenetic results are consistent with previous results. We have verified that joining density method can not only deal with the long bacterial data, but also improve the computing efficiency. Although the density method performs well on the speed and accuracy to cluster bacterial, there is still room for improvement. Density methods are sensitive to the location of coding sequences and genome sequences must be complete otherwise it would result in incorrect evolutionary conclusions.
Footnotes
Authors' Contributions
S.S.-T.Y. initiated and designed the study. R.D. and N.S. developed the method. N.S. analyzed the results and wrote the article. S.P. helped analyzing the results. R.D. and C.Y. helped approving the final version.
Author Disclosure Statement
The authors declare they have no competing financial interests.
Funding Information
This study was supported by Tsinghua University start-up fund, Tsinghua University Education Foundation fund (042202008), and National Natural Science Foundation of China grant (91746119).
References
Supplementary Material
Please find the following supplemental material available below.
For Open Access articles published under a Creative Commons License, all supplemental material carries the same license as the article it is associated with.
For non-Open Access articles published, all supplemental material carries a non-exclusive license, and permission requests for re-use of supplemental material or any part of supplemental material shall be sent directly to the copyright owner as specified in the copyright notice associated with the article.