
Abstract
Many problems in applied machine learning deal with graphs (also called networks), including social networks, security, web data mining, protein function prediction, and genome informatics. The kernel paradigm beautifully decouples the learning algorithm from the underlying geometric space, which renders graph kernels important for the aforementioned applications. In this article, we give a new graph kernel, which we call graph traversal edit distance (GTED). We introduce the GTED problem and give the first polynomial time algorithm for it. Informally, the GTED is the minimum edit distance between two strings formed by the edge labels of respective Eulerian traversals of the two graphs. Also, GTED is motivated by and provides the first mathematical formalism for sequence co-assembly and de novo variation detection in bioinformatics. We demonstrate that GTED admits a polynomial time algorithm using a linear program in the graph product space that is guaranteed to yield an integer solution. To the best of our knowledge, this is the first approach to this problem. We also give a linear programming relaxation algorithm for a lower bound on GTED. We use GTED as a graph kernel and evaluate it by computing the accuracy of a support vector machine (SVM) classifier on a few data sets in the literature. Our results suggest that our kernel outperforms many of the common graph kernels in the tested data sets. As a second set of experiments, we successfully cluster viral genomes using GTED on their assembly graphs obtained from de novo assembly of next-generation sequencing reads.
1. Introduction
Networks, or graphs as they are called in mathematics, have become a common tool in modern biology. Biological information from DNA sequences to protein interaction to metabolic data to the shapes of important biological chemicals is often encoded in networks.
One goal in studying these networks is to compare them. We might want to know whether two DNA assembly graphs produce the same final sequences or how close the protein interaction networks of two related species are. Such comparisons are difficult owing to the fact that determining whether two graphs have an identical structure with different labels or vertex ordering is a problem in NP-complete complexity class, for which no polynomial algorithm is known. Therefore, any comparisons will need to focus on specific aspects of the graph.
Here, we present the notion of graph traversal edit distance (GTED) as presented by the authors in Boroojeny et al. (2018), a new method of comparing two networks. Informally, GTED gives a measure of similarity between two directed Eulerian graphs with labeled edges by looking at the smallest edit distance that can be obtained between strings from each graph via an Eulerian traversal. GTED was inspired by the problem of differential genome assembly, determining if two DNA assembly graphs will assemble to the same string. In the differential genome assembly problem, we have the de Bruijn graph representations of two (highly) related genome sequence data sets, where each edge e represents a substring of size k from reads extracted from these genome sequences (e.g., one from a cancer tissue and the other from the normal tissue of the same individual), and its multiplicity represents the number of times its associated substring is observed in the reads of the respective genome sequence. In this formulation, each vertex represents the
Differential genome assembly has been introduced to bioinformatics in two flavors: (1) reference genome free version (Li et al., 2011; Movahedi et al., 2012; Iqbal et al., 2012; Taghavi et al., 2013; Movahedi et al., 2016) and (2) reference genome dependent version, which, in its most general form, is NP-hard according to Hormozdiari et al. (2011). Both versions of the problem are attracting significant attention in biomedical applications (e.g., Mak, 2011; Jones, 2012) due to the reduced cost of genome sequencing (now approaching $1000 per genome sample) and the increasing needs of cancer genomics where tumor genome sequences may significantly differ from the normal genome sequence from the same individual through single symbol edits (insertions, deletions, and substitutions) as well as block edits (duplications, deletions, translocations, and reversals).
In addition to comparing assembly graphs, GTED can also be used to compare other types of networks. GTED yields a (pseudo-)metric for general graphs because it is based on the edit distance metric. Hence, it can be used as a graph kernel for a number of classification problems. GTED is the first mathematical formalism in which global traversals play a direct role in the graph metric. In this article, we give a polynomial time algorithm using linear programming (LP) that is guaranteed to yield an integer solution. We use that as a graph kernel and evaluate the performance of our new kernel in support vector machine (SVM) classification over a few data sets. We also use GTED for clustering of viral genomes obtained from de novo assembly of next-generation sequencing reads. Note that GTED is a global alignment scheme that is not immediately scalable to full-size large genomes, like all other global alignment schemes such as Needleman–Wunsch. However, GTED can form the mathematical basis for scalable heuristic comparison of full-size large genomes in the future.
1.1. Related work
Many problems in applied machine learning deal with graphs, ranging from web data mining (Inokuchi et al., 2003) to protein function prediction (Borgwardt et al., 2005). Some important application domains are biological networks such as regulatory networks, sequence assembly and variation detection, and structural biology and chemoinformatics where graphs capture structural information of macromolecules. For instance, machine learning algorithms are often used to screen candidate drug compounds for safety and efficacy against specific diseases and also for repurposing of existing drugs (e.g., Kubinyi, 2003). Kernel methods elegantly decouple data representation from the learning part; hence, graph learning problems have been studied in the kernel paradigm (Gärtner, 2002). Following the work by Gärtner (2002), other graph kernels have been proposed in the literature (Vishwanathan et al., 2010).
A graph kernel
Existing graph kernels that are vertex permutation invariant use either local invariants, such as counting the number of triangles and squares that appear in G as subgraphs, or spectral invariants captures as functions of the eigenvalues of the adjacency matrix or the graph Laplacian. Essentially, different graph kernels ranging from random walks (Gärtner, 2002) to shortest paths (Borgwardt and Kriegel, 2005; Feragen et al., 2013) to Fourier transforms on the symmetric group (Kondor and Borgwardt, 2008) to multiscale Laplacian (Kondor and Pan, 2016) compute local, spectral, or multiscale distances. While most subgraph counting kernels are local (Shervashidze et al., 2009), most random walk kernels are spectral (Vishwanathan et al., 2010). Multiscale Laplacian (Kondor and Pan, 2016), Weisfeiler–Lehman kernel (Shervashidze et al., 2011), and propagation kernel (Neumann et al., 2016) are among the multiscale kernels.
In this article, we introduce a graph kernel based on comparison of global Eulerian traversals of the two graphs. To the best of our knowledge, our formalism is the first to capture global architectures of the two graphs as well as their local structures. Our kernel is based on the GTED introduced in this article. We show that a lower bound for GTED can be computed in polynomial time using the LP relaxation of the problem. In practice, the linear program often yields an integer solution, in which case the computed lower bound is actually equal to GTED. In Ebrahimpour Boroojeny et al. (2020), we have explained in detail the instructions for working with the software developed for computing GTED. The software is freely available under open source (https://github.com/Ali-E/GTED).
2. Problem Definition
Due to diversity of applications, input graphs can be obtained as molecular structure graphs, social network graphs, systems biology networks, or sequence assembly graphs such as de Bruijn graphs (Pevzner et al., 2001), A-Bruijn graphs (Pevzner et al., 2004), positional de Bruijn graphs (Ronen et al., 2012), string graphs (Myers, 1995), or implicit string graphs (Simpson and Durbin, 2010) among numerous alternatives. Our GTED is inspired by those applications and can potentially be adapted to any of those frameworks. However, we choose below a general, convenient representative definition for the problem. For the sake of brevity, we assume throughout this article that the input graph has one strongly connected component.
iff G with the corresponding edge multiplicities, M, is Eulerian. That is, G contains a cycle (or path from a specified source to a sink) that traverses every edge
Figure 1 demonstrates an example edge-labeled Eulerian graph for the circular sequence ACAGACAT in the alphabet
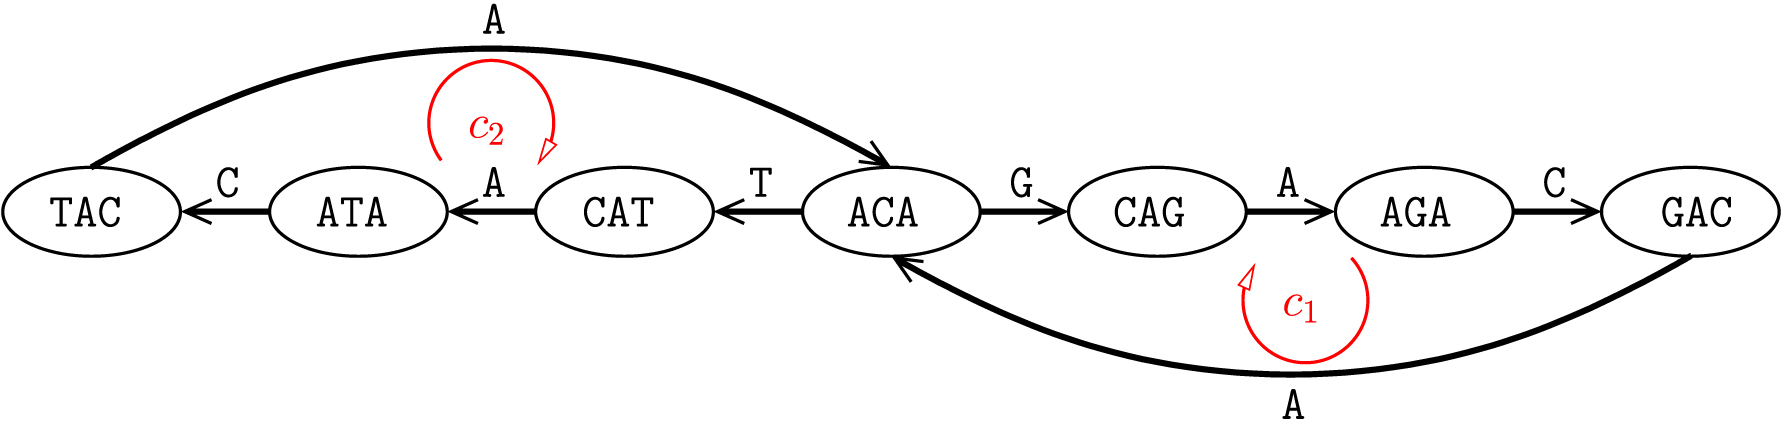
Edge-labeled Eulerian graph. An edge-labeled Eulerian graph
The language of A is then defined to be

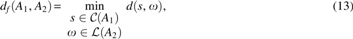
We now define GTED.
in which
Note that
3. Methods
3.1. Brute force computation of GTED
It is clear that there are algorithms, although with exponential running time, that enumerate all Eulerian cycles in a graph. Through brute force Needleman–Wunsch alignment of the words of every pair of Eulerian cycles in A1 and A2, we can compute the edit distance right from the definition. De Bruijn, van Aardenne-Ehrenfest, Smith, and Tutte proved the de Bruijn–van Aardenne–Ehrenfest–Smith–Tutte (BEST) theorem (Tutte and Smith, 1941; van Aardenne-Ehrenfest and de Bruijn, 1987), which counts the number of different Eulerian cycles in A as
in which
3.2. GTED as a constrained shortest path problem
The conventional string alignment problem can be transformed into a shortest path problem in an alignment graph, which is obtained by adding appropriate edges to the Cartesian product of the two string graphs. Figure 2 illustrates an example; further details can be found in a bioinformatics textbook such as the one by Jones and Pevzner (2004). Analogously, the GTED

Conventional alignment graph. The alignment graph for AC versus AGC. Those edges that correspond to matches are in dashed lines (cost of a match is often 0). Solid lines show substitutions and indels, which usually have a positive cost. The edit distance is the shortest distance from s to t in this graph (shown in blue).
Vertical:
Horizontal:
Diagonal:
There is a cost
The following Lemma states the fact that GTED is equivalent to a constrained shortest path problem in the alignment graph.

in which
Proof. For every pair
3.3. Lower bound via LP relaxation
Lemma 1 easily transforms our problem into an integer linear program (ILP) as the projection operator
in which indicator function
3.4. Algorithm for GTED
The following theorem is the main result of this article, which bridges the gap between GTED and another LP formulation which we will show is guaranteed to have an exact integer solution. Hence, GTED has a polynomial time algorithm explained as a linear program; Corollary 1 states that fact below.

in which
 is the matrix of the two-dimensional boundary operator in the corresponding homology and
for arbitrary fixed
Proof. It is sufficient to show two things:
GTED is equal to the solution of the ILP version of the linear program in Equation (7). The linear program in Equation (7) always yields an integer solution.
Using Lemma 1, we need to show that Equations (5) and (7) are equivalent for the first one. By construction,
If edges in c are
3.5. Total unimodularity
Using a recent result by Dey et al. (2011), we show that Equation (7) is guaranteed to yield an integer solution. The main reason is that the boundary operator matrix
Why is
Proof. It is enough to observe that in
Lemma 2 together with [Dey et al. (2011), Theorem 5.13] assert that
Lack of Möbius subcomplexes in the product space of graphs, which are Möbius-free spaces, can also be seen from the fact that the homology groups of graph product spaces are torsion-free. The following section summarizes that characterization.
3.6. Homology theory of alignment graph
An alignment graph

in which Hm is the mth homology group and Tor is the torsion functor (Vick, 1994).
Since

in which
Using the Künneth's theorem above and the fact that the tensor product of groups

Note that
4. Experiments
4.1. Using GTED to make a kernel
As mentioned earlier, since GTED is a measure of distance or dissimilarity between two graphs, we can use it to make a kernel of distance of pair of graphs in a data set, and this can be used for classification problems. We implemented a C++ program that generates the linear program for the problem. First, it builds the alignment graph
The C++ program also creates a projection set for each edge in either of the input graphs. Each vertical edge
Our program then extracts an LP problem from the alignment graph by assigning a variable xi to the ith edge of
We used an academic license of Gurobi optimizer to solve the linear program. Since the variables are already supposed to be non-negative, it was not necessary to add inequalities to the LP for this purpose.
4.1.1. Data
We tested our graph kernel on four data sets. The Mutag data set consists of “aromatic and heteroaromatic nitro compounds tested for mutagenicity.” Nodes in the graphs represent the names of the atoms. The Enzymes data set is a protein graph model of 600 enzymes from BRENDA database, which contains 100 proteins each from 6 Enzyme Commission top level classes (Oxidoreductases, Transferases, Hydrolases, Lyases, Isomerases, and Ligases). Protein structures are represented as nodes, and each node is connected to three closest proteins on the enzyme. The NCI1 data set is derived from PubChem website (pubchem.ncbi.nlm.nih.gov), which is related to screening of human tumor (nonsmall cell lung) cell line growth inhibition. Each chemical compound is represented by their corresponding molecular graph where nodes are various atoms (Carbon, Nitrogen, Oxygen, etc.) and edges are the bonds between atoms (single, double, etc.). The class labels on this data set is either active or inactive based on the cancer assay. The PTC data set is part of Predictive Toxicology Evaluation Challenge. This data set is composed of graphs representing chemical structure and their outcomes of biological tests for the carcinogenicity in male rats (MR), female rats (FR), male mice (MM), and female mice (FM). The task is to classify whether a chemical is POS or NEG in MR, FR, MM, and FM in terms of carcinogenicity.
4.1.2. Preprocessing and postprocessing
We use the Chinese Postman algorithm to make the input graphs Eulerian by adding the minimum amount of weights to the existing edges of the graphs. For directed graphs, we can use them directly in our algorithm, but for undirected graphs, we consider two edges in opposite directions for each undirected edge and treat the two created opposite edges as separate variables in our LP problem.
Because our method requires edge labels, for those data sets such as enzymes that have no edge labels, we use the concatenation of the source node label and the destination node label to make a label for every edge. To make the direction of the edge irrelevant, when we are comparing the two edge labels to see whether they match, we check both the equality of label of one to the label of the other or to the reverse label of the other edge, which is obtained by reversing ordering of the source and destination nodes.
After computing the distance value between each pair of graphs, we have higher values for more distant (less similar) graphs. To prepare a normalized kernel to be used in other implemented classifiers such as SVM, we have to map initial values such that for more similar graphs we obtain higher values (1 for identical pairs). To make this transformation, we have used two simple methods, and for each data set we have used both of them and chose the one that gives us the best results during the cross validation on the training set. Then, this chosen method is used on the test set to get the final accuracy. The first method is to use
4.1.3. Results
To evaluate whether this method works well at capturing the similarity and classifying the graphs, we used some benchmark data sets, Mutag from Debnath et al. (1991), Enzymes from Borgwardt et al. (2005), NCI1 from Wale et al. (2008), and PTC from Toivonen et al. (2003), that are used to compare the graph kernels. We compare the kernels by evaluating the accuracy of an SVM classifier that uses them for classification. We used the same settings as in Kondor and Pan (2016) so we can compare our results with previously computed results for other kernels, Weisfeiler–Lehman (WL) from Shervashidze et al. (2011), WL-Edge from Shervashidze et al. (2009), shortest path (SP) from Borgwardt and Kriegel (2005), Graphlet from Shervashidze et al. (2009), p-Random Walk (p-RW) from Gärtner (2002), and Multiscale Laplacian Graph kernel (MLG) from Kondor and Pan (2016). In this setting, we split the data randomly to two parts, 80% for training and 20% for testing. Then, we computed results for 20 different splitting using different random seeds. It can be seen from Table 1 that for the Mutag and Enzymes data sets, our kernel outperforms the other kernels. In the results (Table 1), we copied the values from Kondor and Pan (2016) for other kernels.
Comparing GTED with Well-Known Graph Kernals
GTED, graph traversal edit distance; MLG, Multiscale Laplacian Graph kernel; p-RW, p-Random Walk; SP, shortest path; WL, Weisfeiler–Lehman. The best accuracy on each dataset is shown in bold.
4.1.4. Analysis
As shown in Table 1, our kernel achieves a higher accuracy on the Mutag and Enzymes data sets but gets average result on PTC and relatively weaker result on NCI1, compared with other methods. Actually, none of the existing kernels can get the best results on all different kinds of data because each kernel captures only some features of the graphs. The Eulerian traversals of the graphs can be very informative for some specific applications, such as Mutag. The aromatic and heteroaromatic chemical compounds in Mutag mostly consist of connected rings of atoms. These constituent rings can give us a good measure of proximity of two compounds. Since the language of Eulerian traversals includes the traversal of these rings in each compound, finding the minimum distance between the strings of the languages (which are built by the labels of the nodes that represent the name of atoms) for two different compounds can provide a measure of the similar structures that they contain. That is why we get the best result for this data set using our kernel.
Similarly, GTED outperforms the other kernels in the enzymes data set. The enzymes in this data set have certain shapes consisting of various protein structures (the nodes), and the combination of the individual structures and the nearby proteins gives us a good sense of the structure of the enzyme. In this case, Eulerian cycles usually give us a good approximation for the general spatial structure of the enzyme, which leads to a good score.
The algorithm performed less well on the NCI1 and PTC data sets. We are uncertain of why this is, but it seems likely that the critical properties of the relevant chemicals are not captured by the Eulerian traversal.
4.2. Using GTED on genomic data
As mentioned earlier, the original goal of GTED was to find the best alignment of two genomes using only the assembly graphs, without having to create an assembled sequence first. The common alignment methods that compute the Levenshtein edit distance cannot take many factors into account, like having trans-locations in the genome, or the fact that assembly graphs could have multiple Eulerian cycles. Our method finds the best alignment among all possible alignments for all possible pairs of reference genomes that can be derived from the assembly graphs. As a result, it gives us a good measure to compute the distance (or similarity) between genomic sequences, and hence, a way to cluster a group of samples. Therefore, to evaluate our method on genomic data, we chose genomes of hepatitis B viruses in five different vertebrates; the virus in two of them (Heron and Tinamou) belong to Avihepadnavirus genus, and the ones in three of them (Horseshoe bat, Tent-making bat, and Woolly monkey) belong to Orthohepadnavirus genus.
4.2.1. Preprocessing and postprocessing
First, for each pair of sequences, we wished to compare, we generated a colored de Bruijn graph, a de Bruijn graph (assembly graph) that combines multiple samples in a single assembly graph with k-mers from different samples identified using different colored edges. We then extracted the graph for each specific color (genome). The LP problem for this experiment is produced almost like before; the difference here is that instead of using the second set of constraints to enforce that all edges of the input graphs are used exactly as many times as their multiplicities (an Eulerian cycle), we add the absolute value of the difference of the number of times that an edge is used in the alignment graph and its original weight in the corresponding input graph to the objective function of the LP. This way, we try to minimize this difference but allow some discrepancies. The extra flexibility seems necessary in this case because the input graphs are large and contain numerous sources of error: sequencing errors, using cutoffs for edges, and crude estimates of the weights of the edges based on the coverage of sequences in the colored de Bruijn graph mean that the edge multiplicities are not completely accurate.
4.2.2. Results
Numbers in Table 2 are the computed distance of each of these pairs of graphs. As represented in Table 2, it can be seen that the intra-genus distances are lower than inter-genus distances. We believe, based on these numbers, a good estimate of the similarity of the genomes can be made, both for genomes in the same genus and the ones with various genus.
GTED as a Distance Measure for Clustering
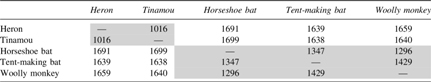
The intra-genus values are shaded in gray.
5. Extensions
As in the problem of finding optimal alignment between two strings where the notion of local alignment and fit alignment are essential to deal with different problems, for the alignment of two graphs, these notions can become useful to solve problems that differ from what the original GTED is designed for. In this section, we demonstrate the modifications that have to be made to the original GTED to derive the analogous algorithms for graphs as presented in Ebrahimpour Boroojeny (2019).
5.1. Local GTED
When analyzing genomic sequences, we might be interested in finding a conserved section in two different genes from the same or different species. Hence, we define a variant of the original GTED, the problem of Local GTED, which is analogous to the problem of local alignment for strings.

where
To solve this problem using the solution to the original GTED, we should notice that the second set of constraints does not have to be fulfilled anymore. This means that the projection of the cyclic traversal of the alignment graph onto the constituent graphs no more needs to exhaust their edges. Therefore, removing the second set of constraints provides us with an optimum traversal in
For local GTED, something that has to be noted is the necessity of assigning a negative value for the score of a match; otherwise, the solution to the LP will be an empty traversal, which has the optimum value of 0 (minimum possible distance). By assigning a negative value to a match, we encourage the local alignment to find larger cycles in the two graphs, which represent more similar strings.
5.2. Fit GTED
There are other problems where we have to find a small subgraph of a larger graph that is similar to a smaller one. In the following, analogous to the problem of fit alignment for strings, we define a variant of the original GTED, the problem of Fit GTED.
in which
For solving this problem, again we are going to use the solution to the original GTED. Here, we have to exhaust all the edges of A2, but we can use only a subset of edges of A1, which forms a cycle. So, by ignoring the projection constraints only for A1, the optimum alignment that will be found by the LP will be the solution to this problem. However, this solution requires A2 to be an Eulerian graph, and for general applications, this might not be the case. To solve this problem, we have to use the techniques discussed in Ebrahimpour Boroojeny (2019) to relax the projection constraints for A2 and try to minimize the distance while trying to use as many edges of A2 as possible in the alignment.
6. Conclusion
In this article, we have introduced GTED, a new method for comparing networks based on a traversal of their edge labels. We have shown that GTED admits a polynomial time algorithm using a linear program. This linear program is guaranteed to have an integer solution due to the fact that the boundary operator function is totally unimodular, giving us an exact solution for the minimum possible edit distance.
The GTED problem was originally designed to be a formalization of the differential genome assembly problem, comparing DNA assembly graphs by considering all their possible assembled strings. It performs well at that task, successfully differentiating different genera of the hepatitis B virus. We tested GTED on viral genomes since GTED is a global alignment scheme that is not immediately scalable to full-size large genomes, like all other global alignment schemes such as Needleman–Wunsch. However, GTED can form the mathematical basis for scalable heuristic comparison of full-size large genomes in the future. GTED can also be used as a general graph kernel on other types of networks, performing particularly well on graphs whose Eulerian traversals provide a good insight into their important structural features.
GTED is a new way of measuring the similarity between networks. It has many applications in differential genome assembly, but it also performs well in domains beyond assembly graphs. GTED has the potential to be a valuable tool in the study of biological networks.
Footnotes
Author Disclosure Statement
The authors declare they have no competing financial interests.
Funding Information
No funding was received for this project.