
Abstract
Comparison of RNA structures is one of the most crucial analysis for elucidating their individual functions and promoting medical applications. Because it is widely accepted that their functions and structures are strongly correlated, various methods for RNA secondary structure analysis have been proposed owing to the difficulty in predicting RNA three-dimensional structure directly from its sequence. However, there are few methods dealing with RNA secondary structures with a specific and complex partial structure called pseudoknot despite its significance to biological process, which is a big obstacle for analyzing their functions. In this study, we propose a novel tree representation of pseudoknotted RNA secondary structures by topological centroid identification and their comparison methods based on the tree edit distance. In the proposed method, a given graph representing an RNA secondary structure is transformed to a tree rooted at one of the vertices constituting the topological centroid that is identified by removing cycles with peeling processing for the graph. When comparing tree-represented RNA secondary structures collected from a public database using the tree edit distance and functional gene groups defined by Gene Ontology (GO), the proposed method showed better clustering results according to their GOs than canonical RNA sequence-based comparison. In addition, we also report a case that the combination of the tree edit distance and the sequence edit distance shows a better classification of the pseudoknotted RNA secondary structures.
1. Introduction
RNAs are an essential component of various biological processes such as transmission of genetic information from DNAs to proteins and regulation of gene expression. It is widely believed and accepted that there is a strong correlation between RNA function and structure; hence, prediction and comparison of RNA structures are fundamental analysis to elucidate the functions of individual RNAs. However, the prediction of three-dimensional structure of RNA directly from its sequence is difficult in terms of both biological and computational experiments. Therefore, RNA secondary structures that can be mathematically well formulated have attracted much attention, and various algorithms for RNA secondary structure analysis have been proposed. Hofacker et al. (1994) developed a software tool, Vienna RNA package, to compute and compare RNA secondary structures. They applied the tool to long RNA molecules, heat capacity of RNA secondary structures, and RNA hybridization. Dulucq and Tichit (2003) transformed RNA secondary structures into tree structures and compared them focusing on computational complexity based on tree edit distance.
However, these methods do not support pseudoknotted structure, which is a prevalent folding motif in RNA secondary structures (Giedroc et al., 2000). Although the pseudoknot has significant meanings in biological processes (Chen et al., 1992), it is known that both prediction and alignment of pseudoknotted RNA secondary structure are non-deterministic polynomial-time (NP-hard) problems (Akutsu, 2000; Jiang et al., 2002; Blin et al., 2010), so that certain pseudoknot structures are often ignored or transformed into pseudoknot-free structures by removal operations for efficient computation (Smit et al., 2008). Andronescu et al. (2007) developed a constraint-based parameter estimation algorithm to predict RNA secondary structure using pseudoknot-removal data. Moreover, Smit et al. (2006) classified RNA structure into structural components for explaining universal compositional patterns in rRNA secondary structure categories, and they discarded pseudoknot and gave up to analyze this region. However, recently, fast and accurate integer programming-based prediction methods for pseudoknotted RNA secondary structures were developed and their usefulness in terms of practicality was reported in Poolsap et al. (2009) and Sato et al. (2011).
On the contrary, transforming RNA secondary structure to tree is a common preprocess for comparison. However, pseudoknotted RNAs are difficult to be reduced into trees because of their structural complexity. Thus, there are few methods dealing with comparison of arbitrary pseudoknotted RNA secondary structures (Chiu and Chen, 2017). A software package RNAforester can compare RNA secondary structures but only for pseudoknot-free RNAs (Hochsmann et al., 2004). Evans (2006) developed a polynomial time algorithm by restricting the pseudoknot topology to be aligned. In contrast, Möhl et al. (2008) aligned arbitrary pseudoknotted RNA secondary structures under the assumption of costs of RNA secondary structure edit operations but the time complexity for the worst case is exponential. Although PSMAlign succeeded in efficient alignments of pseudoknotted structures by identifying similar stem structures, a local alignment approach and the worst-case time complexity is also exponential (Chiu and Chen, 2015). As mentioned previously, dealing with pseudoknot region is a big obstacle for RNA secondary structure studies.
In this article, we develop a novel method for comparing pseudoknotted RNA secondary structures based on the tree edit distance by identifying topological centroids of input plane graphs representing RNA secondary structures based on PEELING algorithm devised by Akutsu et al. (2018) and building topological centroid trees from the plane graphs. To show the effectiveness of the proposed method, we perform hierarchical clustering analysis of real pseudoknotted RNA secondary structures obtained from a public database PseudoBase++ (Taufer et al., 2008). The results suggested that the proposed method classifies the pseudoknotted structures according to their functional groups defined by Gene Ontology (GO) (Ashburner et al., 2000; The Gene Ontology Consortium, 2019) much better than the simple comparison of their sequences based on the string edit distance. In addition, we report a case that a distance metric combining the string edit distance and the tree edit distance also yields better clustering performance for the pseudoknotted structures. The proposed method for transforming a plane graph to a tree, planeGraph2tree, is available (https://github.com/feiqiwang/planeGraph2tree).
2. Methods
2.1. Topological centroid tree building by PEELING
An RNA secondary structure can be considered as a plane graph even it is with pseudoknots (Byun and Han, 2009). The proposed method first identifies the topological centroid of an input plane graph of RNA secondary structure, and then transforms the plane graph into a tree (i.e., an acyclic graph) by PEELING algorithm with finding and deleting specific groups of edges, faces, and subgraphs called singly exposed edges, singly exposed face, and adjunct subgraphs, respectively (Akutsu et al., 2018). Here, we briefly review the PEELING algorithm.
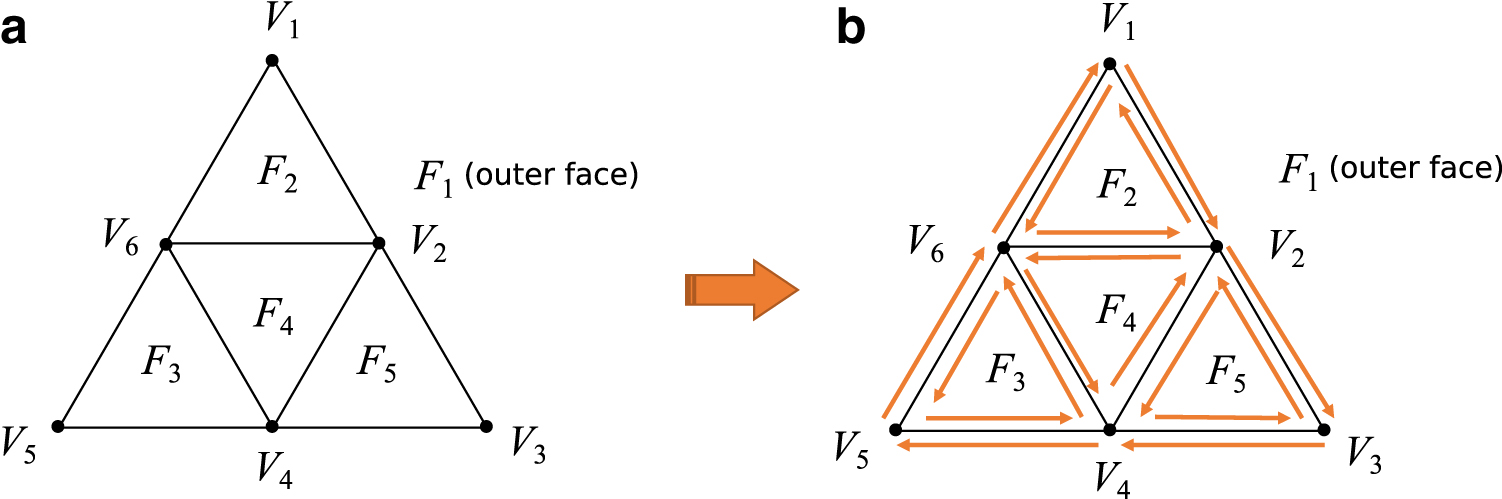
Let G(V,E) be an undirected graph, where V is a finite set of vertices and E is a finite set of edges. A graph is called a plane graph, when G is connected and its planar embedding is given. The areas inside and outside the connected graph are called inner faces and outer faces, respectively. Let C be the directed cycle consisting of the edges of the outer face, where edges are visited in the clockwise order. An inner face of G is called singly exposed if its outer edges in C are connected in C (ignoring direction of edges), whereas an edge is called an outer one if it also belongs to the outer face. Similarly, an edge is called singly exposed if it is not belonging to an inner face and one of its endpoints is of degree 1. In addition, each maximally connected subgraph surrounded by a singly exposed face with sharing only one outer vertex is called an adjunct subgraph.
To identify the topological centroid of a given plane graph G, the PEELING repeats the following two procedures until there does not exist a singly exposed face or edge in G; (1) identify all singly exposed faces and edges and (2) delete outer edges and adjunct subgraphs in these exposed faces and edges (Fig. 1), where the topological centroid is either a vertex, an edge, or a face.
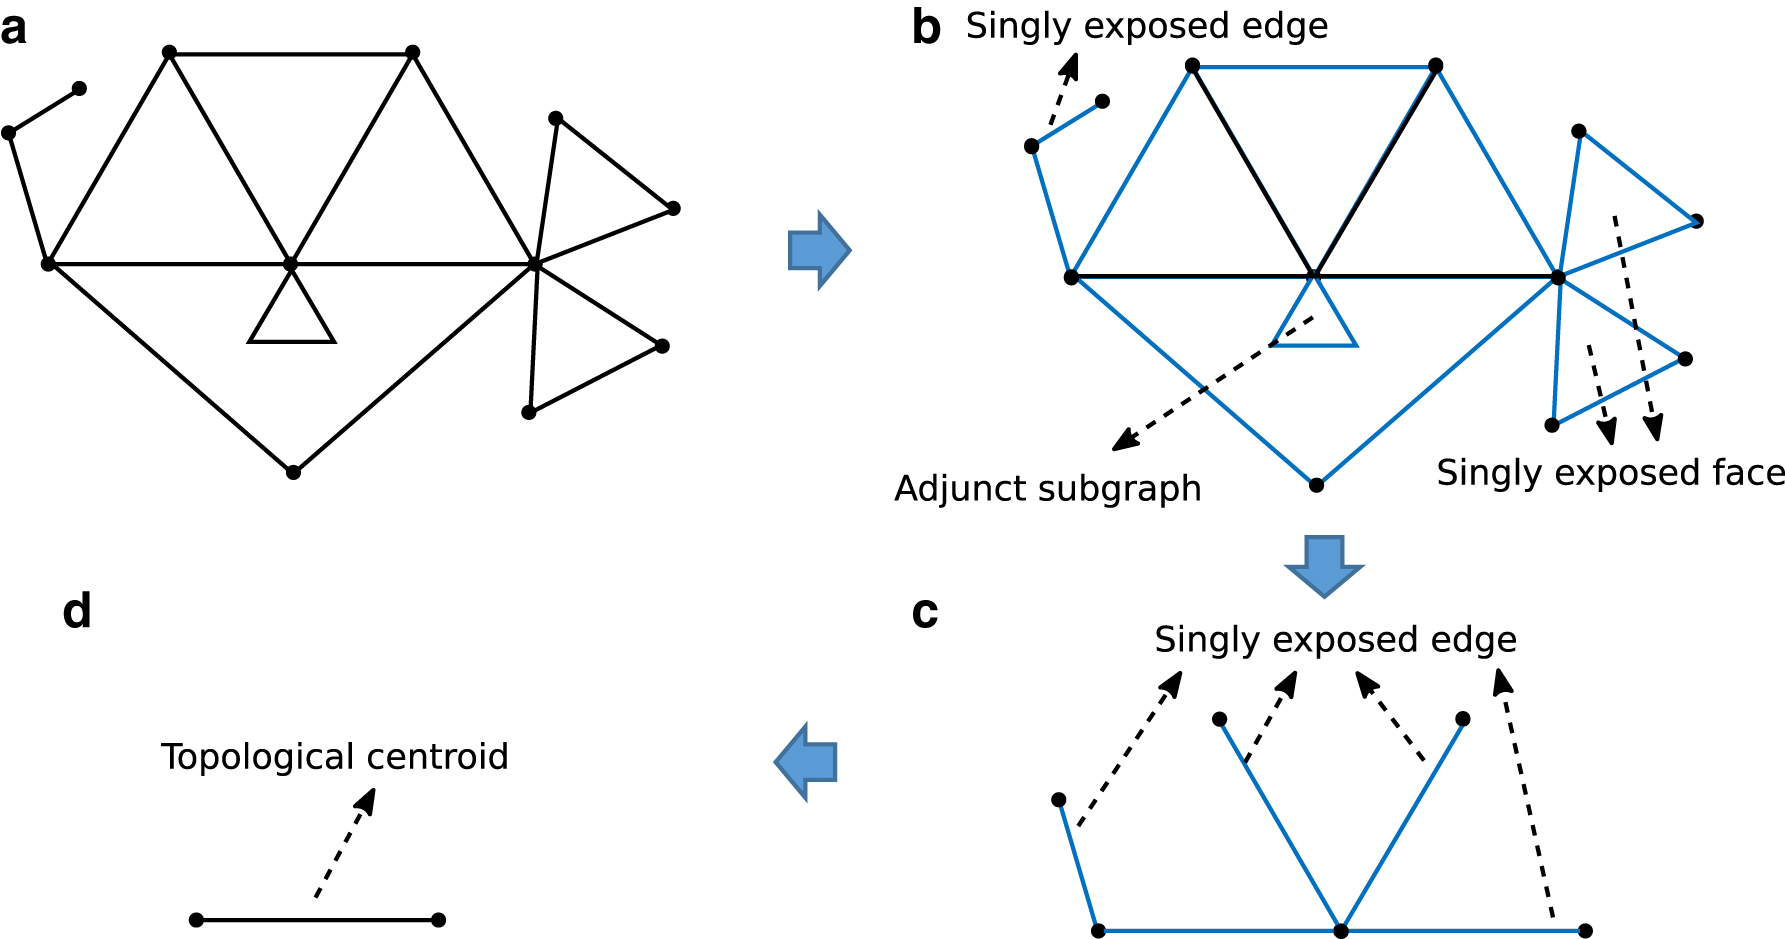
Illustration of the PEELING procedure.
Topological centroid tree is a tree having its topological centroid identified by PEELING as the root. If the topological centroid is either an edge or a face, one of the vertices constituting them is determined as the root. As a result, multiple topological centroid trees are generated from one input plane graph (Fig. 2).
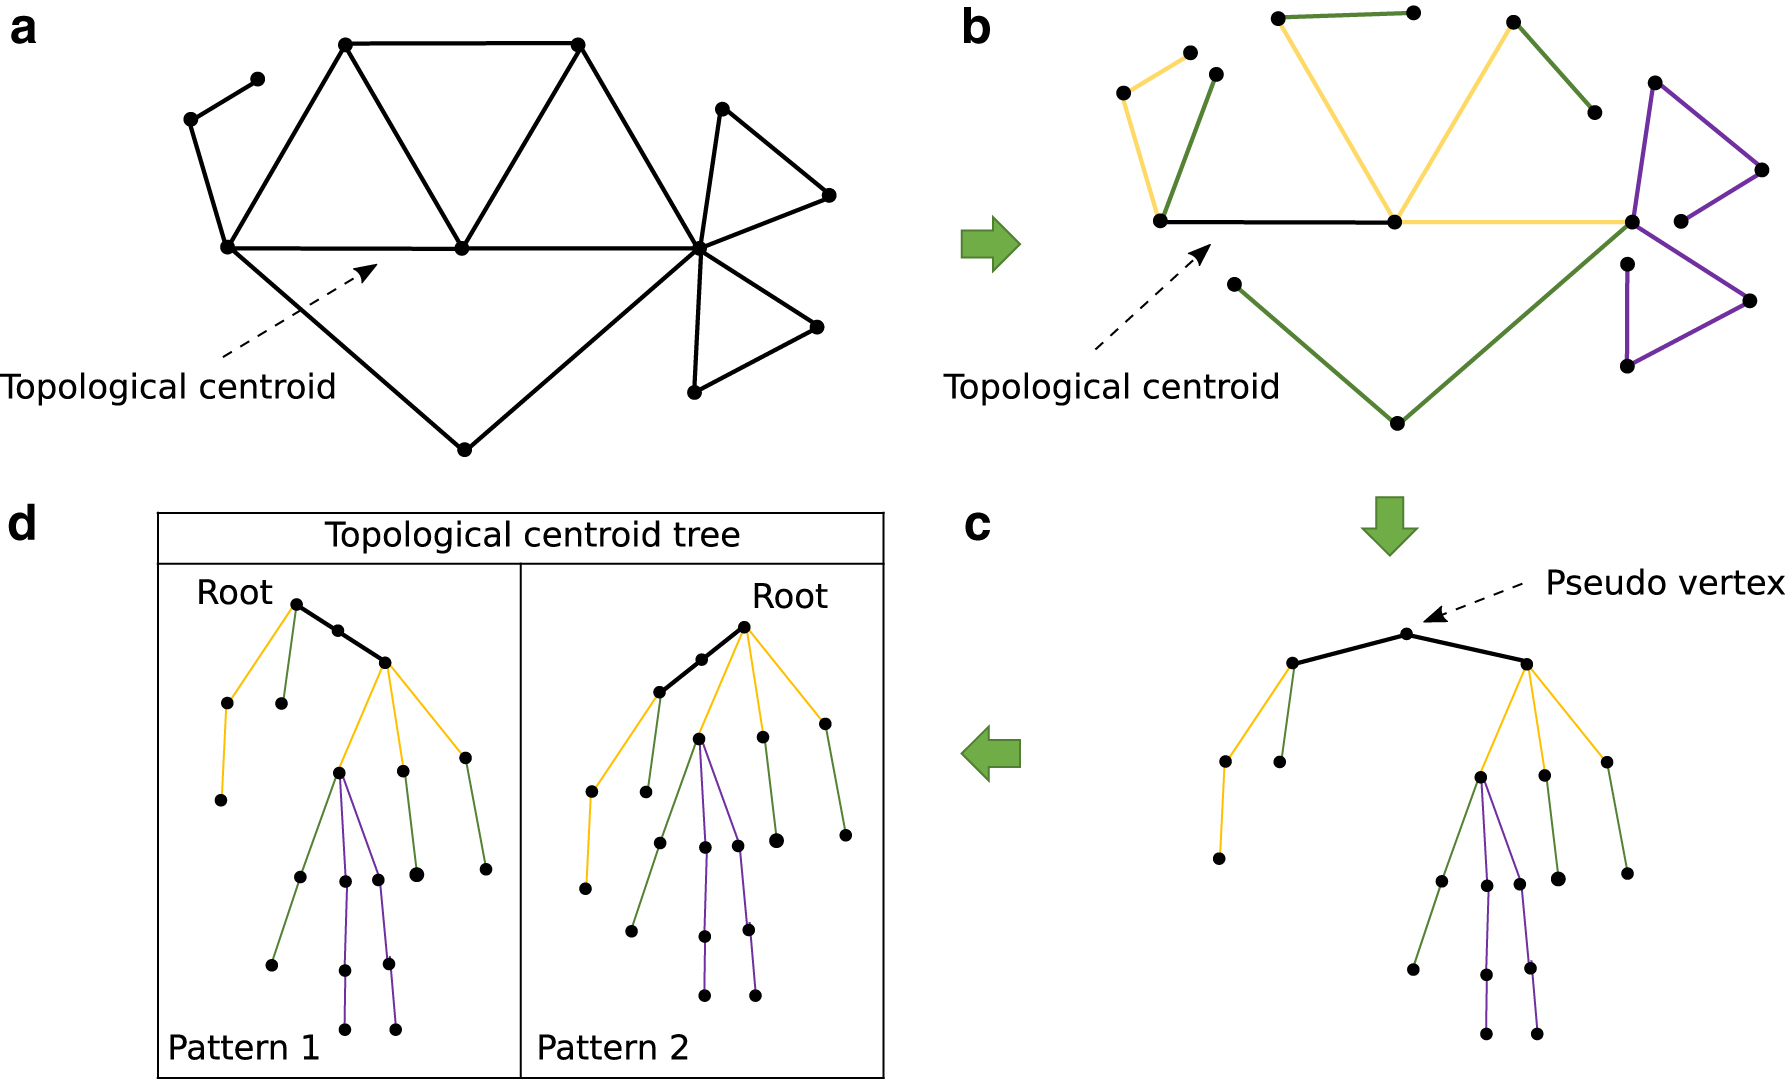
Illustration of topological centroid tree building.
2.2. Comparison of topological centroid trees by tree edit distance
After transforming input plane graphs to topological centroid trees by PEELING, they were compared by tree edit distance under the unit cost model (Bille, 2005). The tree edit distance is one of the most widely used measures for comparing tree structured data and it is defined by the cost of the minimum cost sequence of edit operations for transforming a tree into another tree, where an edit operation is either a deletion of a nonroot node, an insertion of a nonroot node, or a substitution of the label of a node. The unit cost model means that the cost of each edit operation is 1. Although the tree edit distance is computed between a pair of trees, as explained in Section 2.1, there are multiple possibilities for which vertex becomes root in each topological centroid tree when its topological centroid is either an edge or a face. Therefore, here we define the topological centroid tree edit distance as the minimum tree edit distance for all combinatorial pairs of the trees with different root nodes derived from the respective input topological centroid trees (Fig. 3).

Computation of the topological centroid tree edit distance. When computing the topological centroid tree edit distance between a pair of plane graphs, first the plane graphs are transformed to the topological centroid trees, then the tree edit distances are calculated for all combinatorial pairs of the trees derived from the respective topological centroid trees. Finally, the minimum tree edit distance among the all pairs of trees is output.
3. Experimental Results
To demonstrate the effectiveness of the proposed method, we applied the proposed method to a real dataset of pseudoknotted RNA secondary structures. Because it is widely accepted that there is a strong correlation between the structures and functions of biological molecules, here we perform hierarchical clustering analysis that classifies the pseudoknotted structures based on the similarity computed by the (topological centroid) tree edit distance and the functional groups defined by GO.
3.1. Dataset collection and preprocessing
First, we collected 304 pseudoknotted RNA secondary structures from PseudoBase++ (Taufer et al., 2008). The dataset is orderly annotated by PseudoKnotBase (PKB) number (PKB1—PKB304) assigned in PseudoBase++ and each of them is described in BPSEQ format. The BPSEQ format is a simple format for representing structure information in three columns: (1) the first column is the index ordered from 5′ to 3′ for an RNA sequence, (2) the second column contains the label with acronym of nucleotide type, which is either A, U, G, C, X, or Y, where X and Y means the nucleotide would be any type and C or U, respectively, and (3) the third column informs the index of paired partner for the nucleotide, and it is set to be 0 if the nucleotide is unpaired.
On the contrary, the PEELING algorithm assumes that an input plane graph is given by the doubly connected edge list (DCEL) format (Akutsu et al., 2018). The DCEL is an edge-based data structure for easily manipulating and traversing a plane graph, and it contains three sets of record, that is, half-edges, vertices, and faces, to represent topology of a plane graph (Fig. 4). Each edge on a plane graph is represented by two opposite directed half-edges called twins, and all half-edges should be linked by their heads and tails to each other. Each half-edge stored an incident vertex, an incident face, and next/previous half-edges, whereas each vertex and face stored an incident half-edge, respectively.
DCEL data format.
Thus, when applying PEELING, the collected dataset was transformed from BPSEQ format to the DCEL format as a preprocessing. However, the detailed information of PKB71 and PKB75 are not provided in the database, so that the 302 pseudoknotted structures except for them were selected from the 304 structures.
3.2. Clustering analysis according to GO term information
For the collected 302 pseudoknotted RNA secondary structures, their GO information were obtained through EMBL number (Madeira et al., 2019) and Rfam database (Kalvari et al., 2017). However, 100 of the 302 structures were removed from this analysis because their EMBL number or Rfam information were lacking. As for the remaining 202 structures, we further extracted 111 structures to which only 1 GO term was assigned to simplify our clustering analysis, and they included 13 different GOs (GO:0000372, GO:0006401, GO:0006412, GO:0006417, GO:0006452, GO:0019079, GO:0039689, GO:0039705, GO:0043022, GO:0045069, GO:0045727, GO:0046782, and GO:0075523). Finally, we extracted 79 pseudoknotted structures assigned either 1 of the 4 GOs (GO:0043022 GO:0046782 GO:0006417, and GO:0075523), which were most frequently included in the 111 structures.
The hierarchical clustering results for the 79 structures by hclust with ward method on a programming language R are given in Figure 5. The input distance matrix for the hclust was computed by RTED, which is a software for computing the tree edit distance between ordered trees (Pawlik and Augsten, 2011). The labels show PKB numbers and GO numbers, and Figure 5a and b correspond to the results of the string edit distance-based comparison of the RNA sequences and our tree edit distance-based comparison of the RNA secondary structures, respectively. As shown in the results, the RNAs were classified better according to their functions by the tree edit distance-based RNA comparison than the sequence-based comparison. For example, the RNAs with GO:0075523 were classified to one branch in the tree edit distance-based comparison, whereas they were separated into two branches in the sequence-based comparison. The tendency can also be seen in GO:0006417, that is, most of the RNAs with GO:0006417 except for three RNAs (PKB119, PKB120, and PKB180) are classified into one branch in the tree edit distance-based comparison but those were divided into two branches in the sequence-based comparison.

Hierarchical clustering results for pseudoknotted RNA secondary structures based on four GOs. The hierarchical clustering results of the string-based edit distance and the tree edit distance-based comparison for the pseudoknotted RNA secondary structures according to four GOs (GO:0043022, GO:0046782, GO:0006417, and GO:0075523) are shown in
To further evaluate the effectiveness of our comparison approach, we demonstrated another clustering analysis for a larger set of GOs and classified them according to their two super families, macromolecule metabolic process (MMP) and viral process (VP). For the 13 GOs from the 111 structures selected as mentioned previously, GO:0043022 was classified according to the category of molecular function, whereas the other 12 GOs were classified according to the category of biological process. Therefore, we selected 77 pseudoknotted RNA secondary structures of the 12 GOs by removing the 34 structures of GO:0043022 in the following analysis. Among the 12 GOs, the 6 and the 5 GOs have the same ancestor MMP (GO:0043170) and VP (GO:0016032), respectively, and GO:0039705 is a common offspring of MMP and VP.
The clustering results of the 77 RNA structures with 12 GOs from the two super families of MMP and VP are given in Figure 6. Figure 6a and b are the clustering results based on the string edit distance and the tree edit distance for the structures, respectively. In this experiment, the clustering result of a combination of the string edit distance and the tree edit distance is also given in Figure 6c, where the combination means that the distance metric is defined by the sum of the edit distance and the tree edit distance. As a result, there was no significant difference between the clustering results based on the string edit distance and the tree edit distance. However, 10 structures of MMP separated into 2 or 3 different branches in these 2 methods were clustered in 1 branch in the combination method (see labels surrounded by red boxes in Fig. 6). Because they have similar secondary structures, it can be concluded that there exists a case that the sensitivity for the difference in pseudoknotted RNA secondary structures transformed from the plane graphs was increased by combining the string edit distance and the tree edit distance.
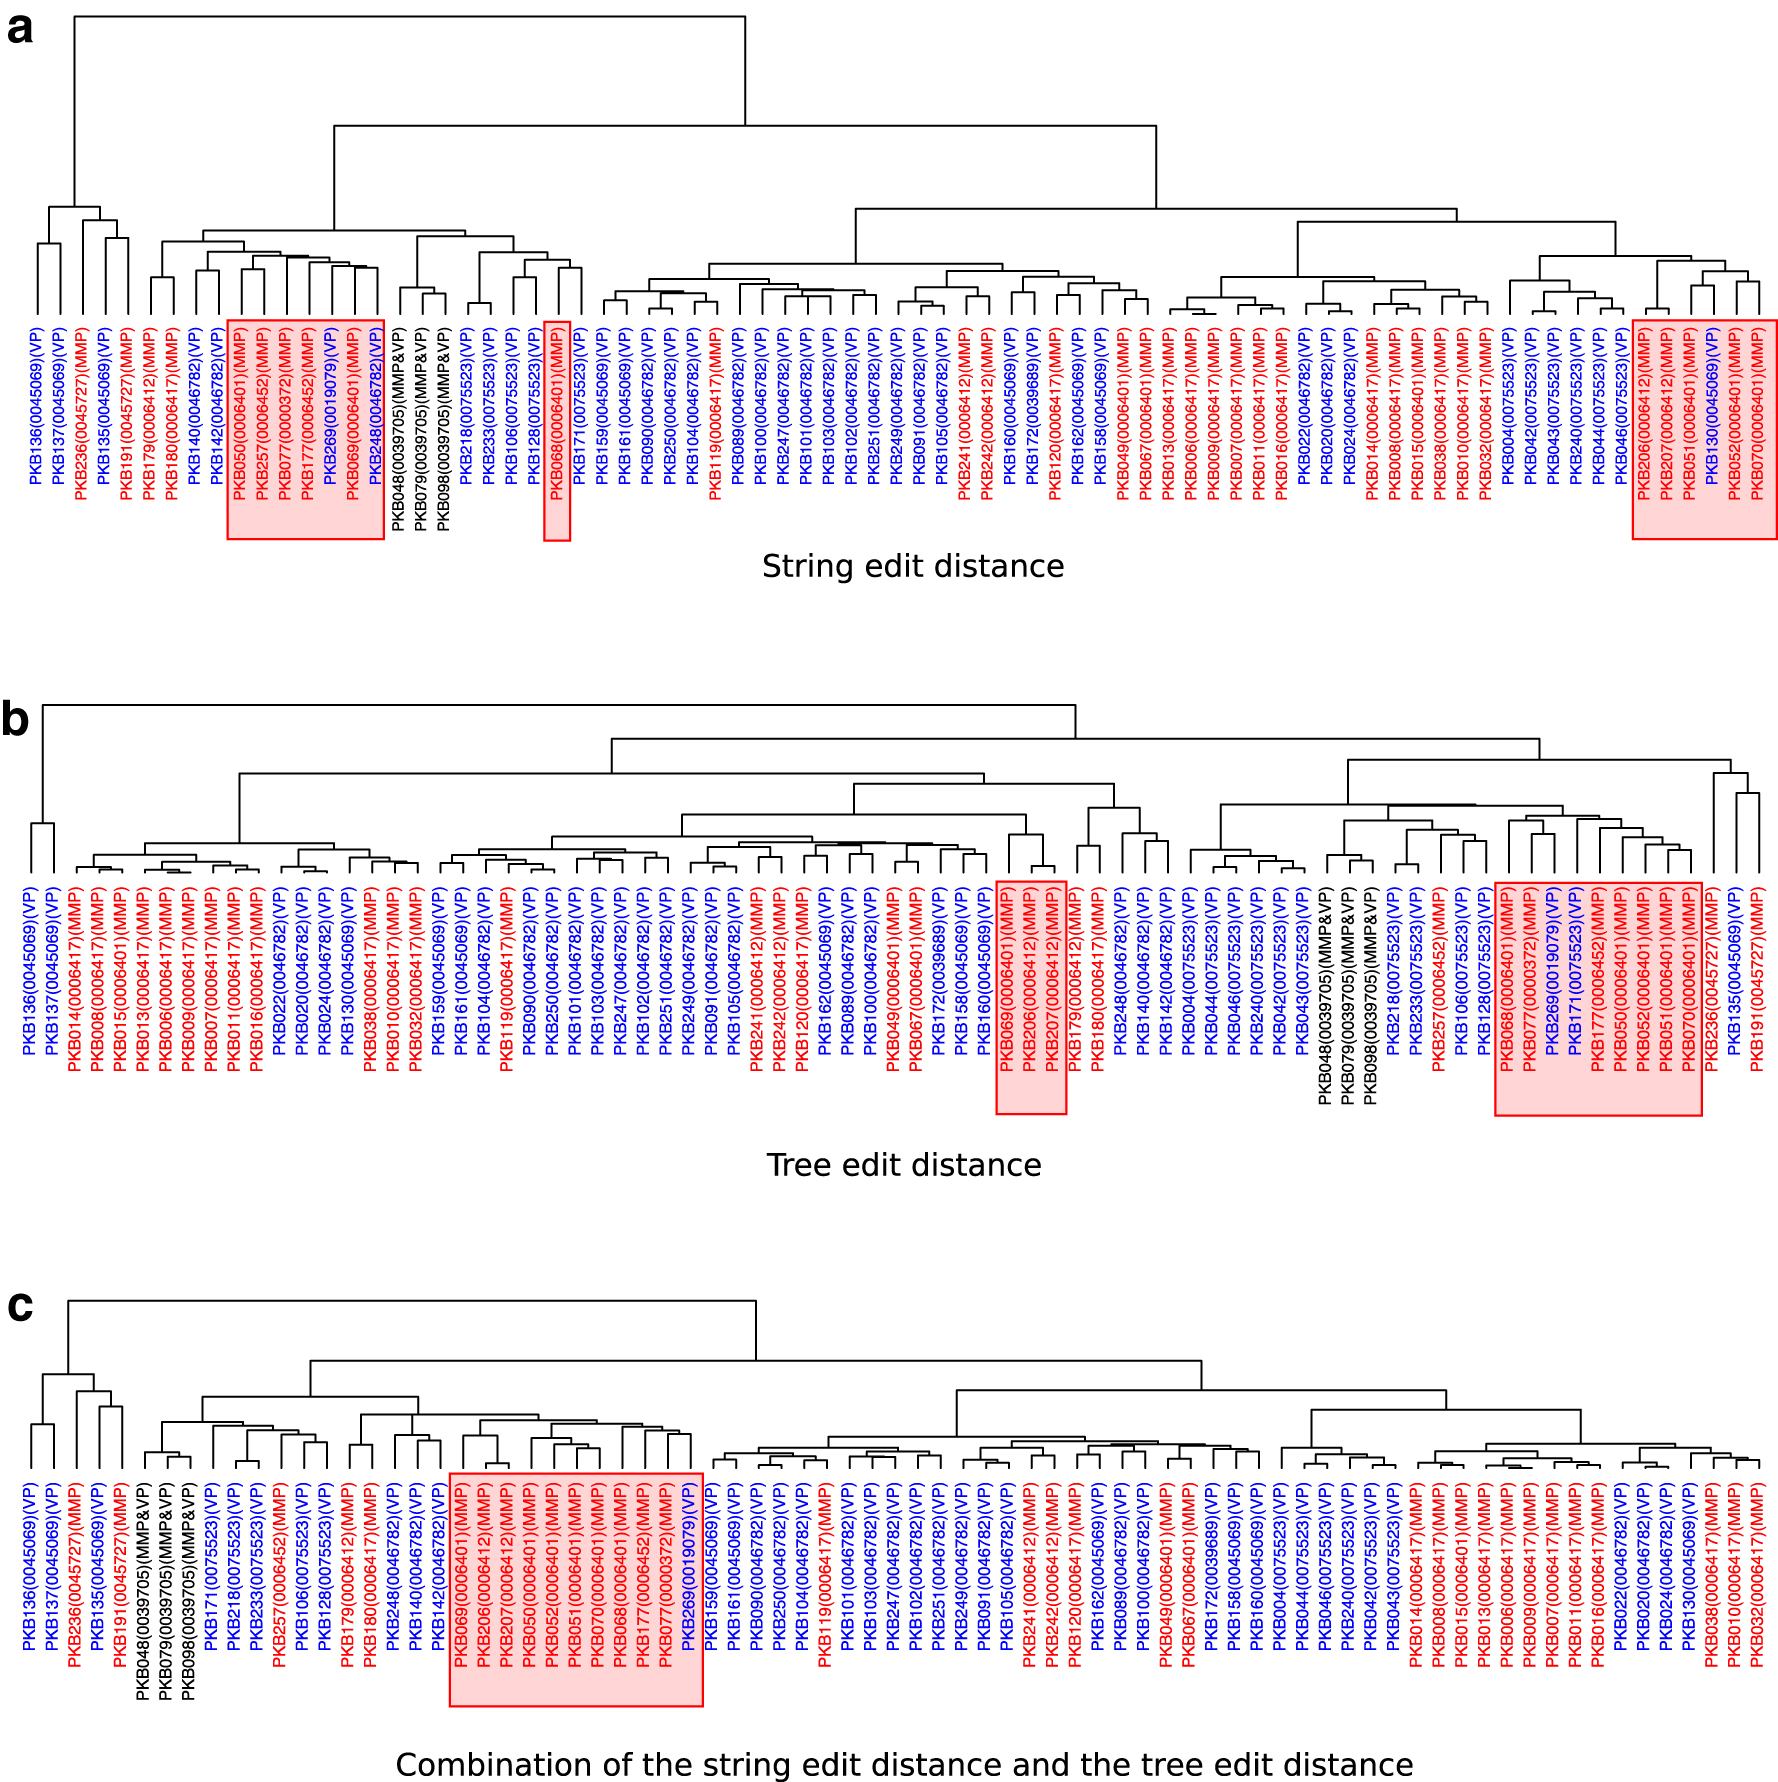
Hierarchical clustering results for pseudoknotted RNA secondary structures based on larger functional groups MMP and VP. The hierarchical clustering results of the string-based edit distance and the tree edit distance-based comparison for the pseudoknotted RNA secondary structures according to the functional groups MMP and VP are shown
4. Discussion
We have introduced a novel method for comparing pseudoknotted RNA secondary structures based on the tree edit distance by transforming input plane graphs representing RNA secondary structures to trees by topological centroid computing. In the computational experiments using real pseudoknotted RNA secondary structures collected from a public database PseudoBase++, the proposed method showed much better hierarchical clustering results of the structures according to their GOs than the simple sequence-based comparison. In addition, the effectiveness of using a distance metric combining the string edit distance and the tree edit distance was also shown.
However, the secondary structural information was degenerated when converting a plane graph into a tree; hence, a complete comparison was not achieved. For example, when focusing on a certain branch of a tree, whether it was originally a single-exposed edge or a resulting edge of PEELING for a single-exposed face is not taken into account in the comparison. In addition, when there exists a single-exposed edge and a single-exposed face having the same label sequence, it may be difficult to distinguish them because they become identical after PEELING.
There are other points to note besides the loss of structural information. In this comparison method, a tree structure is given as an ordered tree, that is, an order relationship from left to right is defined between child vertices. Indeed, an RNA secondary structure is often represented as an ordered tree, but a tree generated by the proposed method has no order relationship between vertices disconnected by PEELING. Thus, it is considered appropriate to treat it as an unordered tree. The tree edit distance computation between unordered trees, however, is known to be NP-hard (Zhang et al., 1992), and there is no effective algorithm that can compute the distance in polynomial time. Therefore, in this study, a tree is treated as an ordered tree to efficiently compute the tree edit distance while sacrificing some accuracy.
Finally, of note, we collected pseudoknotted RNA secondary structures from PseudoBase++ and performed clustering analysis according to GO information based on the assumption that there exists a strong correlation between the structures and functions of biological molecules. However, PseudoBase++ provides not the whole structure but the partial structure for each RNA, so it may be insufficient to evaluate the clustering results in terms of their functions. Nevertheless, the fact that the proposed method showed better clustering results than the simple sequence comparisons suggests that the partial structures of RNAs may contribute to their functions.
Footnotes
Author Disclosure Statement
The authors declare they have no conflicting financial interests.
Funding Information
This study was supported by JSPS Grant No. 18H04113.