
Abstract
COVID-19 is an infectious disease caused by the severe acute respiratory syndrome coronavirus 2 (SARS-CoV-2). The viral genome is considered to be relatively stable and the mutations that have been observed and reported thus far are mainly focused on the coding region. This article provides evidence that macrolevel pandemic dynamics, such as social distancing, modulate the genomic evolution of SARS-CoV-2. This view complements the prevalent paradigm that microlevel observables control macrolevel parameters such as death rates and infection patterns. First, we observe differences in mutational signals for geospatially separated populations such as the prevalence of A23404G in CA versus NY and WA. We show that the feedback between macrolevel dynamics and the viral population can be captured employing a transfer entropy framework. Second, we observe complex interactions within mutational clades. Namely, when C14408T first appeared in the viral population, the frequency of A23404G spiked in the subsequent week. Third, we identify a noncoding mutation, G29540A, within the segment between the coding gene of the N protein and the ORF10 gene, which is largely confined to NY (
1. Introduction
COVID-19
SARS-CoV-2 is highly transmissible, estimates for its basic reproductive ratio, R0, vary widely, but commonly range between
After the first genome sequence from Wuhan was isolated, the National Center for Biotechnology Information (NCBI) and global initiative on sharing all influenza data (GISAID) databases began collecting full genome data worldwide (Elbe and Buckland-Merrett, 2017; Hatcher et al., 2017; Shu and McCauley, 2017). The collected viral genomes were annotated using sequence alignment, and tagged with their corresponding geographical and temporal metadata. Phylogenetic relations between the novel SARS-CoV-2 viral genome and other types of coronaviruses were reported in Andersen et al. (2020) and Lu et al. (2020), which helped to identify the origin of this virus (Xie and Chen, 2020). Its genomic architecture was described in Astuti and Ysrafil (2020) and Kim et al. (2020), enabling efficient genetic annotation. Although significant mutations on the viral genome were observed (Yin, 2020), the genome itself is considered stable (Jia et al., 2020), with current mutational analysis being mostly focused on the coding segments.
A23404G is one such significant mutation that leads to a D–G amino acid change at the 614th position in the Spike protein. It is responsible for an increase in the severity of infection across Europe (Korber et al., 2020). In silico structural modeling suggests that the amino acid change can improve binding to the ACE2 receptor (Song et al., 2018; Xu et al., 2020) and laboratory testing suggests that G23404 significantly increases the viral load in patients when compared with A23404 (Korber et al., 2020), with this in turn affecting the transmissibility of the virus. This mutation started dominating the viral population in almost every geographical location since the end of March 2020.
We provide evidence that despite the fact that SARS-CoV-2 is a genetically robust organism (Jia et al., 2020), the mutational signature of SARS-CoV-2 is geospatially differentiated and that we are dealing with a virus exhibiting a high degree of adaptability. The high transmission rate of this virus facilitates an ample spread, which in turn allows for a wide range of mutations and a high complexity of mutational interactions. Specifically, this article provides evidence that macrolevel pandemic dynamics, such as social distancing, steer the genomic evolution of the SARS-CoV-2 population. This view complements the prevalent paradigm that microlevel observables control macrolevel parameters.
We organize our analysis as follows: first, due to differences in culture, policy, and the severity of infections, as the pandemic progresses macrolevel dynamics vary with geographical location, resulting in distinct selective pressures. This observation manifests in distinct mutational signatures of the virus population for different geospatial blocks. Indeed, we observe differences in mutational signals for geospatially separated populations such as the prevalence of A23404G in CA versus NY and WA, suggesting a feedback loop connecting sociobehavioral patterns with mutational signatures. We show that the feedback between macrolevel dynamics and viral population can be captured employing a transfer entropy (TE) framework.
Second, we establish the aforementioned complexity of mutational interactions by having a closer look at the mutation C14408T and its connection with A23404G. Our analysis indicates that the interaction of these two mutations among others is responsible for an increase in viral fitness.
Third, we illustrate the high degree of adaptability the virus possesses by identifying a noncoding mutation, G29540A, which is overwhelmingly localized in NY (
All these findings suggest that macrolevel sociobehavioral measures have direct impact on viral genomics, with TE emerging as a well-suited framework for analyzing the resulting feedback loops.
To facilitate an in-depth analysis, we develop an analysis platform that monitors mutations in the SARS-CoV-2 genome at different geographical and temporal resolutions, with interactions among multiple mutations being of particular interest. We believe that it is of crucial importance to identify such feedback loops to formulate effective responses to the COVID-19 crisis.
2. Methods
2.1. SARS-Cov-2 full genome data and significant mutations
We collected full SARS-CoV-2 genomic sequences from the NCBI and GISAID databases (Elbe and Buckland-Merrett, 2017; Hatcher et al., 2017; Shu and McCauley, 2017), covering isolates gathered starting from December 24, 2019 up to May 11, 2020. The data were differentiated by geographical and temporal resolutions. All sequences were aligned to the reference sequence (NCBI ID: NC_045512) to obtain genomic annotation.
2.2. Macrolevel mobility-derived data
The workplace mobility indices used in the TE calculations have been collected from the publicly available Google mobility-derived data sets (Aktay et al., 2020) for the states of CA and NY. The Google workplace mobility indices reflect how many LH (location history) users spent >1 hour at their places of work for each day and each geographical (state) area. The counts are aggregated by places of residence of LH users with the metrics being protected by differential privacy. To fit our available microscale series, mobility-derived data were considered over the following time intervals: for CA 02/29/2020-05/01/2020 and for NY 02/29/2020-04/24/2020, see Supplementary Data for any details on the data sets.
2.3. TE estimation and statistical tests
We employed TE measures, rooted in information theory (Schreiber, 2000) to quantify the causal flow from the mobility-derived data to the mutational composition of the viral population. TE is a nonparametric statistic that measures the amount of directed (time-asymmetric) transfer of information between two random processes. TE calculations employ portions of the histories of the two times series and as such can naturally account for the time delay between the series studied. Given two time series I and J, the TE from J to I quantifies the degree to which knowledge about the history of J allows one to predict future values of I. The quantity we compute is based on the Rényi entropy that introduces a weight parameter
where
In our analysis, the TE is estimated using the RTransferEntropy package (Behrendt et al., 2019). By construction, the aforementioned TE formula requires discrete time series as input. As our microscale data are mutational frequencies, at each point in time, we need to retrieve values from a continuous distribution. As a result, a discretization scheme is employed for each of the macro- and micro time series. For each series its values are distributed into a three bin triplet based on the
Effective TE is a means of reducing self-correlation within each time series. The RTransferEntropy package accomplishes this by subtracting from the base TE the mean TE from a shuffle of the series to the series itself, obtained by averaging >100 shuffles. Namely,
The p-value and standard error for the TE calculation is computed by the RTransferEntropy package in the following manner: for a
3. Results
3.1. Geospatially differentiated mutational signatures
As the pandemic progresses, since macrolevel dynamics varies with geographical location, distinct selective pressures are being exerted. We provide evidence that these pressures modulate the mutational landscape and lead to distinct geospatially separated mutational signatures within the viral population, under the assumption that the isolates investigated form an adequate representation of the distribution of viral genomes across the pandemic.
To this end we first investigate the relative frequency of G23404 in the viral population in different locations and monitor its relative frequency changes over time. The relative frequency is computed within a 14-day sliding window. For such a fixed time window and location, we consider all sequences that are collected at that location and we compute the relative frequency of G23404 within that data set.
In the United States, infections were initiated and established across the country, by genomes of the SARS-CoV-2 virus exhibiting the original A23404 form. In early March, the G23404 variant was introduced to the U.S. territories, and by the end of March it dominated >60
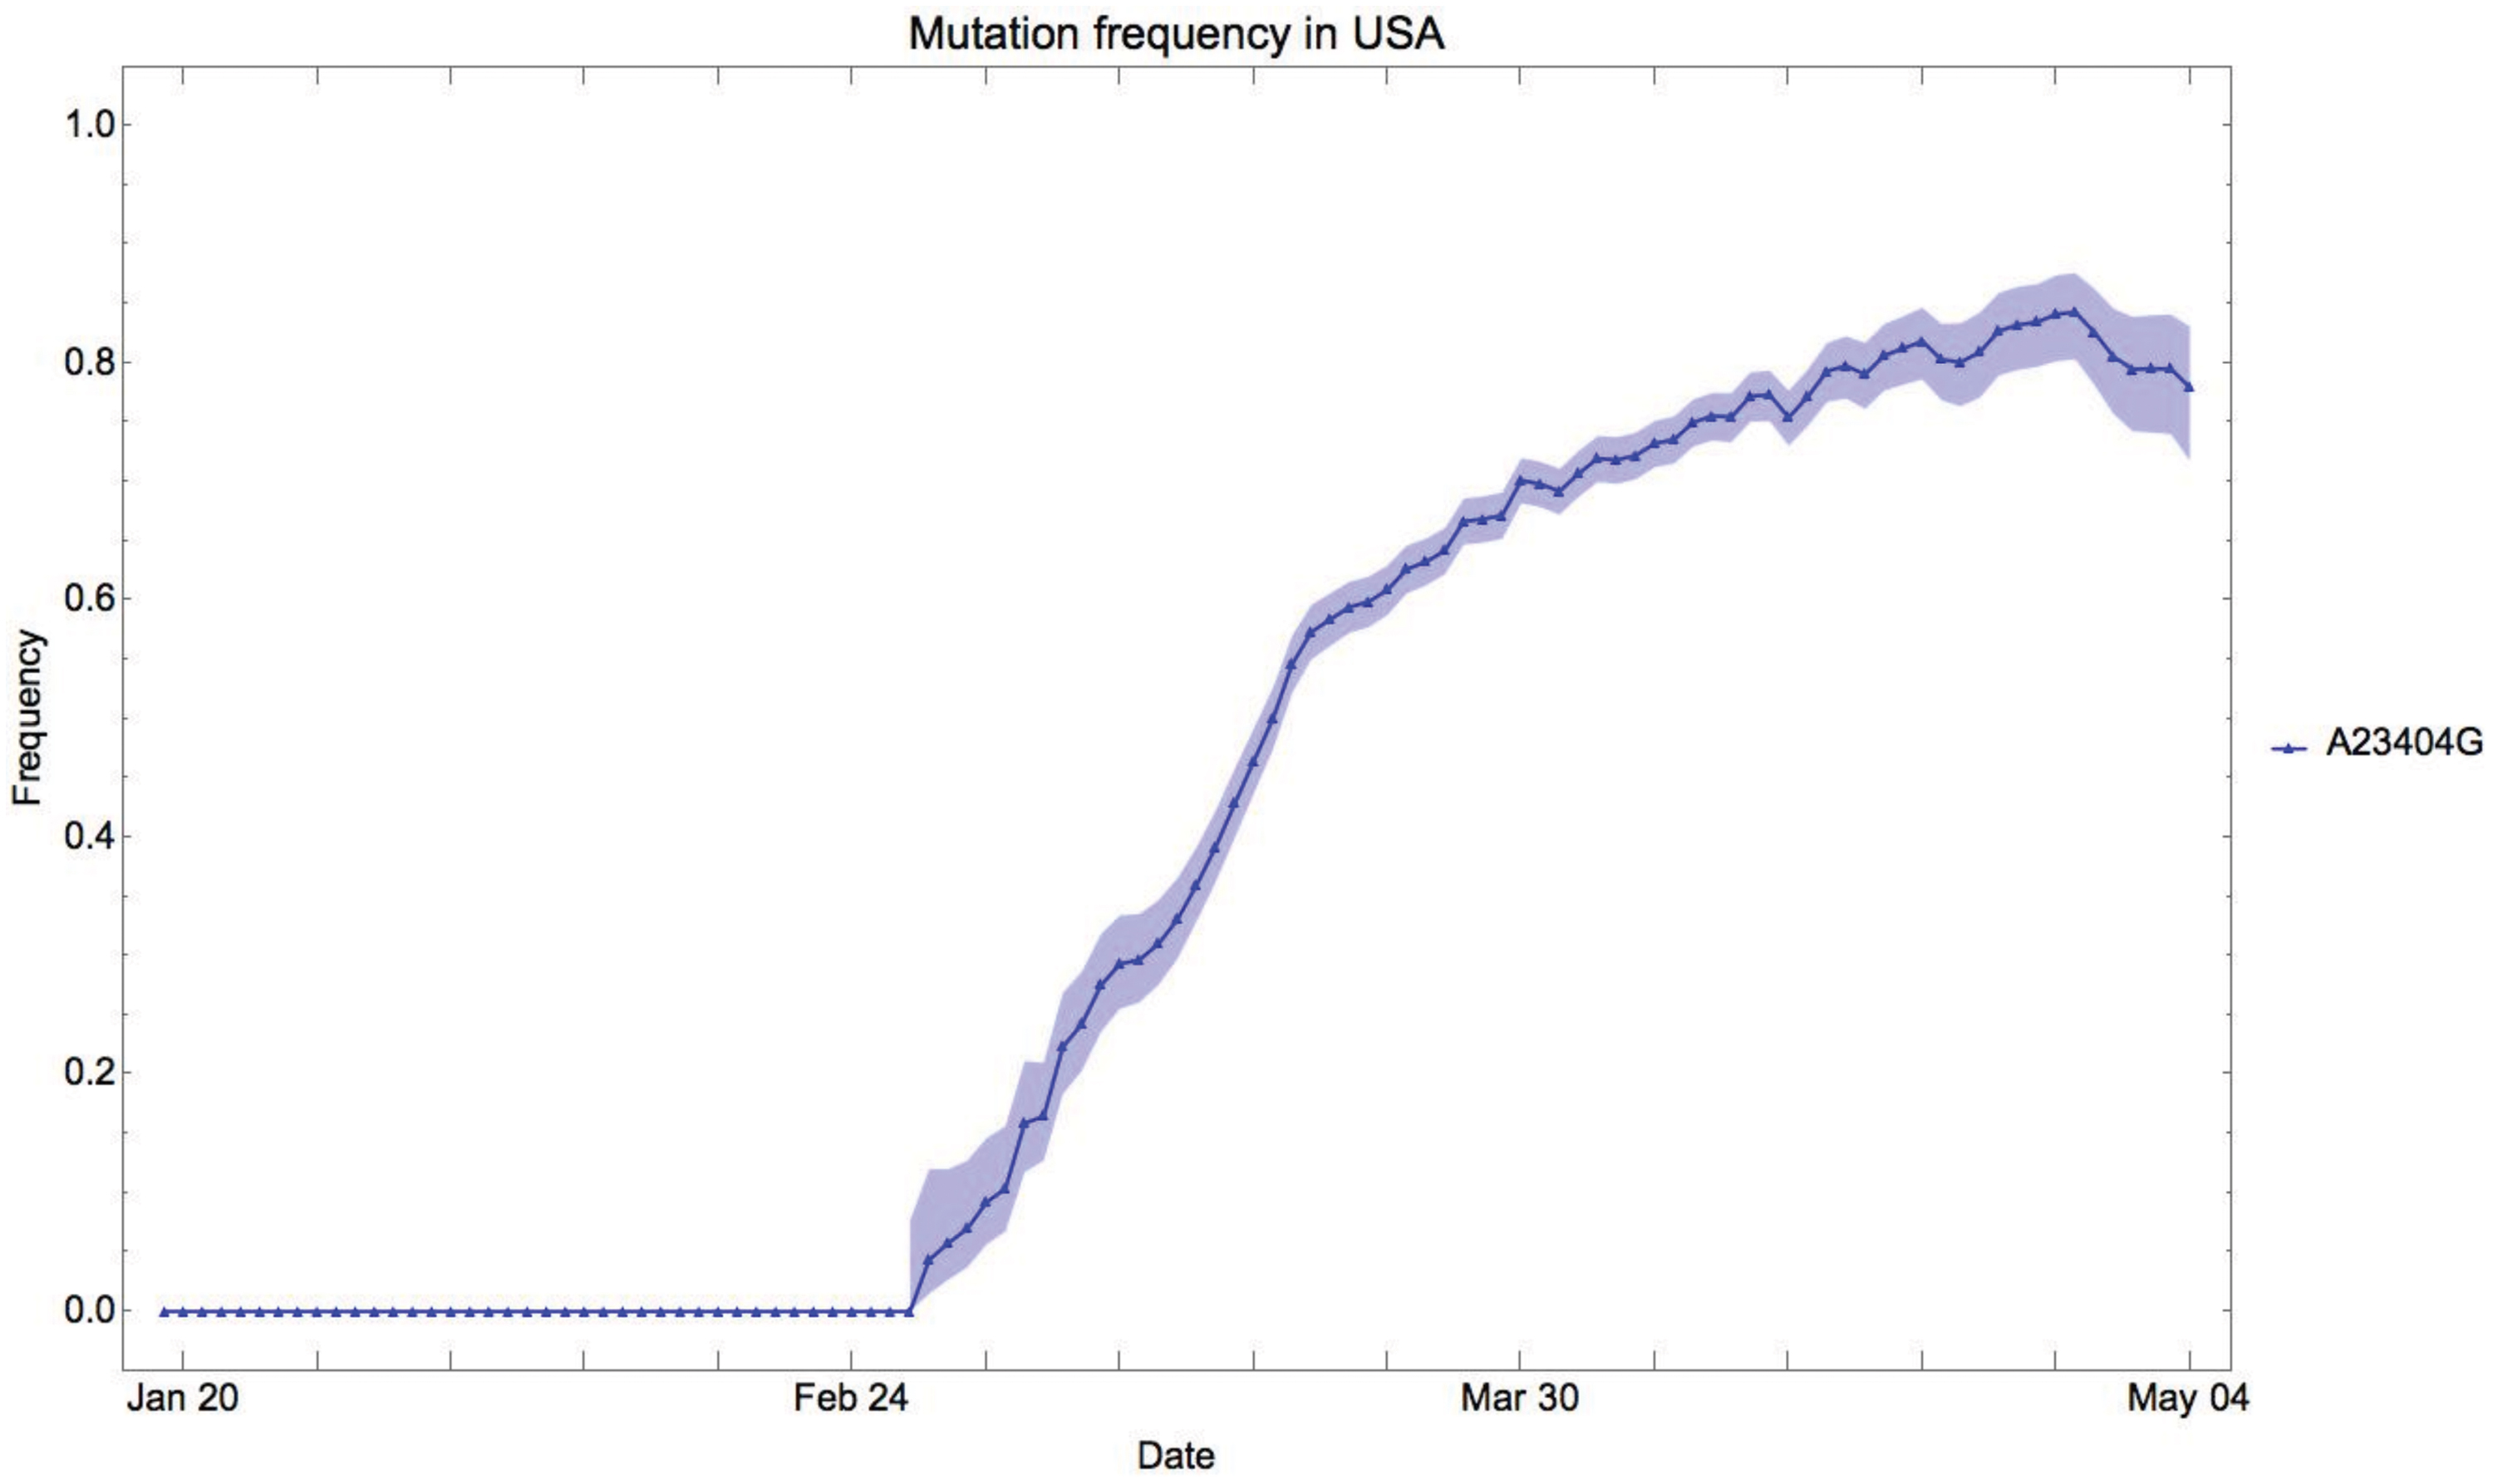
Relative frequency of G23404 in the United States: the y-axis represents the G23404 frequency in the SARS-CoV-2 data collected in the United States within a 14-day time window. The x-axis indicates the last day of the time window. The shaded area denotes a
If we increase the resolution to the state level, we observe the aforementioned distinct mutational signatures, see Figure 2. The observed patterns reflect the impact of the social-behavioral dynamics on the mutational composition within the viral population. For instance, the frequency of G23404 for WA shows a similar trend to that of the U.S. data: A23404 dominates, then G23404 takes over the viral population. In NY, however, the frequency is distinctively different. At the beginning of March, G23404 already accounts for 80

The relative frequency of G23404 in WA (green), NY (blue), and CA (red): the y-axis represents the G23404 frequency in the SARS-CoV-2 sequences collected within the 14-day window. The x-axis indicates the last day of the time window. The shaded area denotes a
3.2. Quantifying the effects of policies on the viral population
To quantify the impact of sociobehavioral patterns on the composition of the viral population, we employ TE measurements between sociobehavioral and mutational composition data for CA and NY, respectively. TE is a nonparametric statistical measure that quantifies the amount of directed (time-asymmetric) transfer of information between two random processes (Schreiber, 2000). For this purpose we recruit Google mobility-derived data sets (Aktay et al., 2020), in the form of a day-to-day time series of workplace mobility scores for CA and NY, respectively. We compute the directed Rényi TE (
Macro to Micro Causal Flow for CA and NY
From left to right: columns represent the states considered, the macro to micro TE values, the effective macro to micro TE, the SE, and the p-values. The last column indicates the TE significance:
SE, standard error; TE, transfer entropy.
Our TE analysis indicates that the observed viral population of CA and NY are causally linked to their respective state policies that govern social contact and workplace mobility in each of the two states.
3.3. Interactions of A23404G with other mutations
In this study, we address the complexity of mutational interactions by studying mutations co-occurring with A23404G. We observe that A23404G is often accompanied by three other mutations: C241T, C3037T, and C14408T (Yin, 2020). C241T is a mutation in the
The earliest A23404G mutation in Europe was identified in Germany (EPI_ISL_406862, sampled January 28, 2020), and was accompanied by C241T, C3037T, but not by the mutation at 14408. For European sequences with specific collection dates, C14408T was not observed until 2/20/2020. During this time period, C241T, C3037T, and A23404G always co-occurred. In the viral population, the A23404 and G23404 forms were cocirculating, with A23404 being more common while the relative frequency of G23404 oscillated around 20%, see Figure 3. One sequence sampled on February 20, 2020 in Italy (EPI_ISL_412973) was the earliest data point that exhibited all four mutations in Europe. After that, the frequency of all four mutations grew abruptly to >60% in the span of a week. This observation suggests that the increase in fitness might not depend solely on the mutation A23404G, and instead, might be caused by the presence of interactions within a mutational clade. We suspect that these sites, taken together, are involved in certain biochemical functions that constrain them to coevolve.
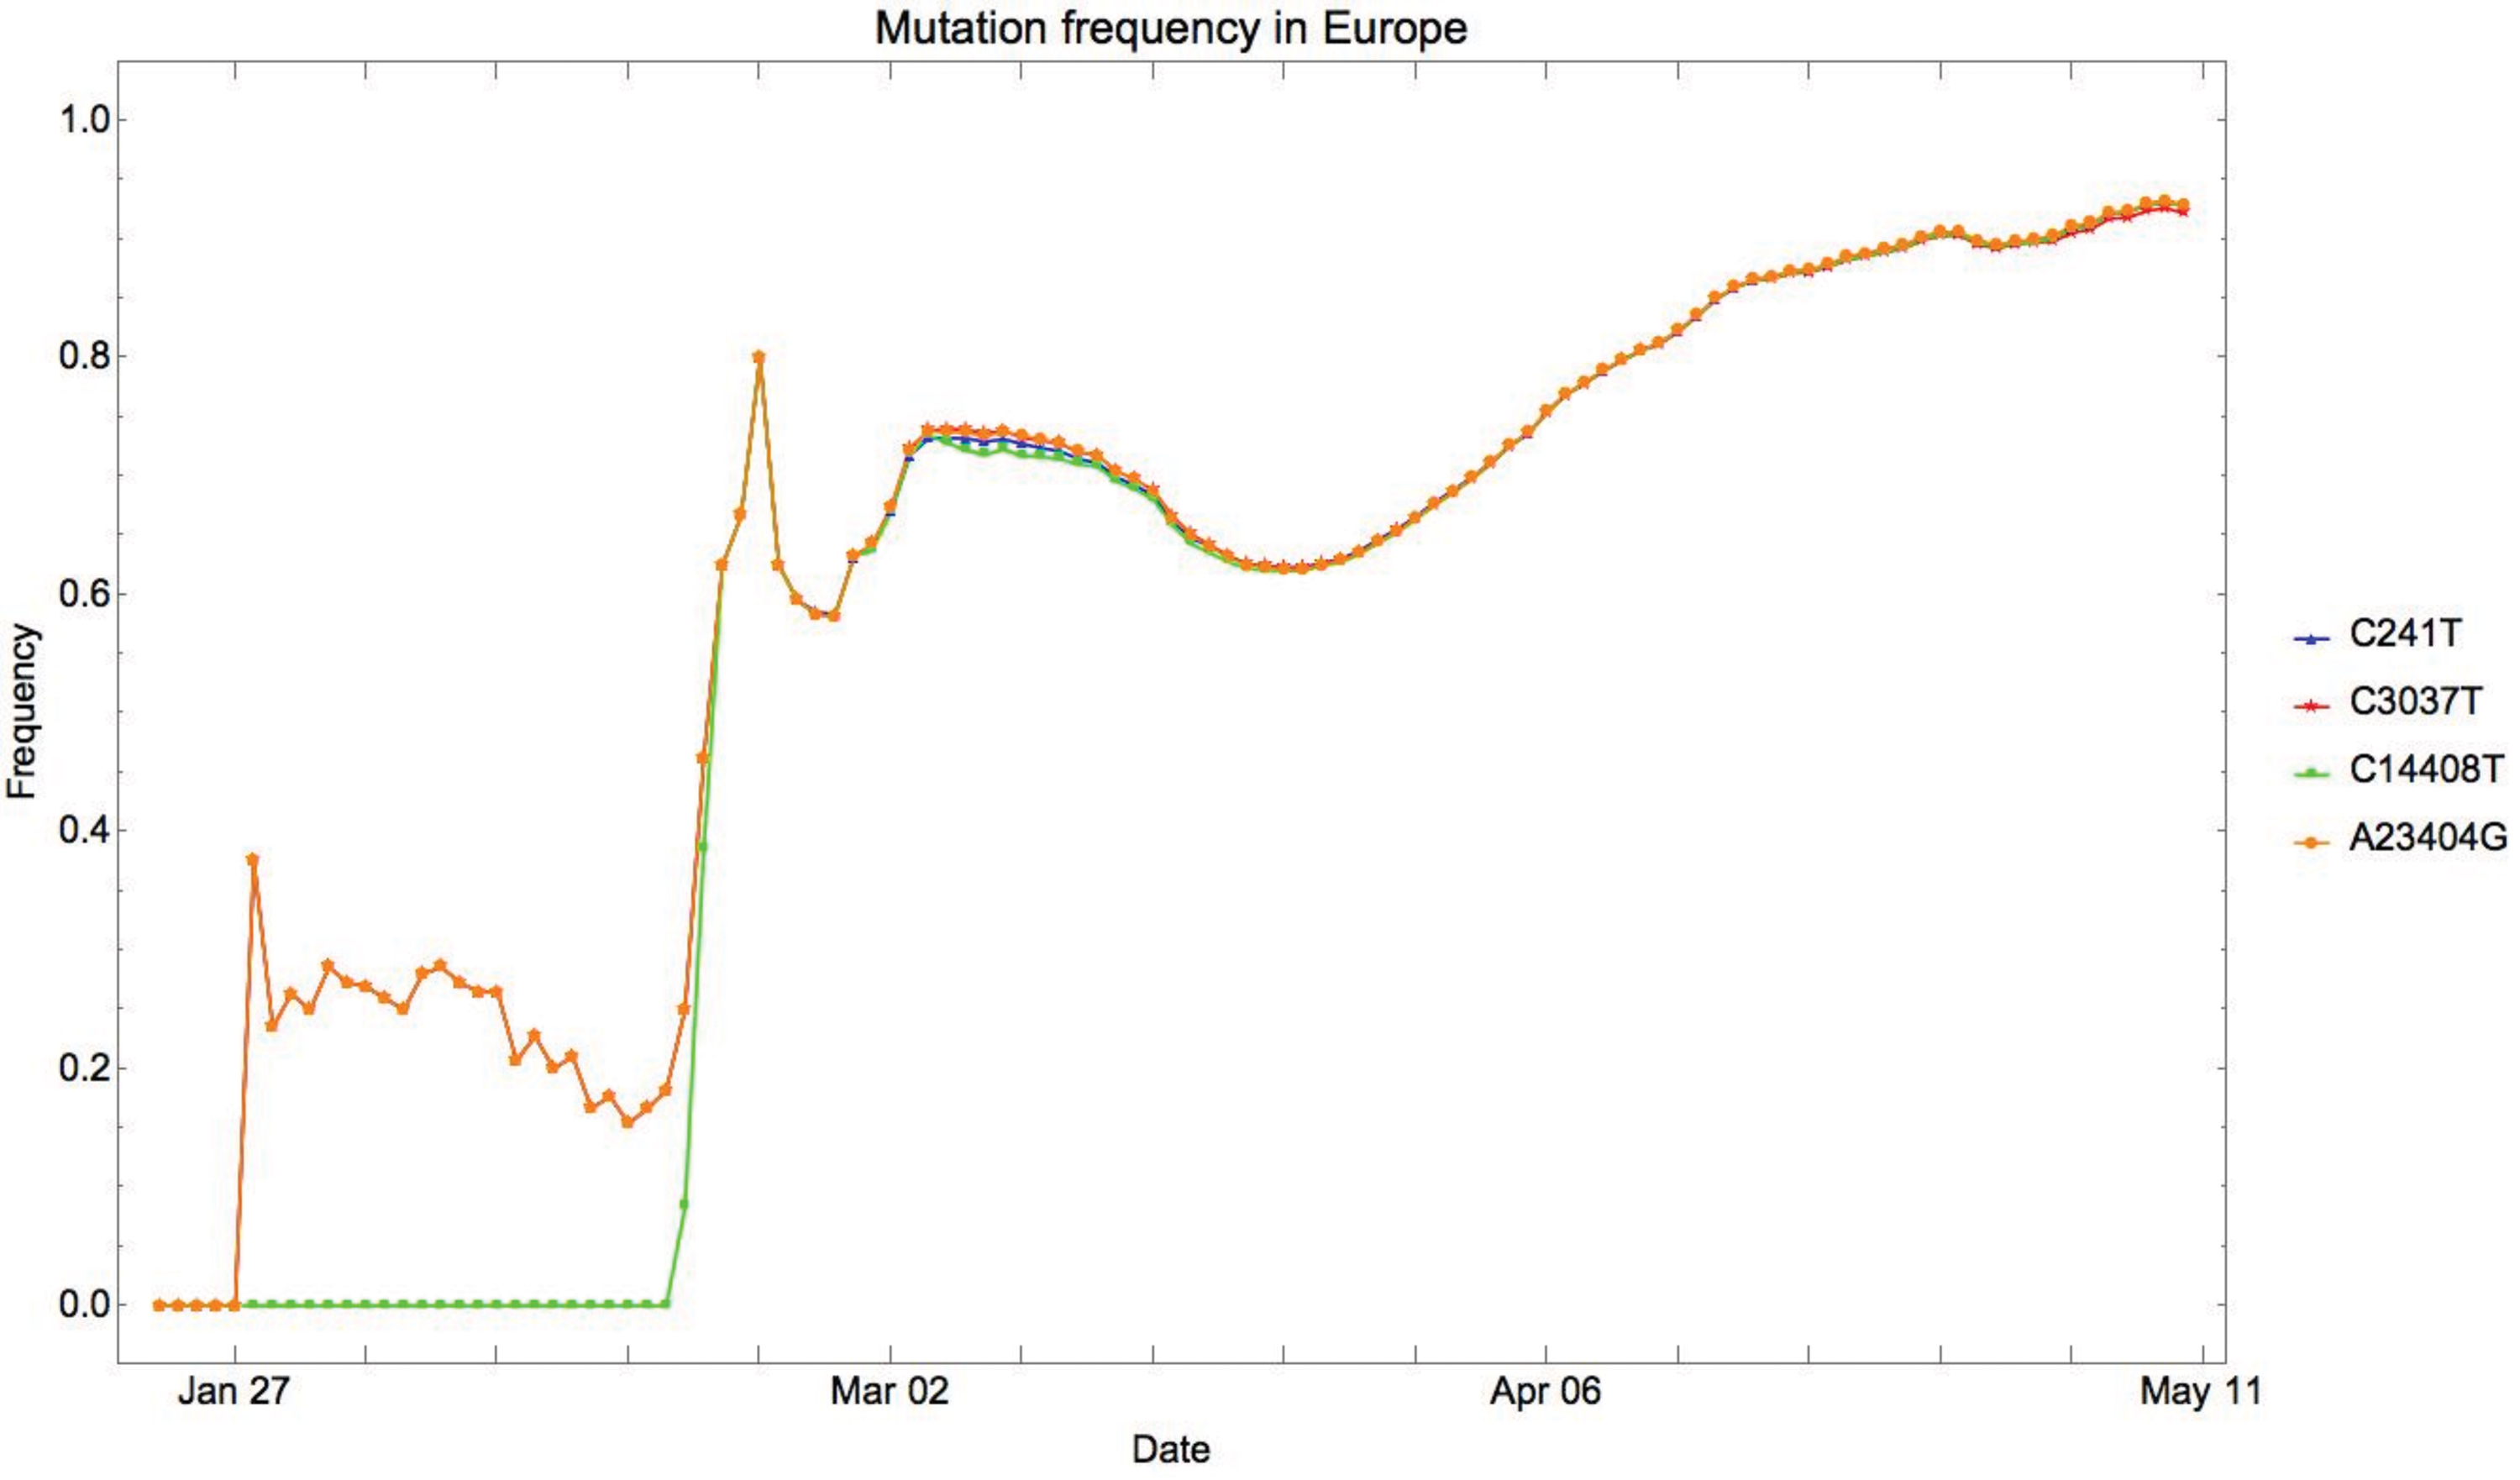
The relative frequency of T241 (blue), T3037 (yellow), T14408 (green), and of G23404 (red) in Europe: the y-axis represents the relative frequency of the mutation in the SARS-CoV-2 sequences collected within the 14-day window. The x-axis indicates the last day of the time window.
3.4. The mutation G29540A
We illustrate the high degree of adaptability this virus possesses by highlighting the noncoding mutation G29540A, occurring within the segment between the coding gene of the N protein and the ORF10 gene (Ryder, 2020). This noncoding segment is 24 nts long and is believed to regulate viral ncRNA production (Kim et al., 2020). Although this mutation does not yet dominate the viral population, this viral strain is mostly localized within NY with >
4. Discussion
Our analysis provides evidence that studying geospatially resolved SARS-CoV-2 populations allows one to assess how sociobehavioral patterns affect the virus, that is, to what extent social distancing measures represent an effective tool to combat the pandemic.
The evolution of SARS-CoV-2 populations shows that although maintaining a high degree of genetic robustness the virus is nevertheless highly adaptable, in both coding and noncoding regions.
We illustrated the existence of complex interactions of mutations and provided an instance of mutations emerging in viral noncoding segments, all of which pose challenging problems for an analysis of what governs viral evolution. We believe that many more mutational signals within the viral population will be identified once adequate analysis tools are put in place. The identification of these signals will be instrumental in understanding how SARS-CoV-2 evolves.
Unfortunately, data on the SARS-CoV-2 genomic populations and sociobehavioral patterns are too sparse and potentially biased to allow for definitive conclusions. However, given the available data, the distinct evolutionary patterns exhibited across different geographical locations and timescales, suggest the existence of macro–micro feedback loops within the dynamics of the COVID-19 pandemic. Differences in environment provide distinctive selection pressures, leading to mutations that form nonlinear interaction networks in the viral population.
Macroscale parameters of the COVID-19 pandemic, such as number of infections, deaths, and human encounters, are closely monitored by researchers and policy makers alike and are naturally representable by means of time series. This representation equally applies to the mutational composition of viral populations. Accordingly, any feedback loops manifest as relational patterns between two such time series.
Such patterns are not a result of instantaneous interaction, since there is a time delay between infection and viral genome collection. Additional difficulty arises from the fact that for each infection-collection event pair, the time delay actually varies. As a result, the relational patterns are not one to one. The mutational composition of the viral population in a single day is affected by the sociobehavioral dynamics of multiple previous days. In light of this, standard correlation methods might not be adequate in identifying such patterns. By construction, the two time series exhibit nonlinearity, a feature that is difficult to address through conventional correlation methods.
Our TE analysis suggests that the viral population of CA and NY is causally linked to their respective state policies that in turn govern social contact and workplace mobility. The TE analysis produces significant p-values; however, we remark that the quality of the analysis is affected by sparseness of data, sampling biases, and by the assumption that the underlying processes are Markov like. In particular, the number of collected sequences is relatively low while the collection time interval (January 2020–May 2020) is short. Such deficiencies have been shown to render statistical inferences, as for instance the identification of phylogenetic networks, unreliable (Mavian et al., 2020). The fact that the number of sequences restricted to a specific geographical location is limited, necessitates a certain aggregation of data over multiple days. Such aggregates have to be carefully designed as they could, at some point, become incompatible with the feedback loops we wish to identify. To better combat the pandemic, extended study on this information theoretic framework is called for. A balance for the temporal and geographical resolutions has to be struck to be able to conduct a meaningful TE analysis.
In upcoming study, we remedy the lack of data on COVID-19 by employing large-scale computer simulations. Synthetic agents, populations, and networks provide a natural data structure that facilitates the forecasting, planning, and intervention modeling in complex social systems. Synthetic populations have been successfully applied in infrastructure modeling, computational epidemiology, and disaster response (Eubank et al., 2004; Parikh et al., 2013; Marathe et al., 2014). By incorporating strain competition in viral infection, the synthetic populations can provide us simulated time series of macrolevel sociobehavioral dynamics and microlevel viral population compositions. This would enable a more comprehensive analysis of the macro–micro feedback loop.
In our analysis, the embedding dimensions of both, the macro- and micro time series, are set to one. This is arguably not optimal for identifying the macro–micro relational pattern, as the mutational composition of the viral population in a single day is affected by the sociobehavioral dynamics of multiple days. In the presence of sufficient data, however, one can apply methods introduced in Ragwitz and Kantz (2002) to determine the optimal embedding dimensions. The TE calculation can then be used to study the time delay between the coupled processes. In fact, the optimal time delay can be estimated using a scanning approach (Wibral et al., 2013).
Our TE analysis focuses on the impact the macrolevel sociobehavioral measures have on the microlevel mutational composition of the viral population. Similar analysis can be conducted to investigate the reverse: the information flow from the microscale to the macroscale. The combination of both analyses allows one to discern the full picture of the complex macro–micro coupling, providing deeper insights and aiding in combating the COVID-19 pandemic.
Footnotes
Acknowledgments
We gratefully acknowledge the discussions with Stephen Eubank, Henning Mortveit, Ricky Chen, and Neelav Dutta.
Author Disclosure Statement
The authors declare they have no conflicting financial interests.
Funding Information
The authors received no financial support for the research, authorship, and/or publication of this article.
References
Supplementary Material
Please find the following supplemental material available below.
For Open Access articles published under a Creative Commons License, all supplemental material carries the same license as the article it is associated with.
For non-Open Access articles published, all supplemental material carries a non-exclusive license, and permission requests for re-use of supplemental material or any part of supplemental material shall be sent directly to the copyright owner as specified in the copyright notice associated with the article.