
Abstract
Accurate predictions of protein structure properties, for example, secondary structure and solvent accessibility, are essential in analyzing the structure and function of a protein. Position-specific scoring matrix (PSSM) features are widely used in the structure property prediction. However, some proteins may have low-quality PSSM features due to insufficient homologous sequences, leading to limited prediction accuracy. To address this limitation, we propose an enhancing scheme for PSSM features. We introduce the “Bagging MSA” (multiple sequence alignment) method to calculate PSSM features used to train our model, adopt a convolutional network to capture local context features and bidirectional long short-term memory for long-term dependencies, and integrate them under an unsupervised framework. Structure property prediction models are then built upon such enhanced PSSM features for more accurate predictions. Moreover, we develop two frameworks to evaluate the effectiveness of the enhanced PSSM features, which also bring proposed method into real-world scenarios. Empirical evaluation of CB513, CASP11, and CASP12 data sets indicates that our unsupervised enhancing scheme indeed generates more informative PSSM features for structure property prediction.
1. Introduction
The function of a protein is closely related to its structure, which is largely determined by its amino acid sequence. However, predicting the structure of a protein solely based on its amino acid sequence is still challenging. An alternative strategy is to start with predicting the structure properties, including secondary structure, backbone dihedral angles, and solvent accessibility (Heffernan et al., 2015). Those predictions are then combined together to help predict the protein structure.
Position-specific scoring matrix (PSSM) features (Stormo et al., 1982) are commonly used in the structure property prediction (Jones, 1999; Gao et al., 2018), which reveals the per-residue evolution patterns in the sequence profile. The quality of PSSM features is primarily determined by the underlying multiple sequence alignments (MSAs) (Wang and Jiang, 1994). MSA is obtained by searching the query amino acid sequence through a large-scale sequence database, for example, UniClust (Mirdita et al., 2016) and UniRef (Suzek et al., 2007). The quality of the MSA for the target protein can be evaluated by counting the number of homologous proteins, or the nonredundant sequence homologs (Meff) (Morcos et al., 2011) retrieved from the database. However, for those proteins with a limited number of high-quality homologous sequences, the prediction quality is often not satisfying due to deficient informative PSSM features (Wang and Xu, 2013).
Existing methods mainly attempt to tackle these problems from two aspects: (1) explore more accurate and efficient MSA search algorithms, for example, hhblits (Remmert et al., 2012), SABERTOOTH (Teichert et al., 2010), Jackhmmer (Wheeler and Eddy, 2013), and HBLAST (O'Driscoll et al., 2015). These algorithms have achieved certain improvements by finding more accurate homologous protein sequences in the database, as well as speeding up the homologous searching process. However, if the database indeed does not contain enough homologous protein sequences for the target protein, the MSA obtained from the database is still insufficient. Therefore, PSSM features of those proteins are still of low quality; (2) improving PSSM features' quality with MSA fixed. To deal with the proteins with a limited number of nonredundant MSA, EnhancedPSSM (Chang et al., 2008) merges similar residues into groups based on some selected physicochemical properties and then generates novel PSSM features based on the group likelihood. In such a manner, the prediction of protein accessible surface area (ASA) can be improved. However, such design requires years of expensive expertise experience and lacks universality as it can only be applied to ASA prediction.
In this article, we propose an unsupervised deep learning method for enhancing the low-quality PSSM features of proteins. Specifically, we randomly sample the MSA of each protein in a certain proportion in each learning iteration during the training of our model, which we call “Bagging MSA.” Then, we use the “Weak PSSMs” calculated by these bags and the “Original PSSM” calculated by all MSA to train our network. This way, our network can learn how to generate high-quality PSSM from a protein with low-quality PSSM features.
Furthermore, we develop two frameworks to evaluate the effectiveness of the generated high-quality PSSM features, as well as utilizing the enhanced PSSM features in real-world applications: (1) Plug-and-go framework, which is used for trained prediction model and closed source software; (2) semi-supervised learning framework, which is ideal for any known or open source prediction network.
The commonly predicted one-dimensional structural properties of a protein are the secondary structure and solvent accessibility (ASA). Therefore, we use two widely used deep learning techniques in the protein secondary structure and ASA prediction area to evaluate our method on different prediction networks, which are convolutional neural network (CNN) and bidirectional long short-term memory (bi-LSTM) models (Sønderby and Winther, 2014; Wang et al., 2016; Heffernan et al., 2017; Klausen et al., 2019). The knowledge of the secondary structure and ASA of proteins as well as the validation network of our method are described in Sections 2 and 3.
The technical contributions of this article can be summarized in four aspects: (1) Our method is the first attempt to target the low-quality PSSMs problem of proteins by developing an enhancing model. According to the experimental results, our method significantly improves the prediction performance of the secondary structure and solvent accessibility tasks for those proteins with low-quality PSSM. (2) In the unsupervised module, our method randomly samples 10%–20% MSA in each training iteration to calculate PSSM features as the input data and uses the original PSSM features as unsupervised labels. This approach not only increases the diversity of the data but also makes the network more flexible to learn different PSSM quality differences so as to give full play to unsupervised learning. (3) Our method is universal since it is capable for any prediction models that take PSSM as the input, which are not limited to secondary structure and solvent accessibility prediction tasks. (4) The unsupervised part of our method is independent; thus, the output can be used directly as the input for the inference phase of any prediction networks, which is more flexible and efficient.
The rest of the article is organized as follows. Several related works about our method and two protein prediction tasks are listed in Section 2. The pipeline of our method is introduced in detail in Section 3. The extensive experiments to demonstrate the advantage of our method and the results analysis are shown in Section 4. Finally, the conclusion and future work are discussed in Section 5.
2. Related Work
In this section, we introduce several related works. First, we present the calculation method and quality criteria of PSSM, for example, transformation method from MSA to PSSM, Count score, and Meff score. Second, we introduce the background of protein secondary structure and relative solvent accessibility (RSA) prediction. Last, we briefly describe our cornerstone deep learning method, for example, unsupervised learning and semi-supervised learning, with its related work in language translation and bioinformatics area.
2.1. Position-specific scoring matrix
2.1.1. Multiple sequence alignment
An MSA is a sequence alignment of multiple homologous protein sequences for the target protein (Wang and Jiang, 1994). Figure 1 presents an example of MSA. MSA is an important step in comparative analyses and property predicting of biological sequences since a lot of information, for example, evolution and coevolution clusters, are displayed on the MSA and can be mapped to the target sequence of choice or on the protein structure (Oteri et al., 2017). Almost all existing approaches to studying proteins utilize MSAs indirectly, that is, they convert MSAs into a PSSM that represents the distribution of amino acid types on each column (Ju et al., 2019).
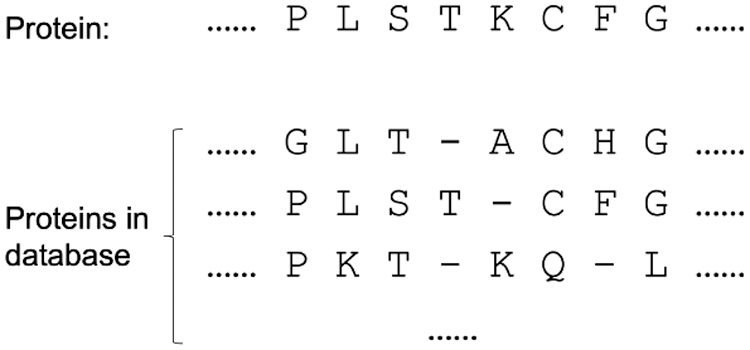
An example of MSA: the protein sequence in the first line is the target protein that we need to search for homologous proteins in the protein database. The number/quality of MSA depends on the number/quality of eligible homologous proteins found in the database. MSA, multiple sequence alignment.
2.1.2. PSSMs calculation
PSSM scores are generally expressed as positive or negative integers. A positive score indicates that the frequency of substitutions in a given amino acid sequence is higher than expected, whereas a negative score indicates that the frequency of substitutions is lower than expected (Altschul et al., 1997; Ye et al., 2011).
We extract the PSSM features of size
2.2. Scoring criteria for PSSM
2.2.1. Count score
The number of sequence homologs is recorded as the Count score. As we mentioned before, PSSM is a matrix calculated from the MSA, and the quality of the MSA directly determines the quality of the PSSM. We can use the number of homologous proteins of the MSA to evaluate the quality of the PSSM, which is represented as Count score. The larger Count score leads to more reliable PSSM. Thus, the Count score is one important criterion to evaluate the quality of the PSSM features.
2.2.2. Meff score
We introduce the Meff score as the number of nonredundant sequence homologs. As in the study of Wang and Xu (2013), homologous sequence in MSA of proteins has some redundancy, so we use Meff score as another criterion for PSSM to demonstrate the superiority and stability of our model under various evaluation standards.
The calculation formula of Meff score is shown in Equation (3), where both i and j go over all the sequence homologs,
2.3. Protein secondary structure prediction
The sequence space of proteins is vast, with perhaps 20 residues at each position, and evolution has been sampling it over billions of years. One of the most important subproblems in protein studies is the secondary structure prediction. Protein secondary structure refers to the local conformation of the polypeptide backbone of proteins. There are two regular secondary structure (SS) states: alpha helix (H) and beta strand (E), and one irregular SS type: coil region (C) (Pauling et al., 1951). The other way is using DSSP software (Kabsch and Sander, 1983) to classify SS into eight fine-grained states. In particular, the algorithm assigns three types for helix (G, H, and I), two types for strand (E and B), and three types for coil (T, S, and L). Overall, many computational methods have been developed to predict both three-state secondary structure and a few to predict eight-state secondary structure. Meanwhile, since a chain of eight-state secondary structures contains more precise structural information for a variety of applications (Wang et al., 2010; Zhou and Troyanskaya, 2014), the focus of secondary structure prediction has been shifted from three-state secondary structure (Q3) prediction to the prediction of eight-state secondary structures (Q8). Because the Q8 problem is much more complicated than the Q3 problem, deep learning methods would be more suitable for addressing the Q8 problem.
2.4. RSA prediction
The solvent accessibility (ASA) is defined as the surface region of a residue that is accessible to a rounded solvent while probing the surface of that residue. The RSA is the extent of ASA of a given residue and is related to the residue spatial arrangement and packing (Lee and Richards, 1971). Based on the RSA value, the prediction is a three-state classification task where each input amino acid xi is mapped to a label
2.5. Unsupervised and semi-supervised learning
The unsupervised learning method is well known for its good performance on sequence-based tasks. It does not require explicit human guides and also brings in the flexibility (Pagliardini et al., 2017; Xu et al., 2017). Semi-supervised learning is a machine learning method that combines labeled data with substantial unlabeled data during the training, which is widely used in various fields (Pagliardini et al., 2017). Pretraining followed by fine-tuning networks is one of the most effective frameworks for semi-supervised learning (Song et al., 2019). For example, SMILES-BERT (Wang et al., 2019) significantly improved the performance of drug compounds in the molecular property prediction task by employing the semi-supervised learning and (Fergus et al., 2009) has made an important contribution to image classification.
3. Method
In this section, we describe the details of our enhancing PSSM model. First, we give a brief introduction to the inference pipeline of our method. Second, we propose an unsupervised learning network composed of modules: Bagging MSA module, local contexts feature encoding module, long-distance interdependencies feature encoding module, and generation module. Then, we introduce two different prediction networks to evaluate our method to prove the universality of our method. Finally, we propose two frameworks to apply our model into different training scenarios.
3.1. Overview
Our method contains two stages: enhancing PSSM and structure–property prediction. The workflow of the inference phase is shown in Figure 2. First, the low-quality PSSM and the protein sequence features are fed into the trained unsupervised model to generate enhanced PSSM features. Next, the enhanced PSSM features with the sequence features are concatenated as the input to be used in the prediction network during the inference phase. Finally, we compare the prediction performance between the enhanced PSSM and the original PSSM for evaluation.
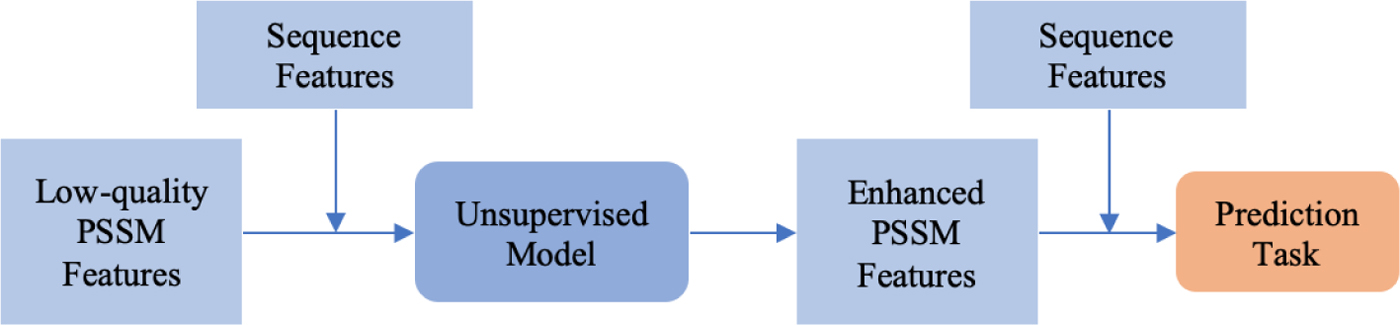
Inference phase overview.
3.2. Unsupervised learning to enhance PSSM
Figure 3 demonstrates the detailed architecture of the proposed unsupervised learning method. It mainly contains four parts: Bagging MSA module, local contexts feature encoding module, long-distance interdependencies feature encoding module, and generation module. For each amino acid in a protein sequence, its input features are concatenated by its PSSM features and sequence features, which form a 2l (l = 21) dimensional vector. The size of the entire input features is denoted as
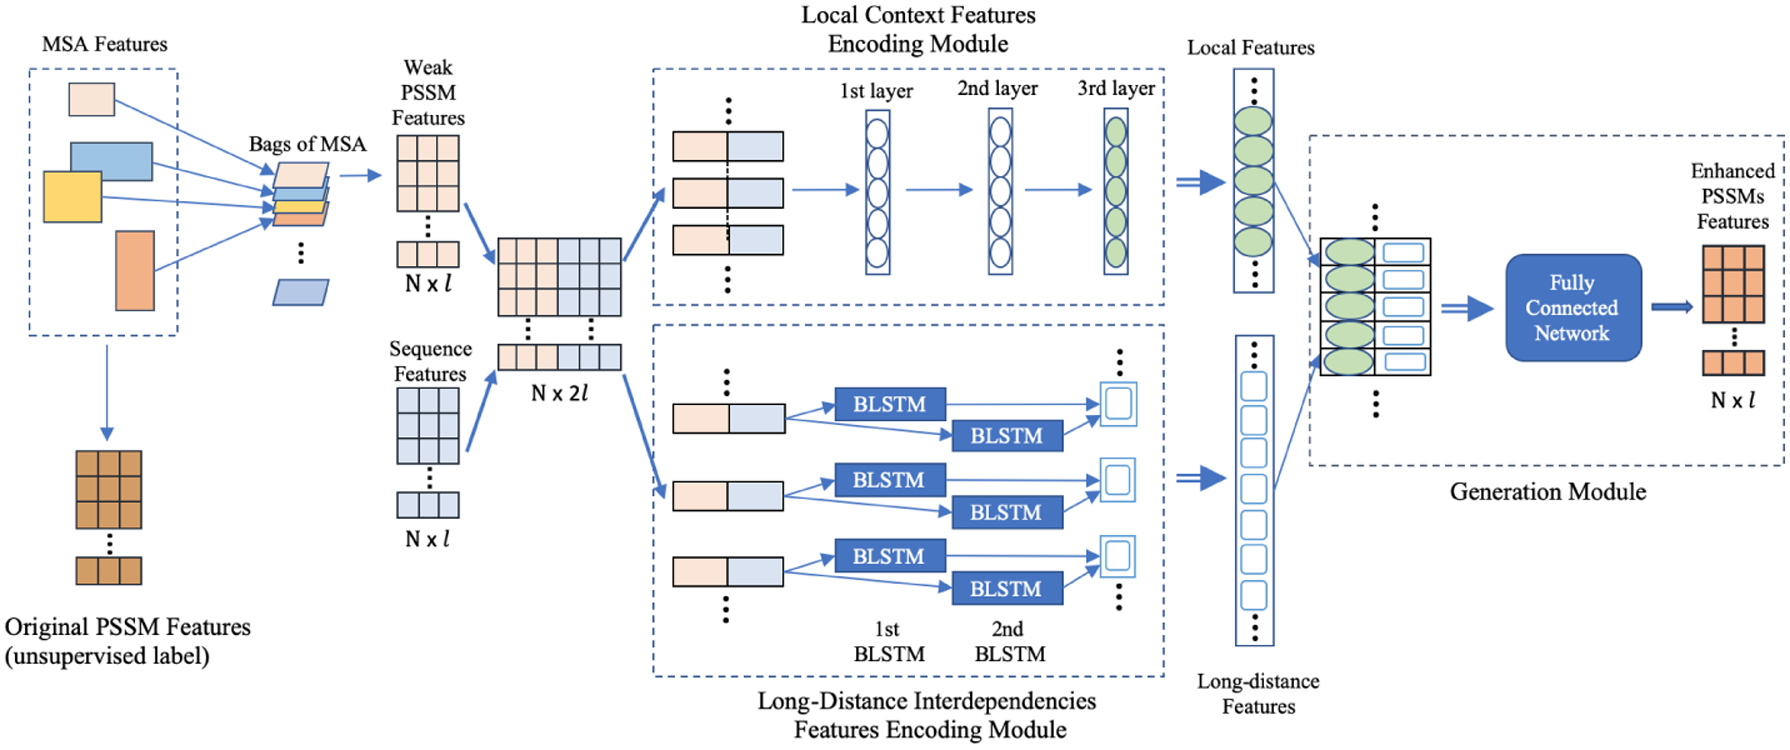
Unsupervised learning model. (1) Bagging MSA module has two outputs: “Original PSSM” calculated by all MSA are used as the unsupervised labels; “Weak PSSM” calculated via the bags of MSA are fed into the two encoding networks. (2) The outputs of the two encoding networks are local features and long-distance features, respectively. (3) The output of the generation module is the “Enhanced PSSM,” which is used to calculate the loss from the “Original PSSM” to adjust the networks. PSSM, position-specific scoring matrix.
3.2.1. Bagging MSA
The primary purpose of our enhancing PSSM module is to generate higher quality PSSM features from low-quality PSSM features, which are calculated from MSA with fewer rows (low counting score) or lower quality (low Meff score). Here, we introduce the concept of “Bagging MSA”: As shown in Figure 3, we randomly sample a small part of MSA for each protein and repeat this operation in each training iteration. A hyperparameter R is introduced to determine the proportion of the randomly selected homologous proteins in MSA per training iteration, for example, when R = [10%, 20%]. Specifically, we randomly select a number greater than 10% and less than 20% for each batch, and then, the homologous proteins in MSA are randomly sampled according to this proportion. In this way, we are able to obtain many MSA bags, and each MSA bag will calculate the so-called “Weak PSSM.” We used the weak PSSM calculated by these bags as a part of the unsupervised input data, and the original PSSM is calculated by the complete MSA as the unsupervised labels. This module is ideal for unsupervised learning since the size of the PSSM matrix is always the same for the same protein, even though the MSA size of each bag and label is different.
3.2.2. Local contexts feature encoding module
We introduce a fully convolutional model as the local contexts feature encoding module. CNN has recently obtained significant success in the seq2seq model (Gehring et al., 2017) and machine translation (Gehring et al., 2016). It is a one-dimensional convolution operation that is usually used for processing sequence data, for example, sequence structure prediction and emotional analysis (Dos Santos and Gatti, 2014; Wang et al., 2016). Several protein studies have also utilized the power of CNN and have achieved remarkable successes too (Wang et al., 2010; Zhou et al., 2018). Therefore, CNN would be a good fit for our prediction task.
In our method, the local contexts feature encoding module extracts the local hidden patterns and features of adjacent amino acid residues from the input matrix by applying the one-dimensional convolution. It contains three 1D convolutional layers along with the Rectified Linear Unit (ReLU) activation function, and the window size is three for each layer, as described in Appendix A1 section.
3.2.3. Long-distance interdependencies feature encoding module
As we have mentioned before, CNN is able to capture the local relationships of the spatial or temporal structures. However, simply increase the window size and network depth to infinity to capture sufficient long-range sequence information is not practical. While long-distance interdependencies (Heffernan et al., 2017) of amino acid residues are also critical for amino acid sequence information, we still need to utilize such features. Inspired by the success of certain methods that use a combination of multiple neural networks, for example, coupling residual two-dimensional bi-LSTM with convolutional neural networks (Hanson et al., 2018), CRRNNs (Zhang et al., 2018), and ACLSTM (Guo et al., 2019), our method uses another network to catch long-distance interdependencies feature other than the convolutional neural network with a few layers.
The RNN-based model has achieved remarkable performance in sequence modeling, but for a long sequence, the gradient vector may grow or degrade exponentially during the training process. LSTM neural networks are designed with a gate structure to avoid such a problem, which is good for capturing long-range relations (from the first atom to the last).
In our method, the long-distance interdependencies feature encoding module includes two stacked bi-LSTM neural networks. As shown in Appendix A1 section, the input data are fed into the feature encoding model by its original order as well as the reverse order, and then, the two outputs are concatenated together to form the final features representation.
3.2.4. Generation module
The purpose of our generating module was to generate PSSM that can be used directly by the prediction tasks. To get the complete information of protein sequence, as shown in Figure 3, we directly concatenate the outputs of the previous two modules and feed them into the one fully connected (FC) hidden layer with the ReLU activation function to generate the enhanced PSSMs. We use the MSE loss (Allen, 1971) to adjust our unsupervised network, as shown in Equation (4).

where
3.3. Prediction network
Since our unsupervised learning method is an independent enhancing PSSM network, any deep learning network can be used as the prediction module to verify the generalization of our method. Here, we utilize two protein structure/property prediction networks to evaluate our method: CNN-based network and LSTM-based network, which are two widely used in such areas. For the CNN-based prediction model, we use five CNN layers (Wang et al., 2016). Since the average length of an alpha helix is around 11 residues (Andersen et al., 2001) and that of a beta strand is around 6 (Penel et al., 2003), we fix the window size to 11. For the LSTM-based networks, we apply two stacked bidirectional LSTM neural networks (Sønderby and Winther, 2014) and a FC layer.
The input data for the prediction network are the same as the input for the unsupervised learning model, which is the concatenation of sequence information and PSSM features calculated by the complete MSA of the protein. The protein secondary structure or RSA is used as the label. Following the protein supervised structure property prediction tasks (Sønderby and Winther, 2014; Wang et al., 2016; Heffernan et al., 2017; Klausen et al., 2019), we denote
3.4. Learning strategies
3.4.1. Plug-and-go framework
To solve the problem that predictive networks or software are not open source, we propose a plug-and-play framework to apply our unsupervised PSSM enhancement model. We first train an unsupervised model to get the enhanced PSSM features. Then, the enhanced PSSM features are fed into a prediction network, which is trained by the original PSSM features. In this manner, we are able to directly observe the different prediction performances between utilizing enhanced PSSM features and original PSSM features. In other words, the high-quality PSSM features can simply replace the original PSSM features in any trained prediction network or closed source software to improve the prediction performance. Even if the prediction network is open source, our framework is efficient because we do not need to retrain the prediction model. We use two prediction tasks to valid the flexible and efficient of our plug-and-go framework, which are protein secondary structure and RSA prediction tasks. As we mentioned above, the trained models we used are the CNN-based and LSTM-based prediction models.
3.4.2. Semi-supervised framework
The enhanced PSSM is directly input into the inference phase of the trained prediction model in our plug-and-go framework; thus, the prediction network does not participate in the training of the enhancing PSSM network. Such implement makes the enhancing PSSM network unable to generate enhanced PSSM features for open-sourced prediction networks.
We develop a semi-supervised framework to improve the performance for specific prediction tasks. As shown in Figure 4, our semi-supervised framework contains a pretraining process and a fine-tuning process. Same as the plug-and-go framework, we pretrain the PSSM enhancing network in an unsupervised manner to generate high-quality PSSM features. After pretraining on the unlabeled low-quality PSSM data, the model has a nontrivial initialization. Then, we fine-tune the enhancing network with supervised labels of proteins, which means we embed our unsupervised network in front of the prediction network during the fine-tuning process. As we mentioned above, we use the CNN-based network or LSTM-based network as the downstream prediction networks. Different from the plug-and-go framework, we use supervised labels to fine-tune the unsupervised model. We follow the same training hyperparameters, for example, learning rate (LR) and optimizer, as the prediction task in the plug-and-go framework. In this manner, when the structure of the prediction network is known, or the prediction software is open source, we can exploit the supervised signal to further boost optimal inference performance for any prediction task.
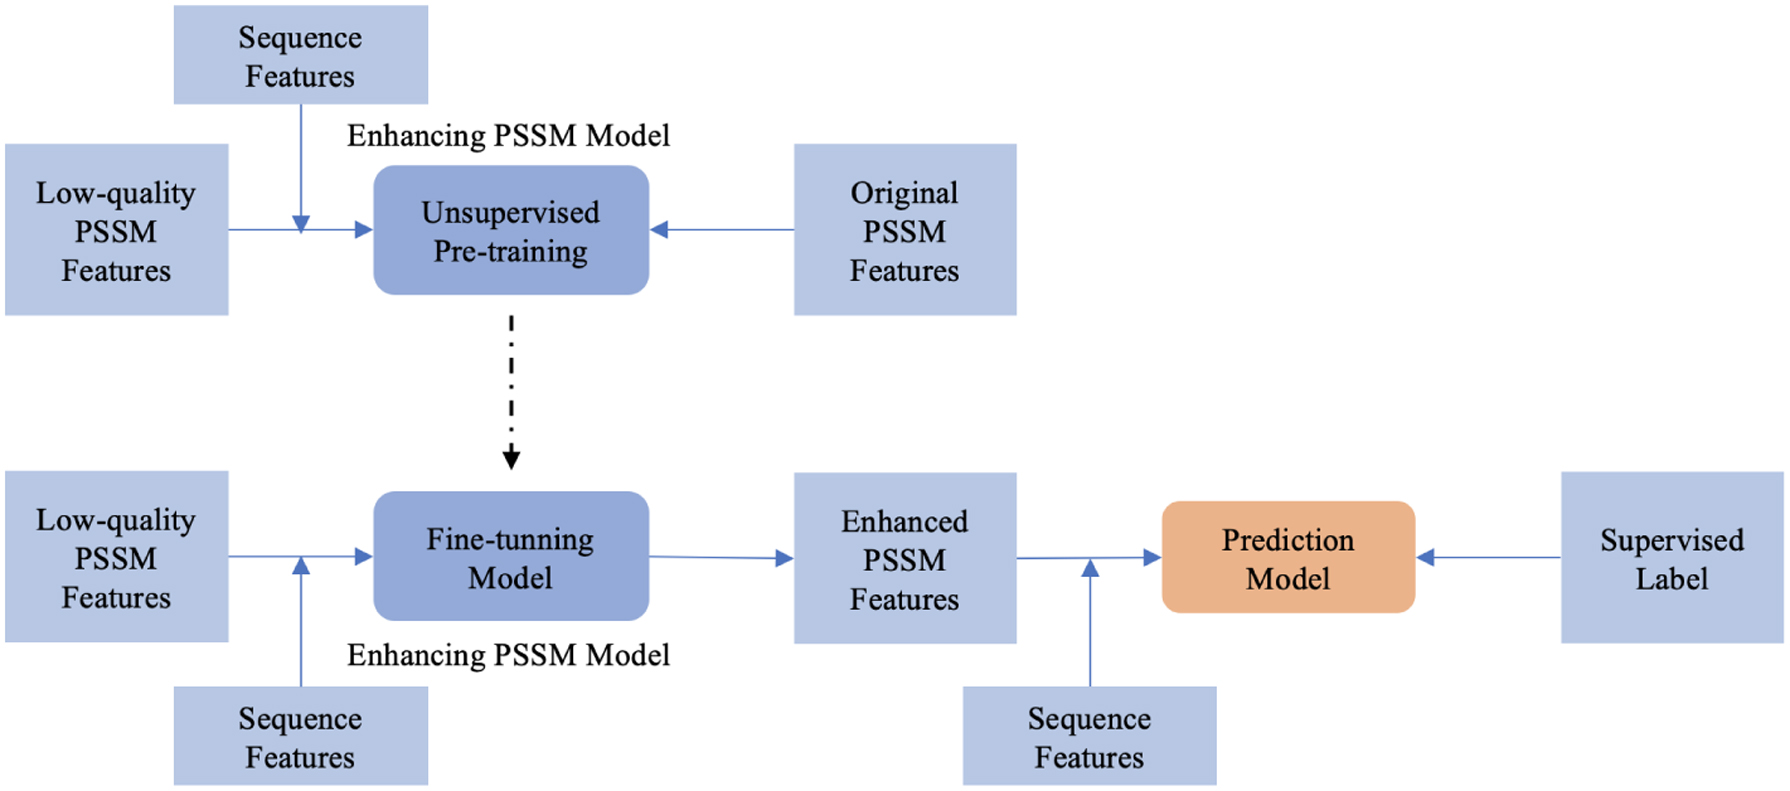
Our semi-supervised framework contains a pretraining process and a fine-tuning process. During the unsupervised pretraining stage, we use the low-quality PSSM generated by our bagging MSA method and sequence (one-hot feature) as the input features and the original PSSM as the unsupervised label. For the fine-tuning process, we embed the enhancing PSSM model in front of the prediction model. We use eight-state secondary structure or three-state RSA as the supervised label. The supervised loss is back-propagate and tune the entire network, which contains both enhancing PSSM model and prediction network. RSA, relative solvent accessibility.
4. Experiments
In this section, we first introduce the experimental settings, such as the data sets description, neural network structures, and evaluation metric. Second, we report results from this enhancing PSSM method based on our two frameworks and the methods based on the nonenhanced PSSM feature. Finally, we discuss the advantage of each framework we proposed.
4.1. Experiments setup
4.1.1. Data sets
Four publicly available data sets, CullPDB (Wang and Dunbrack, 2003), CB513 (Zhou and Troyanskaya, 2014), CASP11, and CASP12, are used for our model. CullPDB data set is widely used in protein structure prediction (Wang et al., 2016; Drori et al., 2018). We use the CullPDB data set of 5926 proteins for training and validation. Fifty-three duplicated proteins with the other 3 data sets we use for testing are removed from the data set, which means that proteins in the data set share no more than 25% sequence identity with our other data sets for testing (Wang et al., 2016), and 591 proteins are randomly sampled for validation and then the remaining proteins are used for training. CB513 data set is commonly used for testing and comparing the performance of the protein secondary structure prediction methods (Wang et al., 2010, 2016; Guo et al., 2019). The data set contains 513 proteins and is obtained from the study of Zhou and Troyanskaya (2014). As the critical assessment of protein structure prediction since 1994, the CASP data sets have been also widely used in the protein studying community (Fang et al., 2018). The 85 proteins in CASP11 and the 40 proteins in CASP12 are used as our CASP data sets.
The CB513, CASP11, and CASP12 data sets are used as the test data set for secondary structure prediction task. For RSA, we only use CASP11 and CASP12 as the test sets. The reason is that the PDB files of CB513 data set are not released by Zhou and Troyanskaya (2014). Thus, the RSA labels cannot be generated. We generate the PSSM by searching the Uniref50 (Bairoch et al., 2005) database. We obtain the eight-state protein secondary structure labels for CB513 from the study of Zhou and Troyanskaya (2014), and the secondary structure labels used for the other data sets, which are generated by DSSP (Kabsch and Sander, 1983; Touw et al., 2014), and the RSA labels are generated based on the study by Tien et al. (2013).
4.1.2. Input features
The input features for the encoding networks of our method are described in the study of Zhou and Troyanskaya (2014). We extract the MSA from Uniref50 databases using Jackhmmer (Wheeler and Eddy, 2013), and set the parameters refer to their guide (Eddy, 1992), details are listed in Appendix A3 section. For each target protein, we use the up to the first 1000 sequences extracted from the Jackhmmer as the MSA features of the protein. We randomly sample 10%–20% (R = [10%, 20%]) of the MSA for each protein within each learning iteration (Bagging MSA) (Guo et al., 2020), and then, we calculate PSSM using Equations (1) and (2). We transform those PSSMs by the Sigmoid function 1/(1 + exp(−x)), where x is a PSSM entry to map each PSSM value in between 0 and 1. As shown in Figure 3, the input features of the two encoding modules of our unsupervised network (enhancing PSSM model) are a
For the prediction part, there are 42 input features for each residue too, 21 of them are from weighted PSSM features and the others are from sequence feature. We compare the testing results of the enhanced input features with the original input features to evaluate the effectiveness of our unsupervised model.
4.1.3. Neural network structure and training strategy
The framework of our unsupervised learning method is very flexible in the network structure selection.
For the long-distance feature encoding module, we can set different hidden layers and hidden dimensions (with different layers and layer hidden sizes). Moreover, different types of network can be chosen in addition to the bi-LSTM network, such as LSTM (Hochreiter and Schmidhuber, 1997). Due to the space limitation of this article, 2 stacked bi-LSTM with 512 hidden units are used for all experiments. Then, we use 1D-CNN of 3 hidden layers, and 100 neurons for each layer in the local contexts feature encoding module. The window size at each layer is set to 3.
For optimization, we use multi-step LR descent with [30, 100, 200] for epoch indices. The multiplicative factor of LR decay is 0.1. We use Adam (Kingma and Ba, 2014) as the optimizer of our method. The initial LR for unsupervised models is 0.0001.
For each protein structure property prediction task, we have two kinds of networks. For CNN network, we use five 1-dim CNN layers with window size 11 and neurons size 100 for each layer. For LSTM network, we use 2 stacked bi-LSTM with 512 hidden units and 1 FC layer.
4.1.4. Evaluation metric
For the unsupervised learning in the plug-and-go framework and pretraining process in the semi-supervised framework, we calculate the root mean square error (Chai and Draxler, 2014) of the Enhanced PSSM and the Original PSSM in the input feature as the evaluation matrix. Q8 accuracy (secondary structure task) and Q3 accuracy (RSA task) are the criteria of the prediction module in the plug-and-go framework and fine-tuning process in the semi-supervised framework.
4.2. Results
4.2.1. Relationship between PSSM quality and performance
As we mentioned before, we use two methods to score the quality of the protein PSSM, higher score represents better quality. The relationship between the quality of PSSM and the corresponding performance on the secondary structure prediction networks on CB513 data set is shown in Figures 5 and 6. Figure 5 shows the average accuracy obtained by using Count score as the evaluation standard on the prediction network of CNN and LSTM, respectively, and Figure 6 for the Meff score. We can find that proteins with high-quality PSSM perform better than proteins with low-quality PSSM both CNN-based and LSTM-based prediction network, as well as under all evaluations, including Count score or Meff score. Tables 1 and 2 show the data distribution within the ranges Count and Meff scores. Thus, our method aims at improving the prediction performance for those proteins with original low-quality PSSM by enhancing their PSSM features. See the gray-scale images in Appendix A2 section, which show the difference between “before” and “after” PSSM enhancement.

The average accuracy of proteins within Count score ranges.
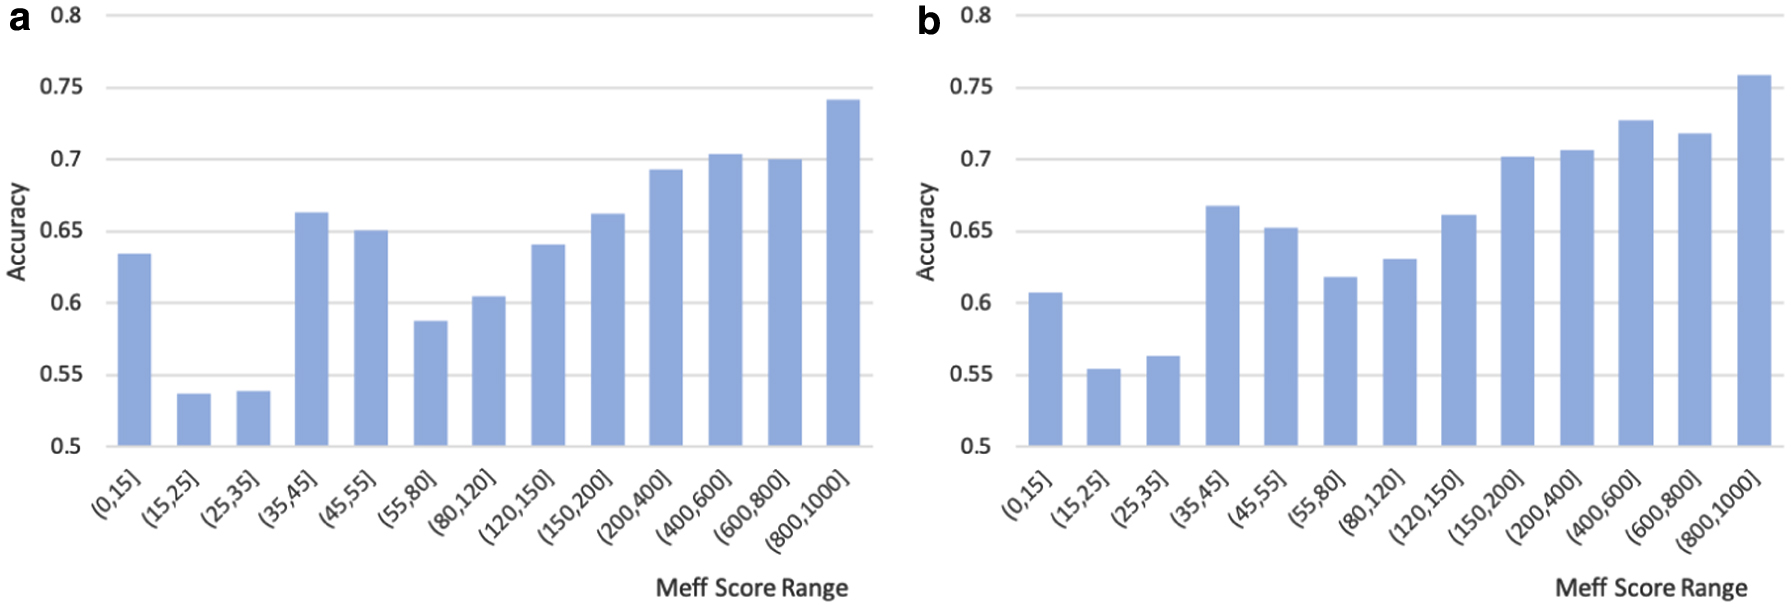
The average accuracy of proteins within Meff score ranges.
Number of Proteins in Certain Count Score Ranges
Number of Proteins in Certain Meff Score Ranges
4.2.2. Enhancement on low-quality PSSM protein
Our method is used to enhance the performance of proteins with low-quality PSSM in secondary structure and RSA prediction task. However, while improving the low-quality PSSM, noise might have been added to the high-quality PSSM, which would end up with a lower accuracy score. Therefore, we need to find a standard to determine the definition of low-quality proteins for our method, which would be the thresholds of the Count score and the Meff score. As shown in Figure 7, our method increase or decrease the accuracy of prediction tasks under certain ranges. Greater than 0 means that the average accuracy of our method has improved under the threshold, whereas less than 0 means that it has decreased. Based on the accuracy results, we are able to find a consistent trend for both CNN-based and LSTM-based models: our method shows significant superiority for proteins with a Count score less than 60 and a Meff score less than 35.
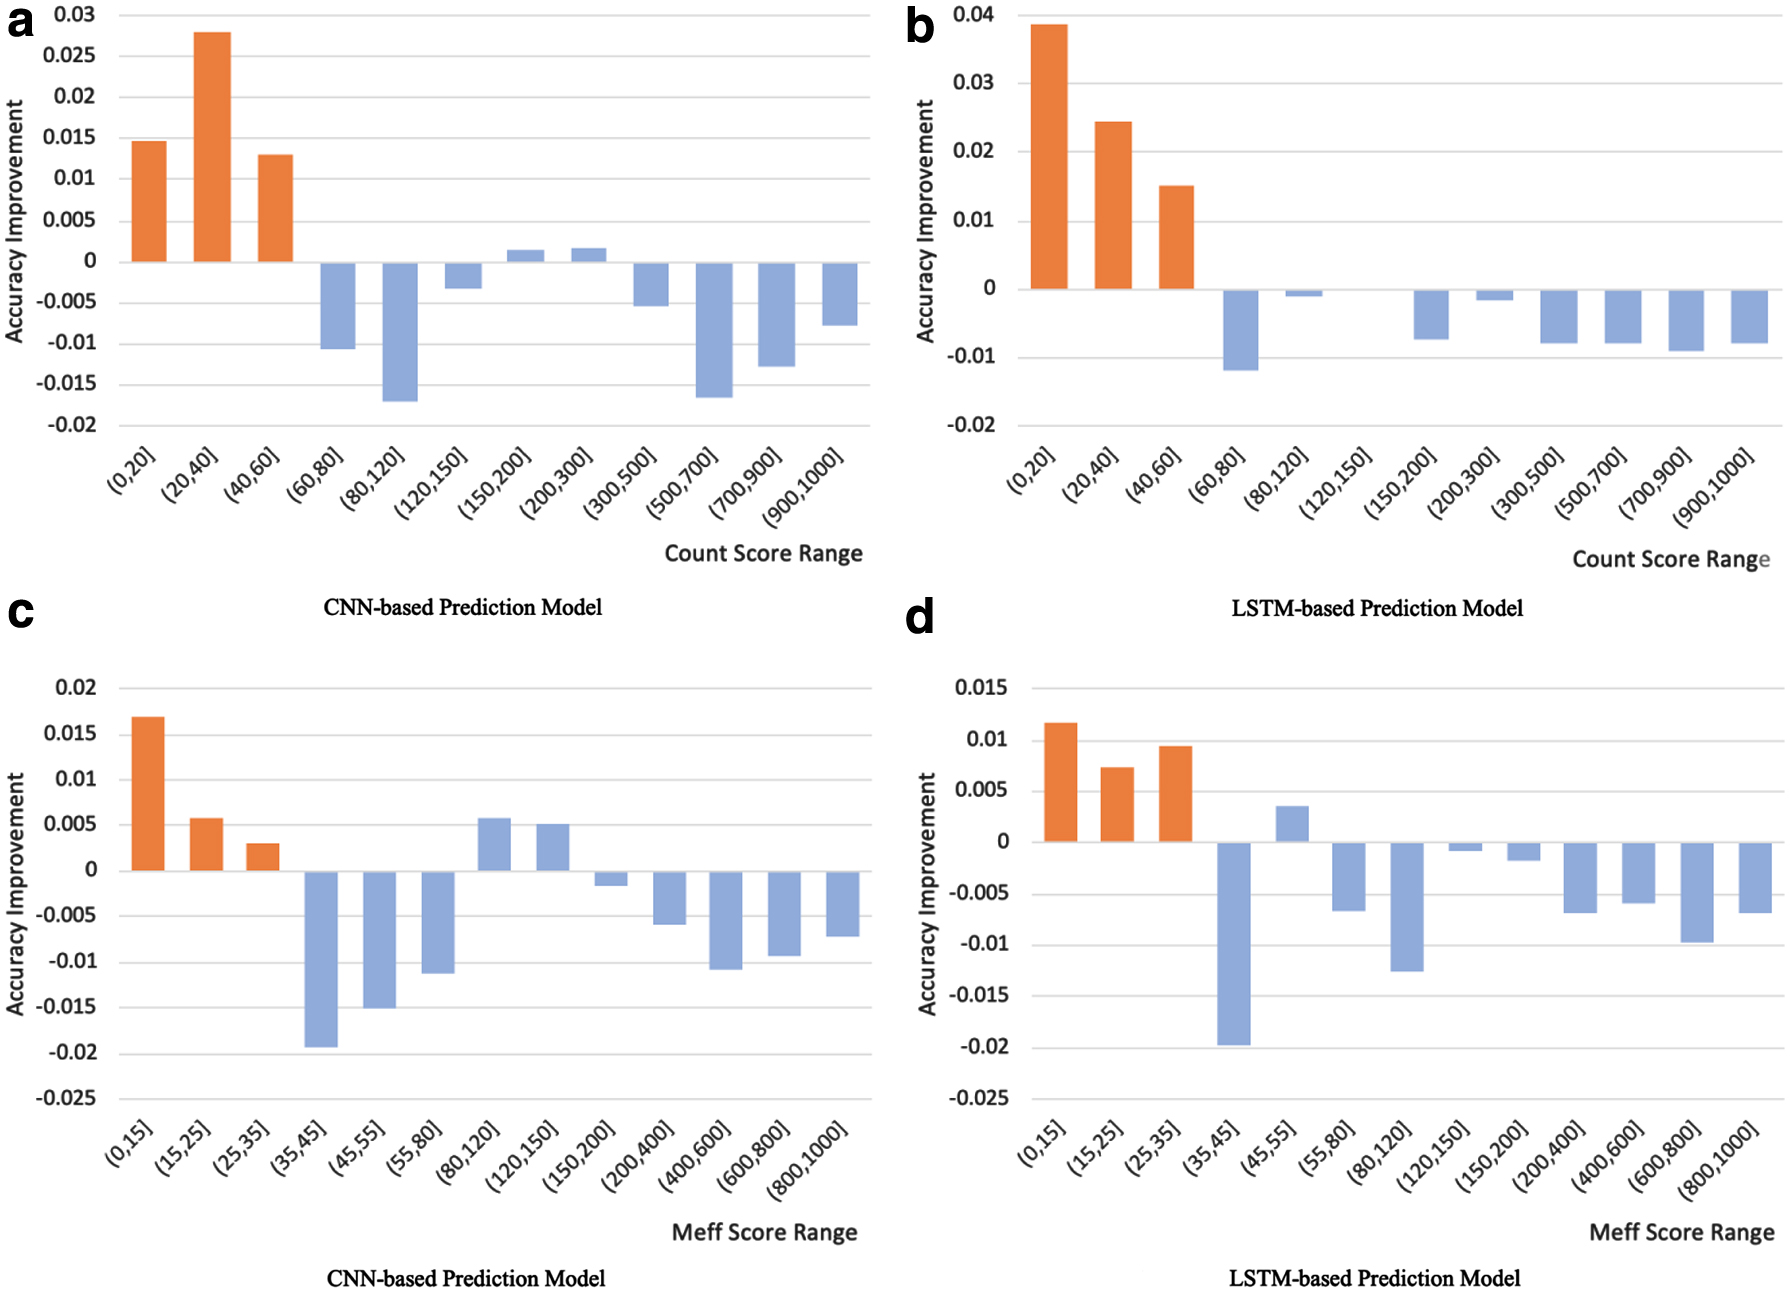
Our method has achieved significant improvement in all prediction tasks (CNN-based and LSTM-based) when the Count score is less than 60
In addition, to verify the threshold we selected is suitable for other data sets and other prediction tasks, we also report the results of CASP11 and CASP12 data sets on both secondary structure and RSA tasks, which are shown in Tables 3 and 4. Pred model represents the type of prediction model we used in the prediction task; score range is the thresholds of the Count score or the Meff score that our method applies to the protein targets. Original PSSM represents the result of nonenhanced PSSM, which is the baseline method; enhanced PSSM contains two sets of results of our method: plug-and-go framework and semi-supervised framework. The last column of the tables shows the number of test proteins that meet this threshold.
Comparison Results (Q8 Accuracy of Secondary Structure Prediction) of Our Enhanced Position-Specific Scoring Matrix and Original Position-Specific Scoring Matrix
The results of Enhanced PSSM contain our plug-and-go and semi-supervised framework. Enhancement experiments are conducted for low-quality proteins (Count score ≤60, Meff score ≤35) obtained from CB513, CASP11, and CASP12 data sets. Prediction experiments are conducted on CNN-based model and LSTM-based model.
CNN, convolutional neural network; LSTM, long short-term memory; PSSM, position-specific scoring matrix.
Comparison Results (Q3 Accuracy of Relative Solvent Accessibility) of Our Enhanced Position-Specific Scoring Matrix and Original Position-Specific Scoring Matrix
The results of Enhanced PSSM contain our plug-and-go and semi-supervised framework. Enhancement experiments are conducted for low-quality proteins (Count score ≤60, Meff score ≤35) obtained from CASP11 and CASP12 data sets. Prediction experiments are conducted on CNN-based model and LSTM-based model.
The performances of extensive experiments demonstrate that both frameworks (plug-and-go and semi-supervised framework) of our method have a significant effect on enhancing low-quality PSSM for different data sets. The results demonstrate that the plug-and-go framework can be used along with trained prediction models or closed source software to improve the prediction performance by directly replacing the original low-quality PSSM features with generated high-quality PSSM features. However, when the structure of the prediction networks or the prediction models is open source, we can connect them with our enhancing PSSM network to fine-tune the enhancing network. As shown in Tables 3 and 4, the semi-supervised framework further boosts the prediction performance when compared with the plug-and-go framework. The supervised information provided by the prediction model can help enforce the enhancing PSSM network to generate more task-specific PSSM features, which further promote the performance of certain downstream prediction tasks.
5. Conclusion
We propose an innovative enhancing model named Bagging MSA, to enhance low-quality PSSM features of proteins, which would help promote their performance in secondary structure and RSA prediction tasks. We employ an unsupervised learning network to enhance the PSSM features and two conventional deep learning prediction models as the protein structure property prediction networks to prove the effectiveness of our method on various data sets and prediction tasks. We develop two frameworks to evaluate the effectiveness of the enhanced PSSM features, which also bring the proposed method into real-world scenarios. Our method is the first attempt to enhance PSSM features in the field of protein research. Moreover, the generalization of our Bagging MSA makes it suitable for numerous PSSM related protein prediction tasks. PSSM features are essential for studying proteins, our method pioneer another way to address the prediction limitation for low-quality proteins.
Footnotes
Author Disclosure Statement
The authors declare they have no conflicting financial interests.
Funding Information
This work was partially supported by U.S. National Science Foundation IIS-1718853, the CAREER grant IIS-1553687, and Cancer Prevention and Research Institute of Texas (CPRIT) award (RP190107).