
Abstract
1. Introduction
Algorithms based on k-mers are now among the top performing tools for many bioinformatics analyses. Instead of working directly with reads or alignments, these tools work with the set of k-mer substrings present in the data, often relying on specialized data structures for representing sets of k-mers (for a survey, see Chikhi et al., 2019). Since modern sequencing datasets are huge, the space used by such data structures is a bottleneck when attempting to scale up to large databases. For example, as part of our group's work on building indices for RNA-seq data, we are storing gzipped k-mer set files from about 2500 experiments (Harris and Medvedev, 2018). Though this is only a fraction of experiments in the SRA, it already consumes 6 TB of space. For these and other applications, the development of space-efficient representations of k-mer sets can improve scalability and enable novel biological discoveries.
Conway and Bromage (2011) showed that at least
A common way to reduce the redundancy in a k-mer set K is to convert it into a set of maximal unitigs. A unitig is a non-branching path in the de Bruijn graph, a graph whose nodes are the k-mers of K and edges are the overlaps between k-mers. A unitig u can be written as a string
The maximal unitigs U can be computed efficiently (Chikhi et al., 2016; Pan et al., 2018; Guo et al., 2019) and combined with an auxiliary index to obtain a membership data structure (i.e., one that can efficiently determine whether a k-mer belongs to K or not). In particular, Unitigs-FM (Chikhi et al., 2014) and deGSM (Guo et al., 2019) use the FM-index as the auxiliary index; Pufferfish (Almodaresi et al., 2018) and BLight (Marchet et al., 2019) use a minimum perfect hash function; and Bifrost (Holley and Melsted, 2019) uses a minimizer hash table. Alternatively, U can be compressed to obtain a compressed disk representation of K, although without efficient support for membership queries before decompression.
Although unitigs conveniently fit the needs of those applications, we observe in this article that they are not necessarily the best that can be done. Concretely, we claim that what makes U useful in these scenarios is that they are a type of spectrum-preserving string set (SPSS) representation of K, which we define to be a set of strings X such that a k-mer is in K if it is a substring of a string in X. [This is in contrast to the way unitigs are used in assembly, where it is crucial that they are not chimeric (Medvedev, 2018)]. The weight of X is the number of characters it contains. In this article, we explore the idea of low-weight representations and their applicability. In particular, are there representations with a smaller weight than U that can be efficiently computed? What is the lowest weight that is achievable by a representation? Can such representations seamlessly replace unitig representations in downstream applications, and can they improve space performance?
In this article, we show that the problem of finding a minimum weight SPSS representation is equivalent to finding the smallest path cover in a compacted de Bruijn graph (Section 3). We use the reduction to give a lower bound on the weight, which could be achieved by any SPSS representation (Section 4), and we give an efficient greedy algorithm UST (
1.1. Related work
The idea of using a SPSS for a membership index was previously independently described in a PhD thesis (Břinda, 2016), and questions similar to the ones in our article are simultaneously and independently studied in Břinda et al. (2020). The idea of greedily gluing unitigs (as UST does) has previously appeared in read compression (Jones et al., 2012), where contigs greedily constructed from the reads and the reads were stored as alignments to these contigs. The idea also appeared in the context of sequence assembly, where a greedy traversal of an assembly graph was used as an intermediate step during assembly (Haas et al., 2013; Kolmogorov et al., 2019).
The compression of k-mer sets has not been extensively studied, except in the context of how k-mer counters store their output (Marçais and Kingsford, 2011; Rizk et al., 2013; Kokot et al., 2017; Pandey et al., 2017c). DSK (Risk et al., 2013) uses an HDF5-based encoding, KMC3 (Kokot et al., 2017) combines a dense storage of prefixes with a sparse storage of suffixes, and Squeakr (Pandey et al., 2017c) uses a counting quotient filter (Pandey et al., 2017a). The compression of read data, on the other hand, stored in either unaligned or aligned formats, has received a lot of attention (Hosseini et al., 2016; Numanagić et al., 2016; Hernaez et al., 2019). In the scenario where the k-mer set to be compressed was originally generated from FASTA files by a k-mer counter, an alternate to k-mer compression is to compress the original FASTA file and use a k-mer counter as part of the decompression to extract the k-mers on the fly. This approach is unsatisfactory because (1) as shown in this article, it takes substantially more space than direct k-mer compression, (2) k-mer counting on the fly adds significant time and memory to the decompression process, and (3) there are applications where the k-mer set cannot be reproduced by simply counting k-mers in a FASTA file, for example, when it is a product of a multi-sample error correction algorithm (Yang et al., 2012).
Further, there are applications where the k-mer set is not related to sequence read data at all, for example, a universal hitting set (Orenstein et al., 2017), a chromosome-specific reference dictionary (Rangavittal et al., 2019), or a winnowed min-hash sketch [e.g., as in Sahlin and Medvedev (2019), or see Marçais et al. (2019) and Rowe (2019) for a survey].
Membership data structures for k-mer sets were surveyed in a recent paper (Chikhi et al., 2019). In addition to the unitig-based approaches already mentioned, other exact representations include succinct de Bruijn graphs (referred to as BOSS; Bowe et al., 2012) and their variations (Boucher et al., 2015; Blazzougui et al., 2016a), dynamic de Bruijn graphs (Belazzougui et al., 2016b; Crawford et al., 2018), and Bloom filter tries (Holley et al., 2016). Some data structures are non-static, that is, they provide the ability to insert and/or delete k-mers. However, such operations are not needed in many read-only applications, where the cost of supporting them can be avoided. Membership data structures can be extended to associate additional information with each k-mer, for instance an abundance count (e.g., deBGR; Pandey et al., 2017b) or a color class (for a short overview, see Chikhi et al., 2019).
2. Definitions
2.1. Strings
In this article, we assume all strings are over the alphabet
2.2. Bidirected graphs
A bidirected graph G is a pair
2.3. Bidirected DNA graphs
A bidirected DNA graph is a bidirected graph G where every vertex u has a string label
2.4. de Bruijn graphs
Let K be a set of canonical k-mers. The node-centric bidirected de Bruijn graph, denoted by
3. Equivalence of SPSS Representations and Path Covers
For this section, we fix K to be a canonical set of k-mers. A set of strings X is said to be a SPSS representation of K if their k-spectrums are equal and each string in X is of length
First, we show that the weight of an SPSS representation is a linear increasing function of its size (i.e., the number of strings it contains) and, hence, finding an SPSS representation of minimum weight is equivalent to finding one of minimum size.
Proof. Every string x of length
The intuition behind Theorem 1 is that there is a natural size-preserving bijection between path covers of
Proof. By construction, all strings in
For the base case,
Proof. Let
Since X has the smallest number of strings, the endpoints of
Now we can prove Theorem 1.
Proof. By Lemma 1,
4. Lower Bound on the Weight of a SPSS Representation
In this section, we will prove a lower bound on the size of a path cover of a bidirected graph, which, by Theorem 1, gives a lower bound on the weight of any SPSS representation. Finding the minimum size of a path cover in general directed graphs is NP-hard, since a directed graph has a Hamiltonian path if and only if it has a path cover of size 1. However, we do not know the complexity of the problem when restricted to compacted de Bruijn graphs of k-mer sets. The minimum size of a path cover is known to be bounded from above by the maximum size of an independent set (at least for directed graphs; Diestel, 2005); however, finding a maximum independent set is itself NP-hard. We, therefore, take a different approach.
For this section, let
We observe that every walk in a path cover must have two unique endpoint-sides. Our strategy is to give a lower bound on the number of endpoint-sides, thereby giving a lower bound on the size of a path cover. We know, for instance, that dead-sides must be endpoint-sides and we also know that the sides of an isolated vertex must be endpoint-sides. For other cases, we cannot predict exactly the endpoint-sides, but we can create disjoint sets of vertex-sides (which we call special neighborhoods) such that, for each set, we can guarantee that all but one of its vertex-sides are endpoint-sides. Formally, for a vertex-side
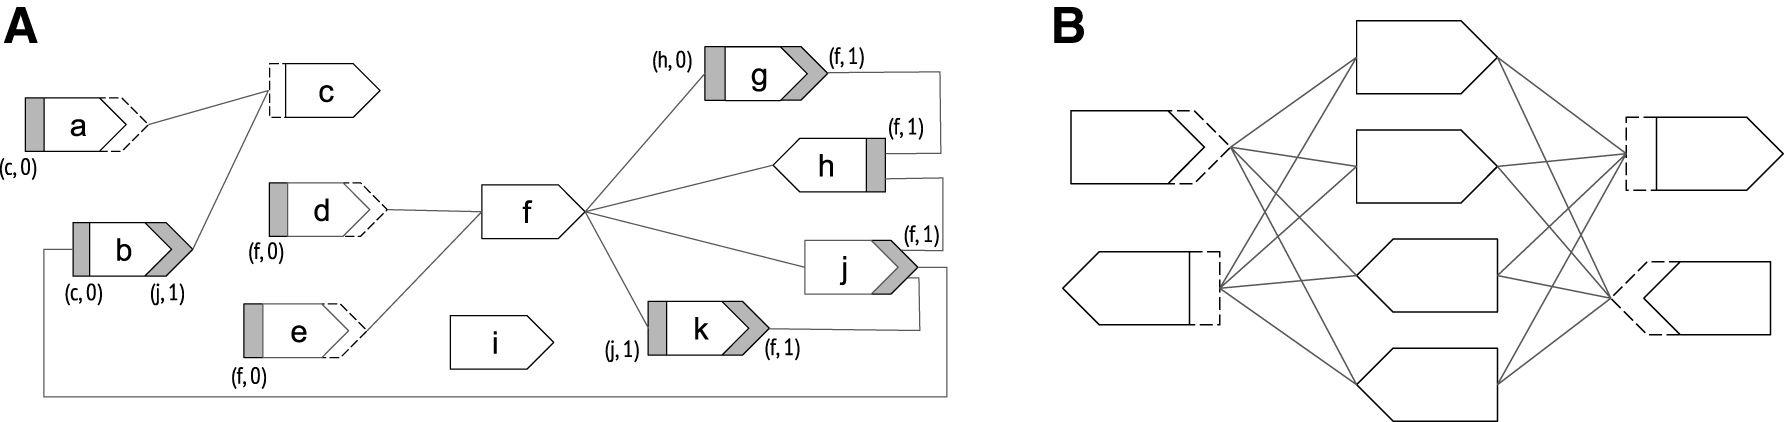
Proof. Assume without loss of generality that |Bu,su| > 1, since the lemma is otherwise vacuous. Let
Next, we show that the special neighborhoods are disjoint, and we can therefore define
Proof. We claim that
Finally, we are ready to prove our lower bound on the size of path cover.
Proof. Define a walk as isolated if it has only one vertex and that vertex is isolated. There are exactly
By applying Theorem 1 to Theorem 2 and observing that loops do not affect path covers, we get a lower bound on the minimum weight of any SPSS representation:
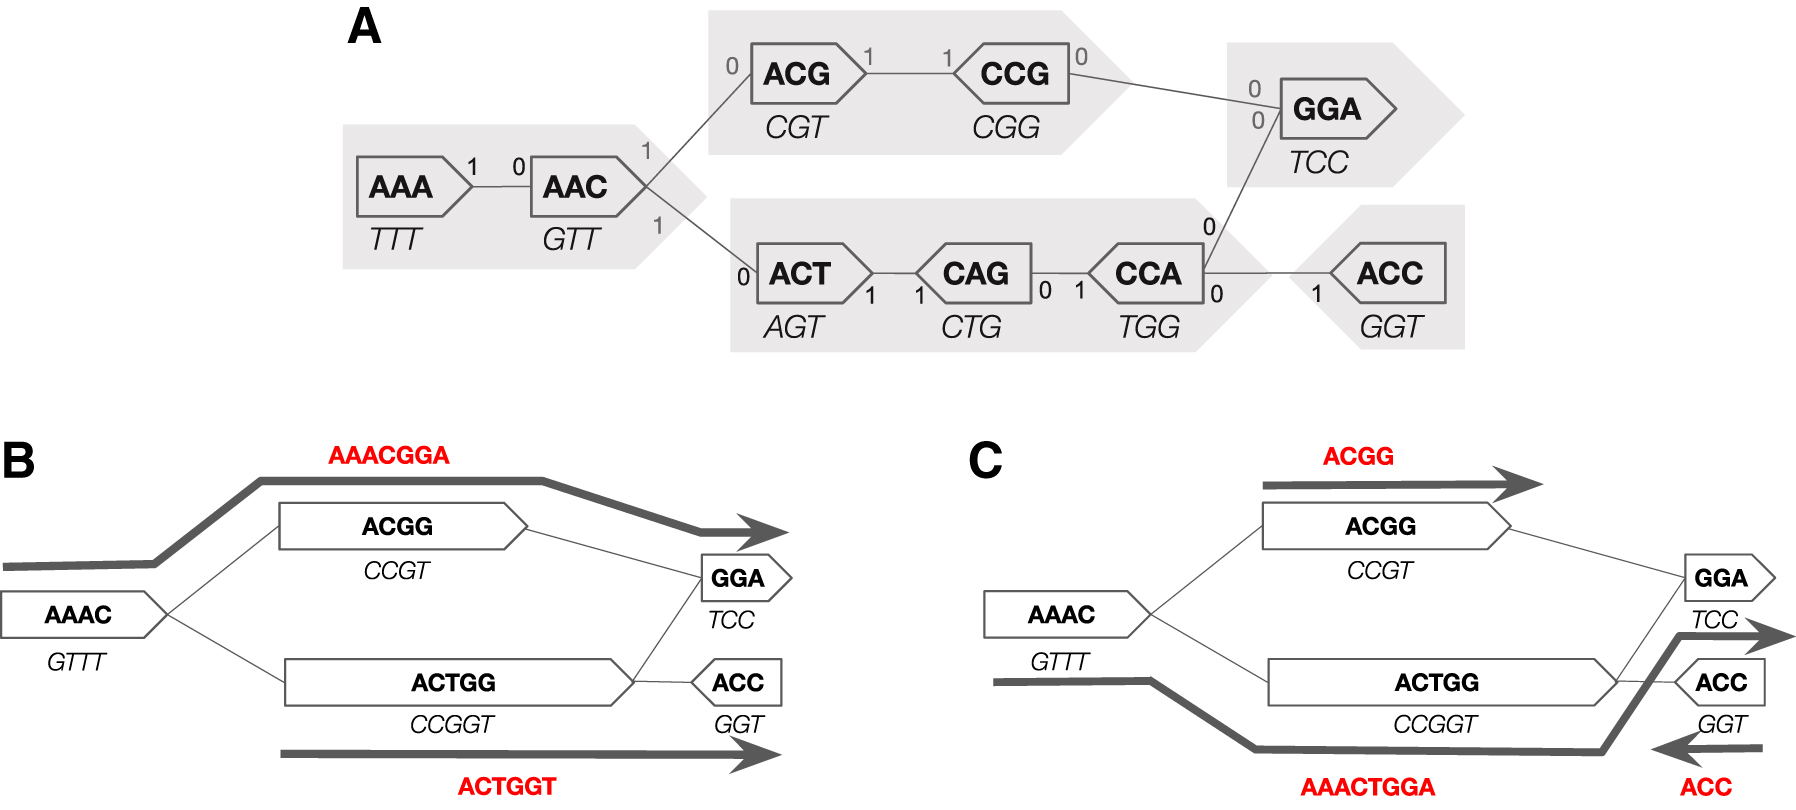
We note that the lower bound is not tight, as in the example of Figure 2B; it can likely be improved by accounting for higher-order relationships in G. However, the empirical gap between our lower bound and algorithm is so small (Section 7) that we did not pursue this direction.
5. The UST Algorithm for Computing a SPSS Representation
In this section, we describe our algorithm called UST for computing an SPSS representation of a set of k-mers K. We first use the Bcalm2 tool (Chikhi et al., 2016) to construct
The UST constructs a path cover W by greedily exploring the vertices, with each vertex explored exactly once. We maintain the invariant that W is a path cover over all the vertices explored up to that point, and that the currently explored vertex is an endpoint of a walk in W. To start, we pick an arbitrary vertex u, add a walk consisting of only u to W, and start an exploration from u.
An exploration from u works as follows. First, we mark u as explored. Let wu be the walk in W that contains u as an endpoint, and let su be the endpoint-side of u in wu. We then search for an edge
In our implementation, we do not store the walks W explicitly but rather just store a walk ID at every vertex along with some associated information. This makes the algorithm run-time and memory linear in the number of vertices and the number of edges, except for the possibility of needing to merge walks (i.e., merging of wu and wv). But we implement these operations by using a union-find data structure, making the total time near-linear.
We note that the UST's path cover depends on the arbitrary choices of which vertex to explore. Figure 1C gives an example of where this leads to suboptimal results. However, our results indicate that UST cannot be significantly improved in practice, at least for the datasets we consider (Section 7).
6. Applications
We apply the UST to solve two problems. First, we use it to construct a compression algorithm UST-Compress. UST-Compress supports only compression and decompression and not membership and is intended to reduce disk space. We take K as input [in the binary output format of either DSK (Risk et al., 2013) or Jellyfish (Marçais and Kingsford, 2011)], run UST on K, and finally compress the resulting SPSS by using a generic nucleotide compressor MFC (Pinho and Prats, 2013). UST-Compress can also be run in a mode that takes as input a count associated with each k-mer. In this mode, it outputs a list of counts in the order of their respective k-mers in the output SPSS representation (this is a trivial modification to UST). This list is then compressed by using the generic LZMA compression algorithm. Note that we use MFC and LZMA due to their superior compression ratios, but other compressors could be substituted. To decompress, we simply run the MFC or LZMA decompressing algorithm.
Second, we use UST to construct an exact static membership data structure UST-FM. Given K, we first run UST on K, and then construct an FM-index (Ferragina and Manzine, 2000) (as implemented in https://github.com/jts/dbgfm) on top of the resulting SPSS representation. The FM-index then supports membership queries. In comparison to hash-based approaches, the FM-index does not support insertion or deletion; on the other hand, it allows membership queries of strings shorter than k.
7. Empirical Results
We use different types of publicly available sequencing data, because each type may result in a de Bruijn graph with different properties and may inherently be more or less compressible. Our datasets include human, bacterial, and fish samples; they also include genomic, metagenomic, and RNA-seq data (Table 1). Each dataset was k-mer counted by using DSK (Risk et al., 2013), using
Dataset Characteristics
Singletons are not included in the k-mer count. Unless otherwise stated,
Versions of the Tools Used in Experiments
Default options were used except as noted in the last column. We show the options for
7.1. Evaluation of the UST representation
We compare our UST representation against the unitig representation as well as against the SPSS lower bound of Corollary 1 (Table 3, with a deeper breakdown in Table 4). The UST reduces the number of nucleotides (i.e., weight) compared to the unitigs by 10%–32%, depending on the dataset. The number of nucleotides obtained is always within 3% of the SPSS lower bound; in fact, when considering the gap between the unitig representation and the lower bound, UST closes 92%–99% of that gap. These results indicate that our greedy algorithm is a nearly optimal SPSS representation, on these datasets. They also indicate that the lower bound of Corollary 1, though not theoretically tight, is nearly tight on the type of real data captured by our experiments.
Comparison of Different String Set Representations and the SPSS Lower Bound
The second column shows
SPSS, spectrum-preserving string set; UST,
Percent of
7.2. Evaluation of UST-compress
We measure the compressed space usage (Table 5), compression time and memory (Table 6), and decompression time and memory. We compare against the following lossless compression strategies: (1) the binary output of the k-mer counters DSK (Risk et al., 2013), KMC (Kokot et al., 2017), and Squeakr-exact (Pandey et al., 2017c); (2) the original FASTA sequences, with headers removed; (3) the maximal unitigs; and (4) the BOSS representation (Bowe et al., 2012) (as implemented in COSMO [https://github.com/cosmo-team/cosmo/tree/VARI]). In all cases, the stored data are additionally compressed by using MFC (for nucleotide sequences, i.e., 2 and 3) or LZMA (for binary data, i.e., 1 and 4). The second strategy (which we already discussed in Section 1.1) is not a k-mer compression strategy per say, but it is how many users store their data in practice. The fourth strategy uses BOSS, the empirically most space efficient exact membership data structure according to a recent comparison (Crawford et al., 2018). We include this comparison to measure the advantage that can be gained by not needing to support membership queries. Note that strategies 1 and 2 retain count information, unlike strategies 3 and 4. Squeakr-exact also has an option to store only the k-mers, without counts.
Space Usage of UST-Compress and Others
We show the average number of bits per distinct k-mer in the dataset. All files are compressed with MFC or LZMA, in addition to the tool shown in the column name. Squeakr-exact's implementation is limited to
Time and Peak Memory Usage of UST-Compress (Without Counts) and Others During Compression
For BOSS and unitigs, the times are separated according to the two steps of compression: running the core algorithm (Cosmo and bcalm2) followed by the generic compressor (respectively, LZMA and MFC). For UST-Compress, the first step is exactly the same as for unitigs (Bcalm2), so the column is not repeated.
First, we observe that compared with the compressed native output of k-mer counters, UST-Compress reduces the space by roughly an order of magnitude; this, however, comes at an expense of compression time. When the value of k is increased, this improvement becomes even higher; as k nearly doubles, the UST-Compress output size remains the same; however, the compressed binary files output by k-mer counters approximately double in size. Our results indicate that when disk space is a more limited resource than compute time, SPSS-based compression can be very beneficial.
Second, we observe a 4–8 × space improvement compared with just compressing the reads FASTA file. In this case, however, the extra time needed for UST compression is balanced by the extra time needed to recount the k-mers from the FASTA file. Therefore, if all that is used downstream are the k-mers and possibly their counts, then SPSS-based compression is again very beneficial. Third, UST-Compress uses between 39% and 48% less space than BOSS, with comparable construction time and memory. Fourth, compared with the other SPSS-based compression (based on maximal unitigs), UST-Compress uses 10% to 29% less space, but it has 10% to 24% slower compression times (with the exception of the
We also compressed a subset of samples from a de-noised index of 450,000 microbial DNA data used recently in large-scale indexing projects of BIGSI (Bradley et al., 2019) and COBS (Bingmann et al., 2019). Each sample consists of error-corrected 31-mers (without abundance information) from a corresponding sequencing experiment, natively stored as bzipped McCortex binary file [see Bingmann et al. (2019) and Bradley et al. (2019) for details]. We downloaded 19,000 of these files from http://ftp.ebi.ac.uk/pub/software/bigsi/nat_biotech_2018/ctx/. We ran UST-Compress, which reduced the disk space from 507 to 14.7 GB, a 35 × reduction. The compression took a total of 82 hours and a peak memory of 3 GB (using one core).
7.3. Evaluation of UST-FM
We measure the memory taken by the data structure (Table 8), the query times (Table 9), and the time and memory taken during construction (Table 7). We compare UST-FM against two other space-efficient exact static membership data structures for k-mer sets. The first builds the FM index on top of the maximal unitigs (we refer to this as unitig-FM, but it is referred to originally as dbgfm in Chikhi et al., 2014). The second is BOSS, which, as previously mentioned, was shown (Crawford et al., 2018) to have superior space usage. We did not compare against the Bloom filter trie (Holley et al., 2016), which is fast but uses an order of magnitude more memory than BOSS (Crawford et al., 2018). Other data structures, such as Pufferfish (Almodaresi et al., 2018), blight (Marchet et al., 2019), and Bifrost (Holley and Melsted, 2019), implement more sophisticated operations and hence use significantly more memory than BOSS. Moreover, these make use of a unitig SPSS representation and hence could potentially themselves incorporate the UST approach.
Time and Memory for Construction of Index by UST-FM and Others
UST-FM Data Structure Size, Shown in the Average Number of Bits per Distinct k-Mer in the Dataset
This was measured by taking the peak memory usage during membership queries.
UST-FM Query Time (in Seconds) for Two Sets of 10,000 k-Mers Each, Using the Human RNA-Seq Indices
The first set contains k-mers drawn from the dataset, so that UST-FM returns a hit. The second set takes randomly generated k-mers that were verified to not be present in the dataset. We measured the query times (per k-mer) after the index was already loaded into memory.
First, the UST-FM index is 25%–44% smaller and the queries are 4 to 11 times faster compared with BOSS; however, it takes 2 to 5 times longer to build. This time is dominated by FM-index construction, rather than by UST. Second, the UST-FM index is 10%–32% smaller than the unitigs-FM index, with a negligibly faster query time. Finally, the memory use during construction was similar for all approaches.
8. Conclusion
In this article, we define the notion of an SPSS representation of a set of k-mers, give a lower bound on what could be achieved by such a representation, and give an algorithm to compute a representation that comes close to the lower bound. We demonstrate the applicability of the SPSS definition by using our algorithm to substantially improve space efficiency of the state of the art in two applications.
A natural question is why we limit ourselves to SPSS representations. One can imagine alternative strategies, such as allowing a k-mer to appear more than once in the string set, or allowing other types of characters. In fact, for any concrete application, one might argue that an SPSS representation is too restrictive and can be improved. However, we chose to focus on SPSS representations because they are the common denominator in the applications of unitig-based representations we have observed (Chikhi et al., 2014; Almodaresi et al., 2018; Holley and Melsted, 2019; Marchet et al., 2019). In this way, they retain broad applicability, as opposed to more specialized representations.
One limitation of the UST is the time and memory needed to run Bcalm2 as a first step. Bcalm2 works by repeatedly gluing k-mers into longer strings, taking care to never glue across a unitig boundary. However, this care is wasted in our case, since the UST then greedily glues across unitig boundaries anyway. Therefore, a potentially significant speedup and memory reduction of UST would be to implement it as a modification of Bcalm2, as opposed to running on top of it. This can keep the high-level algorithm the same but change the implementation to work directly on the k-mer set by incorporating algorithmic aspects of Bcalm2.
Footnotes
Acknowledgment
The authors are grateful to Rayan Chikhi for feedback and help with modifying Bcalm2.
Author Disclosure Statement
The authors declare they have no competing financial interests.
Funding Information
P.M. and A.R. were supported by NSF awards 1453527 and 1439057. A.R. is supported by NIH Computation, Bioinformatics, and Statistics training program.