
Abstract
Essential proteins are a vital part of the survival of organisms and cells. Identification of essential proteins lays a solid foundation for understanding protein functions and discovering drug targets. The traditional biological experiments are expensive and time-consuming. Recently, many computational methods have been proposed. However, some noises in the protein-protein interaction (PPI) networks affect the efficiency of essential protein prediction. It is necessary to construct a credible PPI network by using other useful biological information to reduce the effects of these noises. In this article, we proposed a model, Ess-NEXG, to identify essential proteins, which integrates biological information, including orthologous information, subcellular localization information, RNA-Seq information, and PPI network. In our model, first, we constructed a credible weighted PPI network by using different types of biological information. Second, we extracted the topological features of proteins in the constructed weighted PPI network by using the node2vec technique. Last, we used eXtreme Gradient Boosting (XGBoost) to predict essential proteins by using the topological features of proteins. The extensive results show that our model has better performance than other computational methods.
1. Introduction
Essential proteins are indispensable for the survival of organisms and cells (Winzeler et al., 1999), and the absence of essential proteins leads to organisms exhibiting disability or results in death (Clatworthy et al., 2007). The understanding of essential proteins lays a theoretical foundation for the nosogenesis of complex diseases and the determination of drug targets (Furney et al., 2006). Thus, the identification of essential proteins is necessary and important for biologists. Usually, biologists use traditional biological experiments to identify essential proteins, including single-gene knockout (Giaever et al., 2002), conditional knockout (Cullen and Arndt, 2005), and RNA interference (Roemer et al., 2003). These methods require a lot of work in the laboratory, time, and money. Thus, researchers developed some computational methods to identify essential proteins in recent years.
The most famous rule in the prediction of essential proteins is the Centrality-Lethality rule, which was proposed by Jeong et al. in 2001, and which shows that nodes with high connectivity are more likely to be essential proteins than nodes with low connectivity in the protein-protein interaction (PPI) networks. Based on this rule, many computational methods have been proposed for essential protein prediction. Generally, these computational methods can be divided into three categories: topology-based methods, integrating topological and biological information methods, and machine learning-based methods. There are several representative topology-based methods, such as Local Average Connectivity (LAC) (Li et al., 2011), Closeness Centrality (CC) (Wuchty and Stadler, 2003), Betweenness Centrality (BC) (Joy et al., 2005), Degree Centrality (DC) (Hahn and Kern, 2004), Information Centrality (IC) (Stephenson and Zelen, 1989), Eigenvector Centrality (EC) (Bonacich, 1987), and Subgraph Centrality (SC) (Estrada and Rodriguez-Velazquez, 2005).
With the development of proteomics, the protein data can be easily obtained. Researchers began using different kinds of biological information in the prediction of essential proteins (Zhang et al., 2020). Many computational methods that integrate the PPI network and biological information have been proposed, such as PeC (Li et al., 2012), UDoNC (Peng et al., 2015), ION (Peng et al., 2012), and CoTB (Qin et al., 2017). Li et al. proposed a method named PeC, which is based on the integration of the PPI network and gene expression data to predict essential proteins. Wang et al. proposed a method named UDoNC to predict essential proteins by integrating the domain features of proteins and topological properties of the PPI network. Peng et al. proposed a method named ION, which integrates orthologous protein information and the PPI network to predict essential proteins. Qin et al. proposed a new method named CoTB, which integrates subcellular localization information, orthologous protein information, and the PPI network.
In addition to the two types of computational methods, some machine-learning classifiers have been introduced to predict essential proteins. The researchers used some feature selection techniques to extract features from protein data and other biological information, and then used machine-learning algorithms to classify essential proteins. The representative machine-learning algorithms are Naive Bayes (Tang et al., 2014), support vector machine (SVM) (Hwang et al., 2009), genetic algorithm (Zhong et al., 2013), and decision tree (Acencio and Lemke, 2009). In recent years, deep learning techniques show more powerful competitive than traditional machine-learning algorithms in lots of fields. Inspired by the success of deep learning techniques, several researchers use deep learning methods to predict essential proteins. Zeng et al. (2018, 2019a, 2019c) proposed several deep learning-based computational frameworks, such as DeepEP, to predict essential proteins. DeepEP uses multi-scale convolutional neural networks to extract the patterns of gene expression profiles, and it applies the node2vec technique to extract the topological features of proteins that are located in the PPI network. In addition, DeepEP takes the data imbalance into consideration. A sampling method is used to address the imbalance between essential proteins and non-essential proteins.
The mentioned computational methods exhibit good performance in the prediction of essential proteins. These computational methods always used the raw PPI network which is the most important in all biological information. However, some researchers found that there are a large number of noises in the PPI network, including false-positive and false-negative edges, which hampers the prediction of essential proteins (Von Mering et al., 2002). To eliminate the influence of these noises in the PPI network, one feasible method is to construct a reliable weighted PPI network by using some other biological information. In this study, we used three kinds of biological information, including orthologous information, RNA-Seq information, and subcellular localization information. The RNA-Seq information describes how strongly two proteins interact; this can be used to reduce noises in the raw PPI network. Similarly, the subcellular localization information reflects the spatiality of proteins, and the orthologous information represents the conservatism of proteins. The biological information can be used to reduce the false-positive and false-negative edges and to construct a reliable weighted PPI network.
In this article, we proposed a new model based on node2vec and eXtreme Gradient Boosting (XGBoost) to predict essential proteins. The workflow of our model includes three steps. First, due to the mentioned noises in the PPI network, we constructed a reliable weighted PPI network by using RNA-Seq information, subcellular localization information, and orthologous information. Second, we applied the node2vec technique to extract the topological features of each protein in the constructed weighted PPI network. Third, the XGBoost classifier is used to classify the essentiality of proteins based on the extracted features. Our model is tested on the Saccharomyces cerevisiae PPI network by comparing with several computational methods, including LAC (Li et al., 2011), NC (Wang et al., 2012), PeC (Li et al., 2012), BC (Joy et al., 2005), CC (Wuchty and Stadler, 2003), EC (Bonacich, 1987), IC (Stephenson and Zelen, 1989), SC (Estrada and Rodriguez-Velazquez, 2005), SPP (Li et al., 2018), WDC (Tang et al., 2014), RSG (Lei et al., 2018), NIE (Zhao and Lei, 2019), and DeepEP (Zeng et al., 2019c). The results show that our model performs better than other competitive methods.
2. Materials and Methods
2.1. Data source and preprocessing
In this study, four types of protein data and biological information are used, including subcellular localization information, RNA-Seq information, orthologous information, and the raw PPI network. The raw PPI network is downloaded from the BioGRID database, which is a general protein interaction network database. After removing repeated edges, there are 5501 proteins and 52,271 interactions. The dataset of essential protein is collected from the following four databases: SGD (Cherry et al., 1998), DEG (Zhang and Lin, 2008), MIPS (Mewes et al., 2002), and OGEE (Chen et al., 2011). We combined them together and obtain 1285 essential proteins.
The subcellular localization information, RNA-Seq information, and orthologous information were collected from the knowledge channel of the COMPARTMENTS database (Binder et al., 2014), the NCBI SRA database (Zhao et al., 2017), and the InParanoid database (Östlund et al., 2009), respectively. The subcellular localization of S. cerevisiae can be divided into 11 compartments: cytoskeleton, cytosol, endoplasmic, endosome, vacuole, golgi, plasma, nucleus, peroxisome, mitochondrion, and extracellular. The RNA-Seq dataset contains gene expression profiles of 7108 proteins. The gene expression profiles represent the metabolic cycle, with 12 time points of each protein in S. cerevisiae. There are a large number of species that have orthologous proteins in S. cerevisiae. We selected 99 species that have the highest similarity with S. cerevisiae. We calculated the frequency of protein homology with 99 species to obtain an orthologous score.
2.2. Constructing weighted PPI network
In general, the raw PPI network can be represented as an undirected graph G (V, E), which consists of a set of nodes
Recently, researchers found that the noises in the raw PPI network will significantly affect the performance of essential protein prediction. Thus, it is imperative to construct a reliable weighted PPI network. For this purpose, we constructed the weighted PPI network by using subcellular localization information, RNA-Seq information, and orthologous information. RNA-Seq information represents the intensity of expression, and each protein has an expression profile with 12 time points, which can be regarded as a feature vector with a 12 dimensionality of proteins. Subcellular localization information indicates which compartment the protein is located in. It is divided into 11 compartments, and thus we use an 11-dimensionality vector to encode it (each dimension represents a specific subcellular localization of a protein). Orthologous information is a real number that represents the degree of homology between S. cerevisiae and other 99 species. Finally, the combination of the three kinds of biological information can be used to construct the weighted PPI network and effectively reduce the noises in the raw PPI network.
2.2.1. Obtain better representation with principal component analysis
Subcellular localization information, RNA-Seq information, and orthologous information are three different kinds of biological information, which leads to the inability to combine them together to weight the raw PPI network directly. Specifically, the differences between the three kinds of biological information have two points. First, the ranges of values in the three types of biological information are completely different. Second, the RNA-Seq information and orthologous information are dense vectors whereas the subcellular localization information is a very sparse vector.
To solve these problems and obtain an effective protein representation vector, the principal component analysis (PCA) technique is applied to reduce the dimension of the raw protein representation vector. When PCA does feature extraction, it projects the samples from the high-dimensional space to the low-dimensional space by linear transformation, so that a dense low-dimensional protein vector can be obtained, which is more suitable for the weight of edges calculation. The steps of PCA are:
We assume a protein set First, the feature vector minus the mean value:

Second, calculate the covariance matrix ∑ of X:
Third, calculate the eigenvalue
Finally, transform the protein set X from high-dimension n to low-dimension
where
The value of
2.2.2. Calculation of the strength of interacting proteins by Pearson's correlation coefficient
Pearson's correlation coefficient (PCC) is a popular method to calculate the similarity. In this article, we used PCC to calculate the intensity of the interaction between a pair of protein nodes based on the representation vector of each protein. For two interacting protein nodes vi =
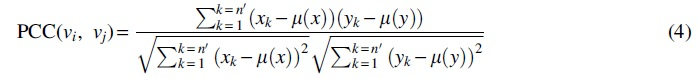
where
Finally, we obtained a weighted PPI network, and the
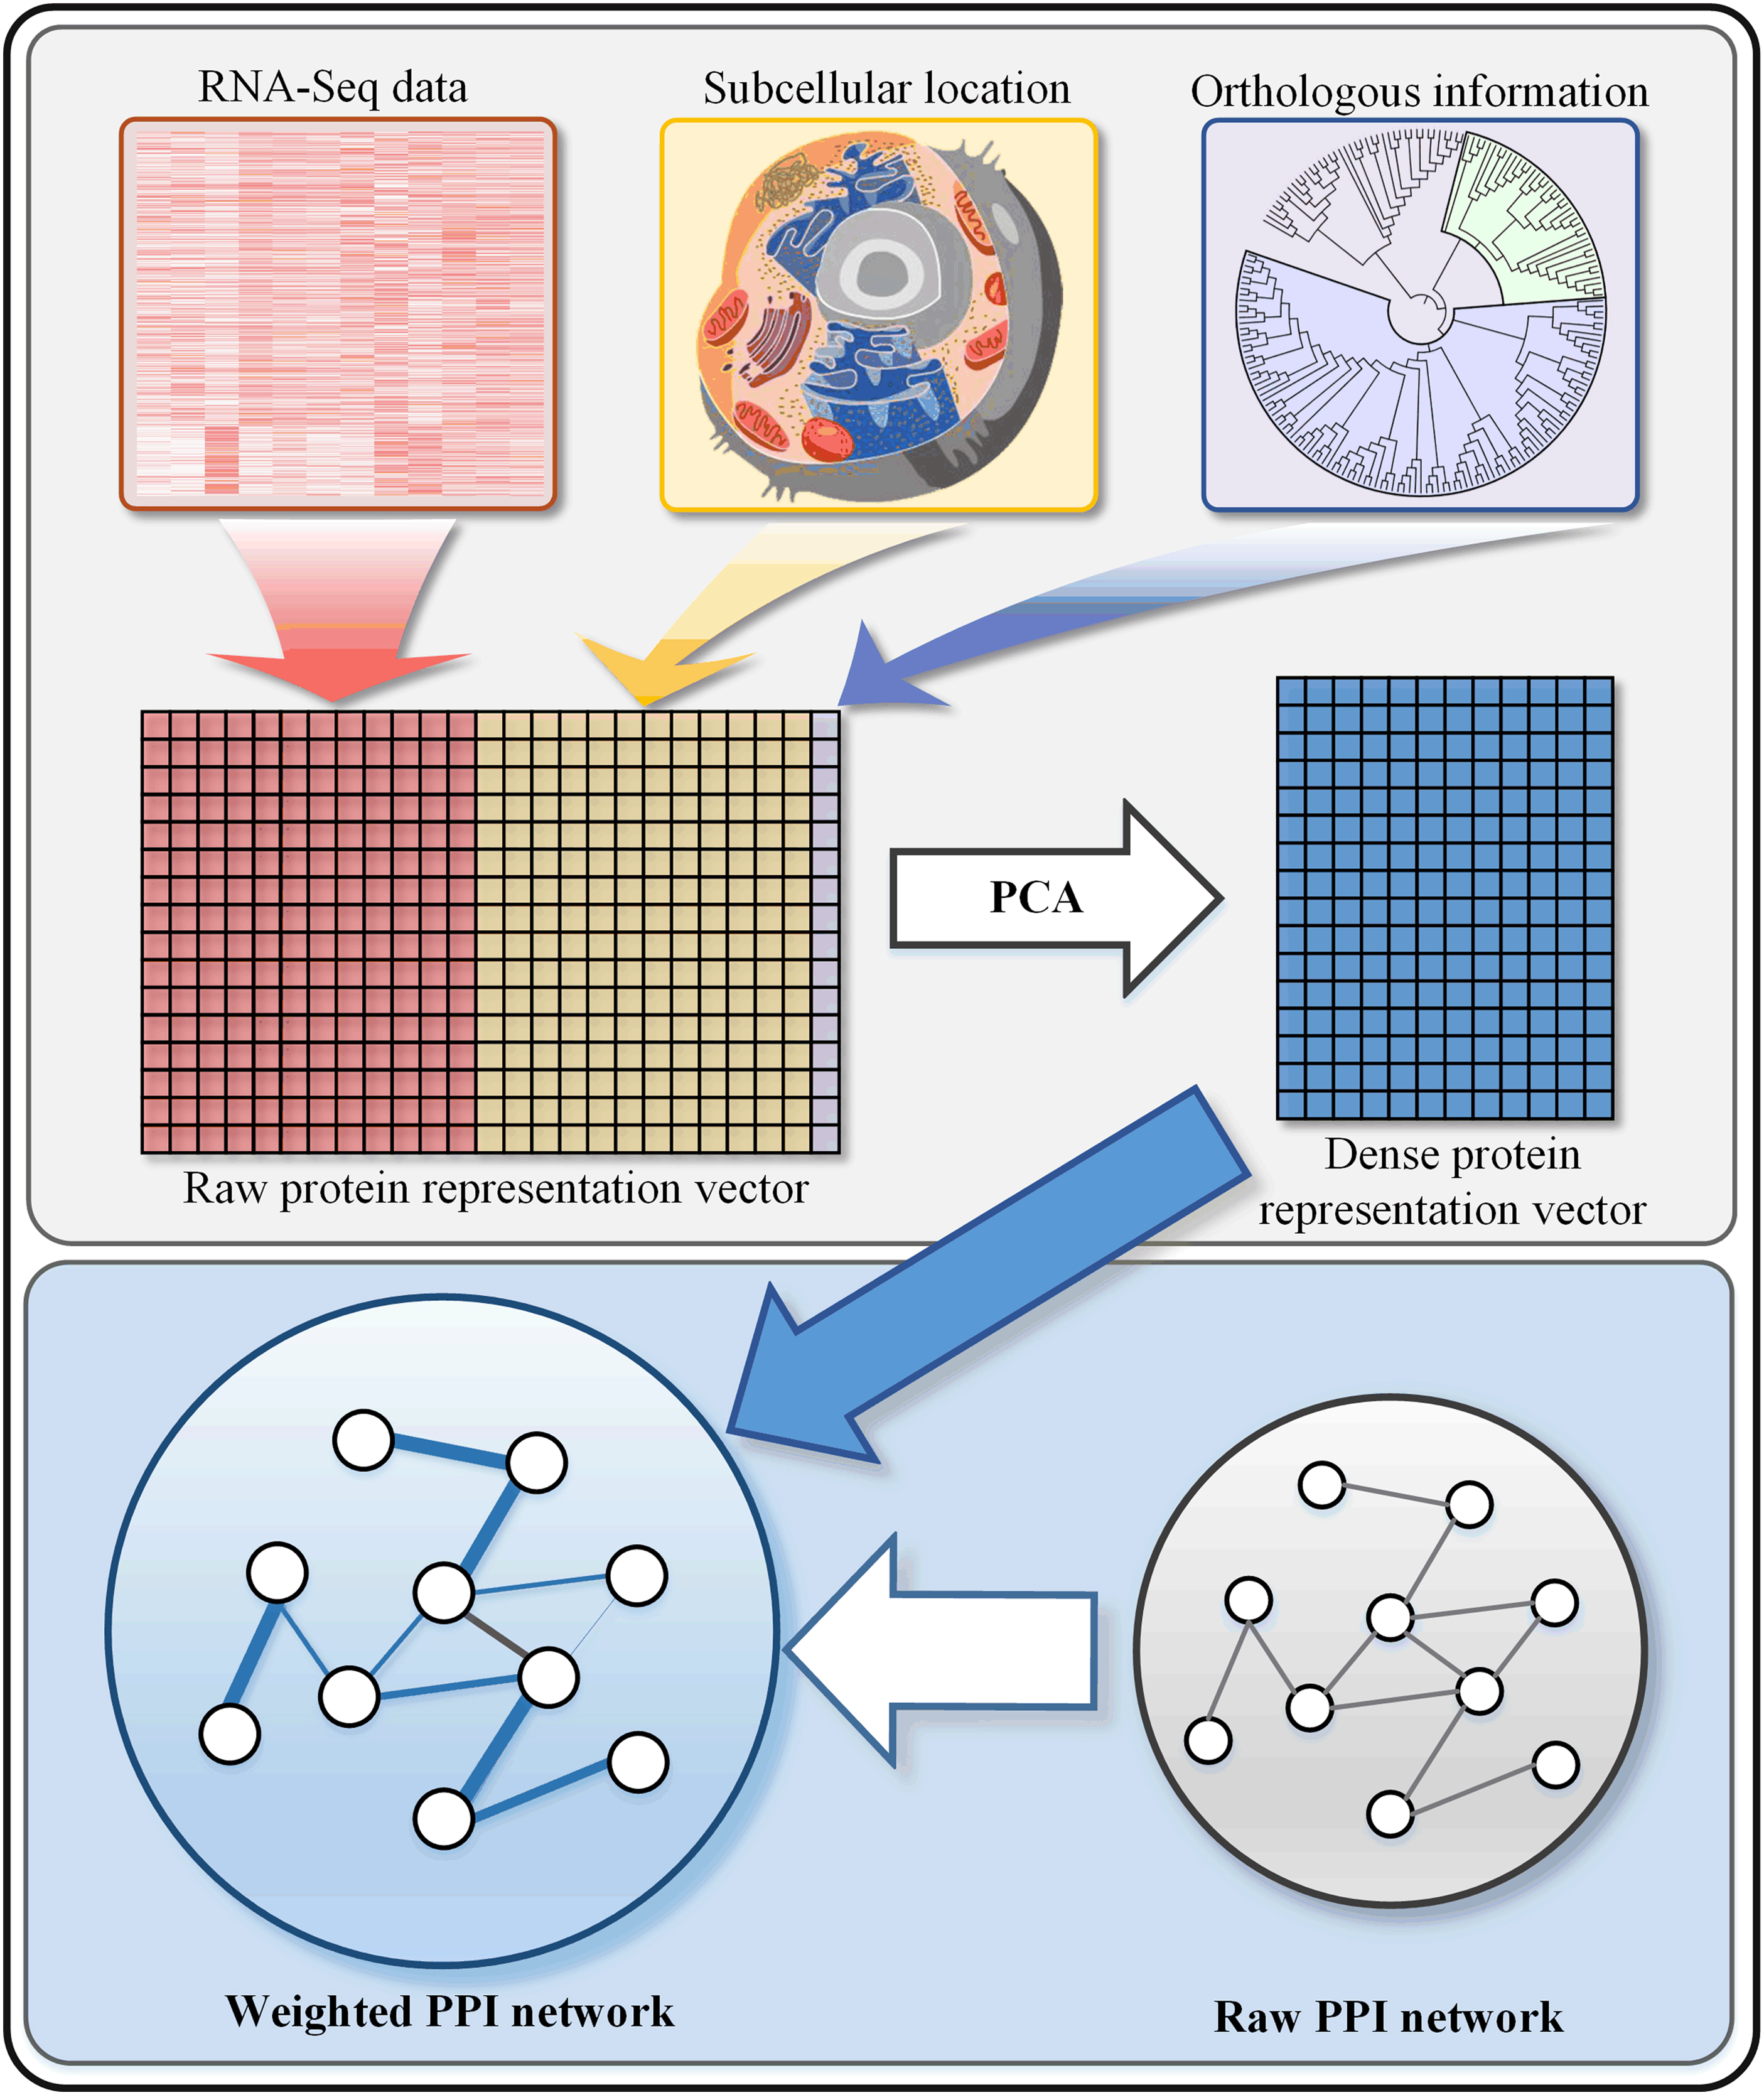
The workflow of constructing the weighted PPI network. To obtain a reliable weighted PPI network. RNA-Seq information, subcellular localization, and orthologous information are used to eliminate the noises. The PCA is used to obtain protein representation vectors, and the PCC is used to weight the raw PPI network according to protein representation vectors. PCA, principal component analysis; PCC, Pearson's correlation coefficient; PPI, protein-protein interaction.
2.3. Prediction of essential proteins based on node2vec and XGBoost
Considering that the PPI network is the most important part in the prediction of essential proteins, we need to find an appropriate technique to obtain the topological features of proteins. The traditional feature selection method from the PPI network is Manual feature selection. However, there are three limitations. First, researchers need to have a lot of prior knowledge in the field. Second, researchers from different backgrounds have different ideas for the same problem, thus they may use different features to design the model. Third, the selected feature (such as DC, CC) is a scalar, which cannot represent the complex topological information of the PPI network. Network representation learning can overcome these limitations, and thus we used node2vec (Grover and Leskovec, 2016) to learn the topological features from the constructed PPI network.
Node2vec was proposed in 2016, and the main steps are as follows. First, in graph G, the node sequences are generated according to the connection relation of nodes. The two parameters p and q are defined in Node2vec to balance depth-first search and breadth-first search; the generated node sequences can retain both local neighbor node relationship and global structure information. Second, the Skip-Gram model (Mikolov et al., 2013) is used to predict the context of a given central vertex. The goal of the Skip-Gram model is maximizing the co-occurrence likelihood of the given central vertex and the context. Eventually, the topological features of vertices can be obtained.
The XGBoost (Chen et al., 2017) algorithm is an ensemble learning method. At the beginning, the XGBoost algorithm uses a simple model to fit the data. Then, simple models are overlaid onto the XGBoost model constantly. With the increase of the number of simple models, the complexity of the whole XGBoost model becomes higher. The model performs best in the prediction of essential proteins when the complexity of the model is equal to the complexity of the data. Figure 2 shows the flow of feature extraction and classification.
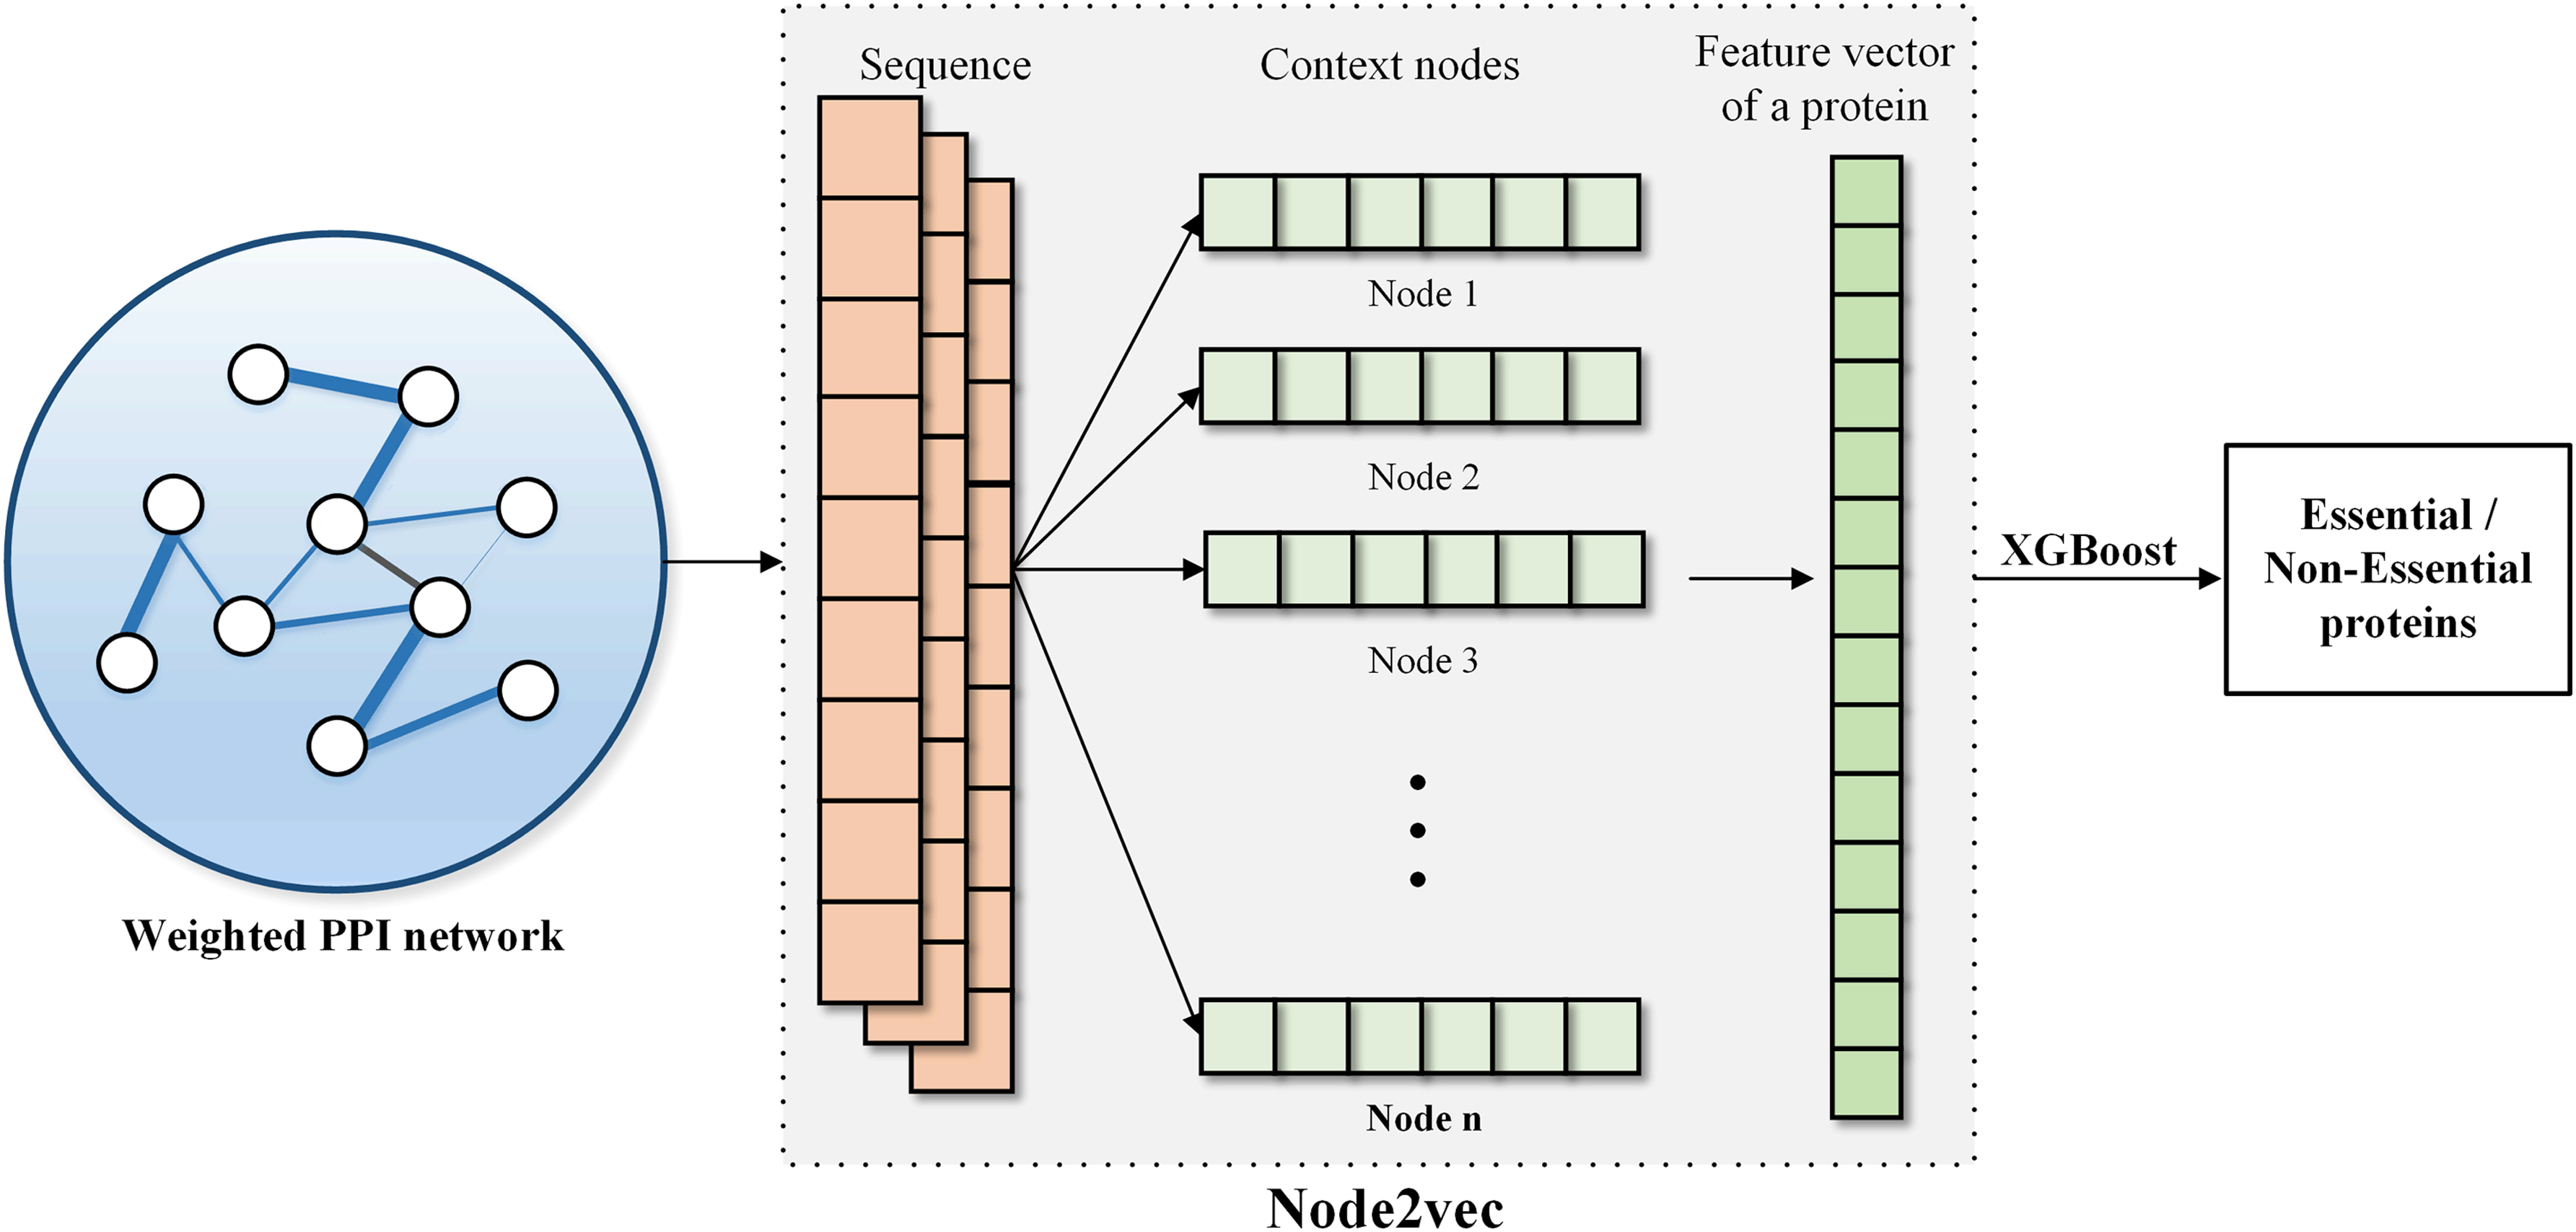
The workflow of protein feature extraction and essential protein prediction. Node2vec is used to extract the features of proteins in the weighted PPI network, and then the XGBoost classifier is used to predict essential proteins. XGBoost, eXtreme Gradient Boosting.
2.4. Assessment metrics
To evaluate the performance of our model, we used five assessment metrics: accuracy, precision, recall, F-score, and area under curve (AUC). They are defined as follows:
where TP means the number of essential proteins that are correctly classified as essential proteins, TN means the number of non-essential proteins that are correctly classified as non-essential proteins, FP means the number of non-essential proteins that are incorrectly classified as essential proteins, and FN means the number of essential proteins that are incorrectly classified as non-essential proteins.
The AUC is a widely used measure to evaluate the performance of a classifier; it is defined as the area under the Receiver Operating Characteristic (ROC) curve. The ROC curve is drawn with the false-positive rate (FPR) and the true-positive rate (TPR). The FPR and TPR are defined as:
3. Results
3.1. Comparison with other computational methods
In this study, we compared our model with some current computational methods, including topology-based methods (BC, CC, EC, IC, LAC, NC, SC, PeC, SPP, WDC, RSG, NIE) and a deep learning-based method (DeepEP), by using four assessment metrics, including accuracy, precision, recall, and F-score. Since the topology-based methods use scoring functions to score the nodes, we sorted the nodes according to their scores and took the top 1285 nodes as candidate essential proteins and the last 4126 nodes as candidate non-essential proteins. The results of our model and other computational methods are shown in Table 1. By comparing these methods, the performance of our model is verified.
Comparison of the Predicted Results Between Our Model and Other Computational Methods, Including Topology-Based Methods and Deep Learning-Based Methods
BC, Betweenness Centrality; CC, Closeness Centrality; EC, Eigenvector Centrality; IC, Information Centrality; LAC, Local Average Connectivity; SC, Subgraph Centrality.
As can be seen from the results in Table 1, our model has better performance in all assessment metrics. In the topology-based methods, the highest values of these assessment metrics are the accuracy of LAC, the precision of SPP, the recall of NIE, and the F-score of SPP, respectively. Our model outperforms other computational methods in accuracy, precision, recall, and F-score, at 7.3%, 7.0%, 9.8%, and 14.3%, respectively. Compared with DeepEP, which is a deep learning-based method, we found that our model improves the accuracy, precision, recall, and F-score by 0.2%, 3.1%, 6.9%, and 7.1%, respectively. Besides, we found some interesting phenomena. The performance of the CC method is not as good as other topology-based methods. The performance of LAC and NC, EC and SC, PeC, and WDC is very similar. The SPP is a method that was published in 2018 and it has the highest F-score among the 12 topology-based methods. The RSG and NIE are the comparatively new topology-based methods to identify essential proteins in the past 2 years and have exhibited decent performance among the topology-based methods. DeepEP is a deep learning-based method to identify essential proteins and have good performance. In other words, our model has better performance than other computational methods.
3.2. Comparison with other machine-learning models
In this study, to find the best machine-learning classifier, we compared our model with other machine-learning methods, including SVM, Naive Bayes, decision tree, random forest, and AdaBoost. The results of the five classifiers are shown in Table 2. We can see that the results of our model are the best (accuracy: 0.82, precision: 0.60, recall: 0.58, F-score: 0.59, AUC: 0.82), which are higher than SVM (0.70, 0.38, 0.62, 0.47, and 0.73), Naive Bayes (0.79, 0.50, 0.38, 0.43, and 0.72), decision tree (0.71, 0.35, 0.40, 0.37, and 0.60), random forest (0.79, 0.54, 0.17, 0.26, and 0.67), and AdaBoost (0.79, 0.51, 0.29, 0.37, and 0.71). We drew the ROC curves of the five classifiers and showed them in Figure 3. From Figure 3, the ROC curve of our model is higher than other machine-learning classifiers.
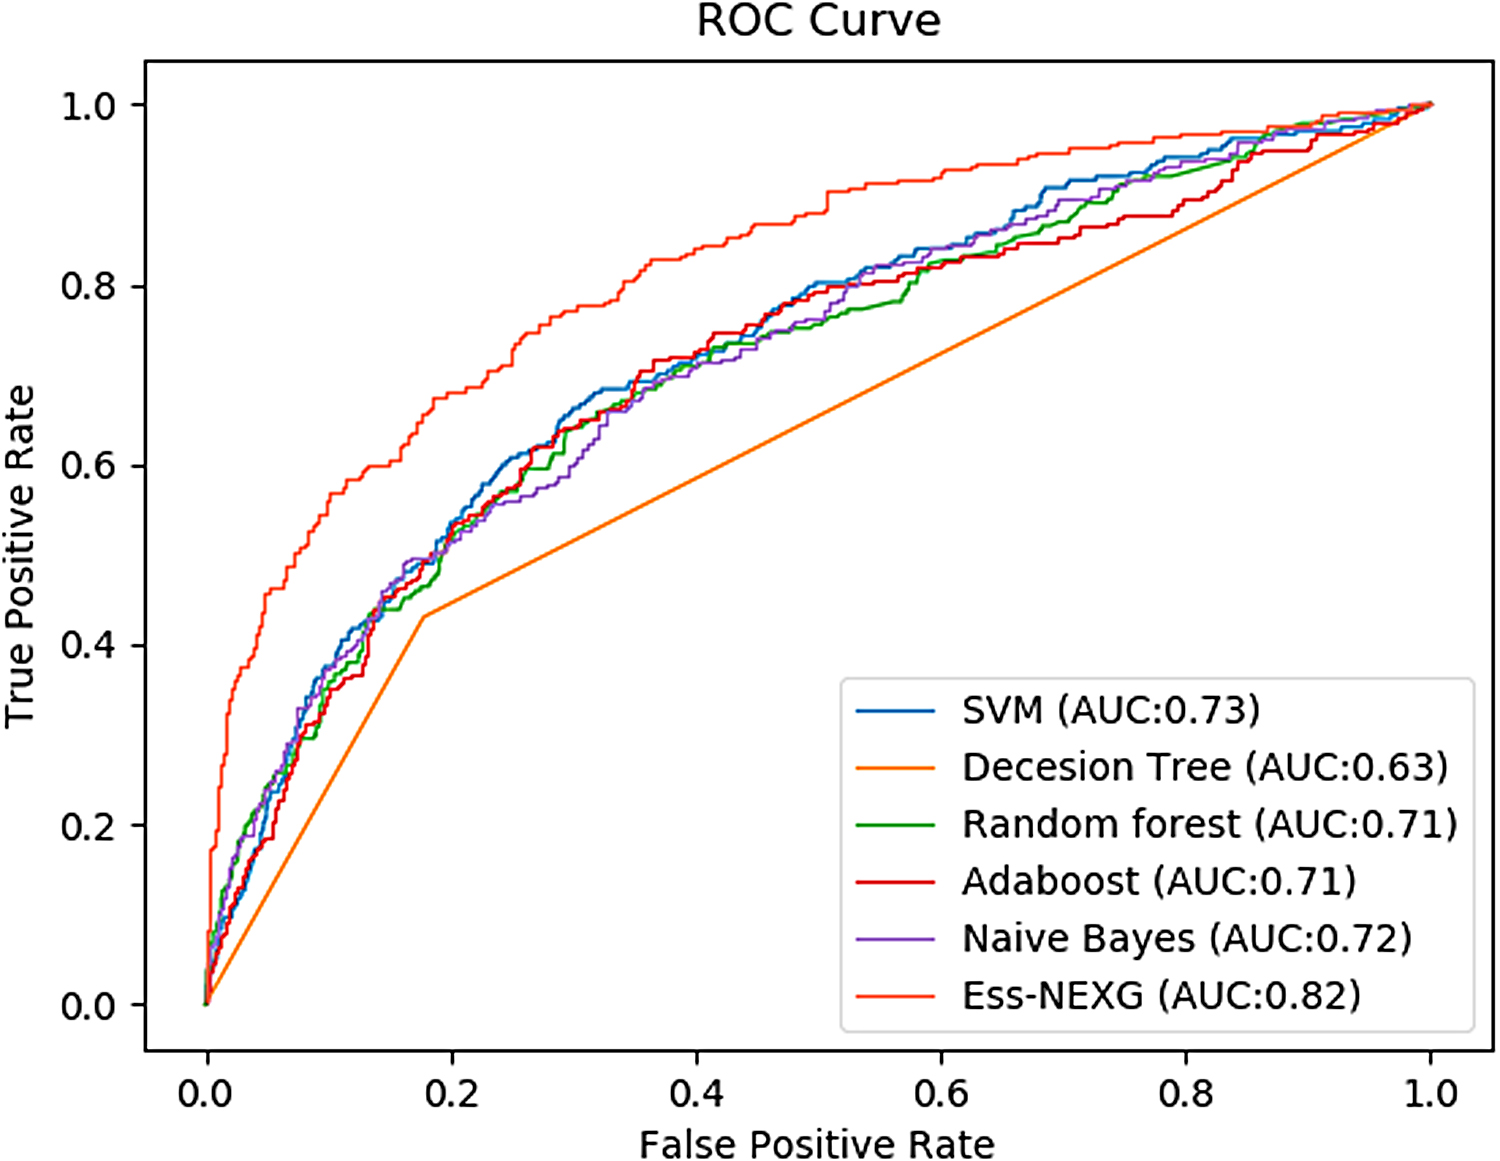
ROC curves of our model and other machine-learning algorithms. ROC, Receiver Operating Characteristic.
Comparison of the Prediction Results of Our Model with Other Machine-Learning Classifiers
AUC, area under curve; SVM, support vector machine.
3.3. The effects of different parameters and similarity calculation methods in our model
In our model, some parameters and similarity calculation methods have different effects on experimental performance. Here, we focused on two types of parameters and similarity calculation methods: the low dimension
3.3.1. The effects of the low dimension
of PCA
In our model, choosing the low dimension of representation vector when using the PCA technique has a significant impact on the performance of essential protein identification. To find the most suitable dimension for the low dimension
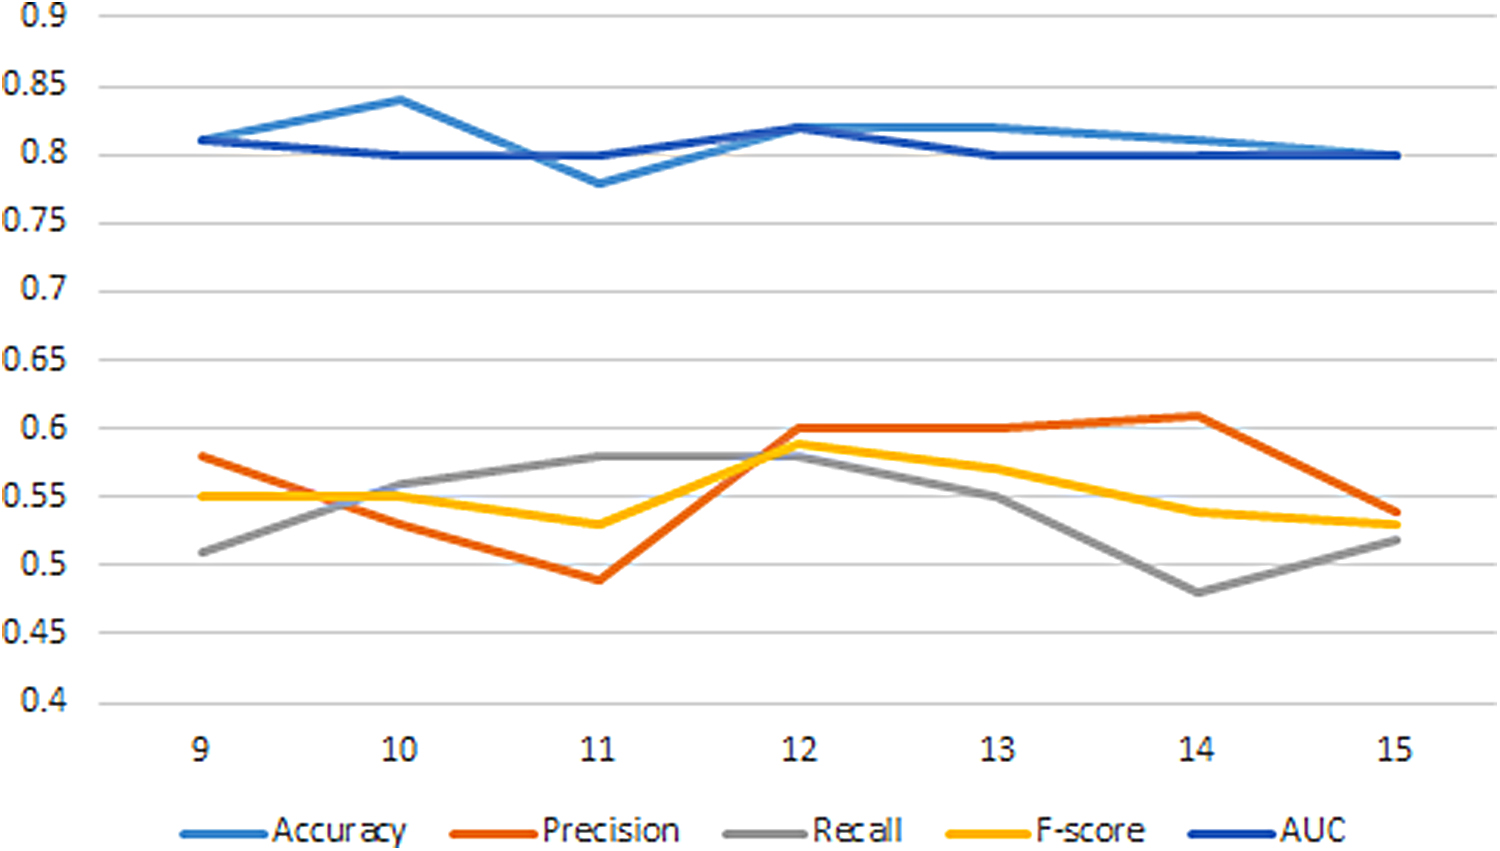
Comparison of the effects of different dimensions.

ROC curves of different dimensions.
3.3.2. The effects of different similarity calculation methods
As mentioned earlier, there is a lot of noise in the PPI network. Based on the integrated biological data, it is very important to choose an appropriate similarity calculation method when we weight the constructed network. To find a suitable similarity calculation method, we compared three similarity calculation methods: PCC, Spearman correlation coefficient (SCC), and cosine similarity (CoS).
In the SCC method, the sample is sorted in descending order by its numerical value, and each sample can get a score. The SCC is similar to the PCC. For the two samples
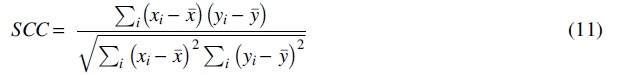
where
The CoS measures the difference between two samples by calculating the cosine value between two vectors in a vector space. The two vectors are similar when the cosine value is closer to 1, which indicates that the angle between these two vectors approaches 0. For the two samples
Table 3 shows the performance of the three similarity calculation methods. From five assessment metrics, accuracy, precision, recall, F-score, and AUC, we can see that when we choose PCC to calculate the strength between two interacting proteins, the model has the largest values (0.82, 0.60, 0.58, 0.59, and 0.82). From Table 3, it was observed that the model has the worst performance when we used SCC to calculate the weight of edges in the PPI network. Figure 6 shows the ROC curves of the three similarity calculation methods. It can be seen, when using PCC to calculate the weight of edges in the PPI network, that the ROC curve of the model is higher than other methods, and the value of AUC is the largest. The results show that PCC is the most suitable similarity calculation method for the calculation of the weight in the PPI network, which gives our model better performance than other similarity calculation methods.
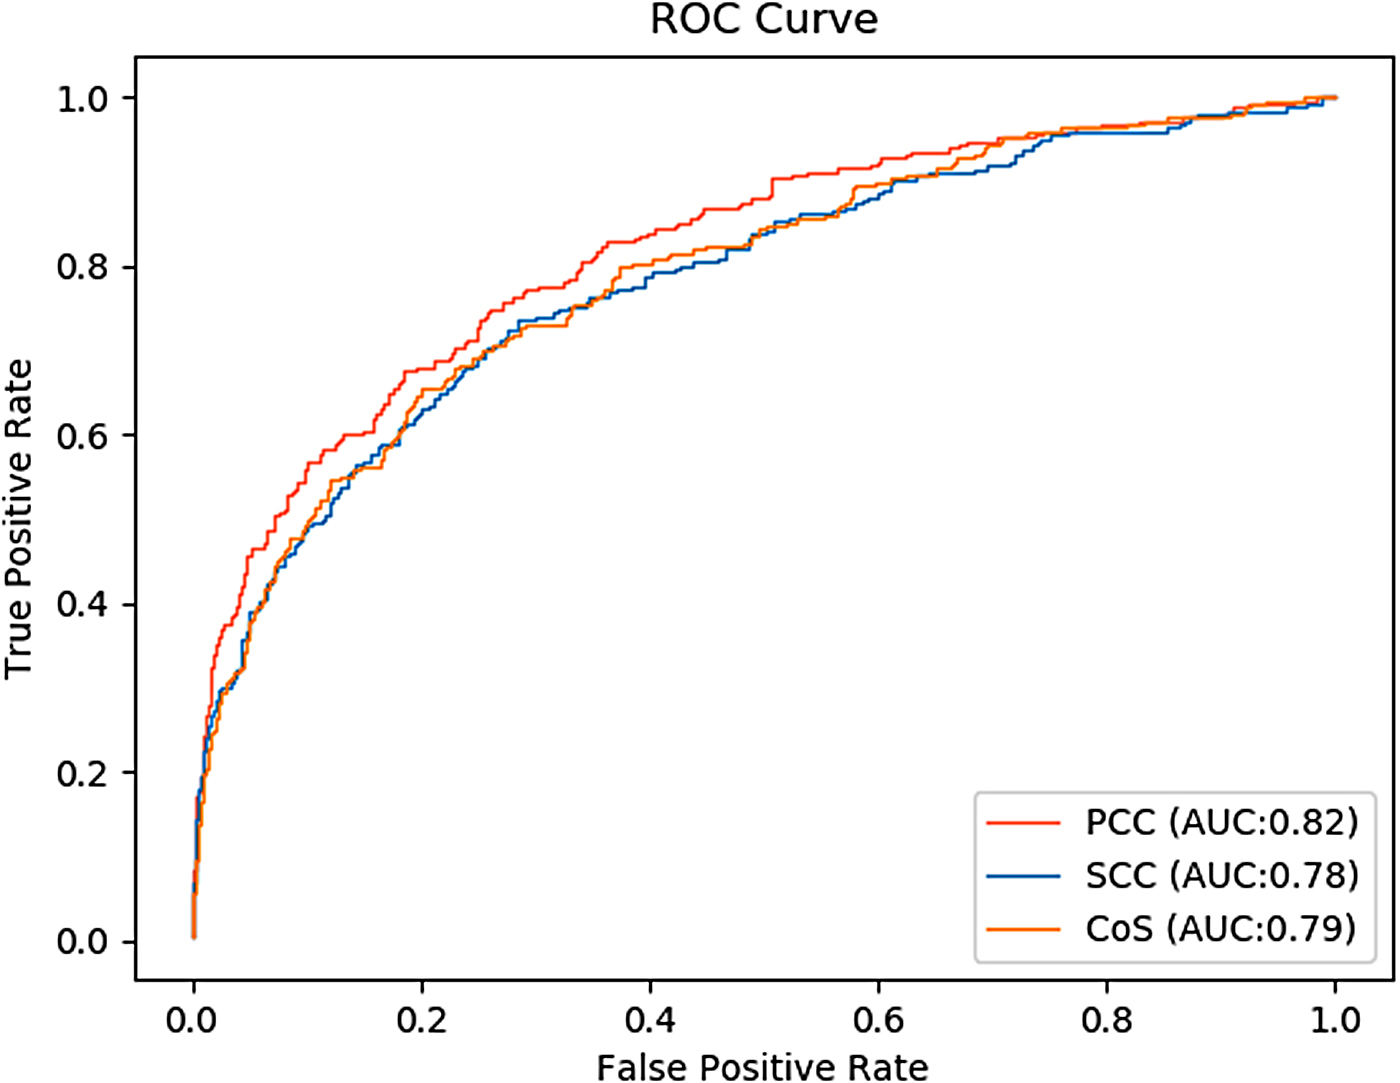
ROC curves of three similarity methods.
Comparison of the Effects of Different Similarity Calculation Methods
CoS, cosine similarity; PCC, Pearson's correlation coefficient; SCC, Spearman correlation coefficient.
3.4. Comparisons with the model without PCA and the model using raw PPI network
In our study, we aimed at investigating whether a constructed weighted PPI network could achieve prominent improvements in the task of the identification of essential proteins. In our model, we carried out two steps: dimensionality reduction by using PCA and the weighted PPI network. To verify the need for them, we conducted an ablation study. Specifically, we compared the performance of our model with the model without PCA and the model with the raw PPI network. The results are shown in Table 4. From the experimental results, we can see that the worst performance is achieved when using the model without PCA. It shows that using PCA to address different sources of biological data is very important in our model. In addition, we found that the performance decreases when using the raw PPI network. It shows that the noses in the raw PPI network hamper the classification task. Figure 7 shows the ROC curves of the three models. It can be seen that the ROC curve of our model is higher than the other two models. In summary, our model has the best performance than other models, which means that the dimension reduction is necessary for PPI network weighting, and the weighted PPI network in our model improves the performance of essential proteins identification. Hence, there is a significant improvement for the identification of essential proteins by weighting the raw PPI network with multisource biological data to construct a more reliable PPI network.
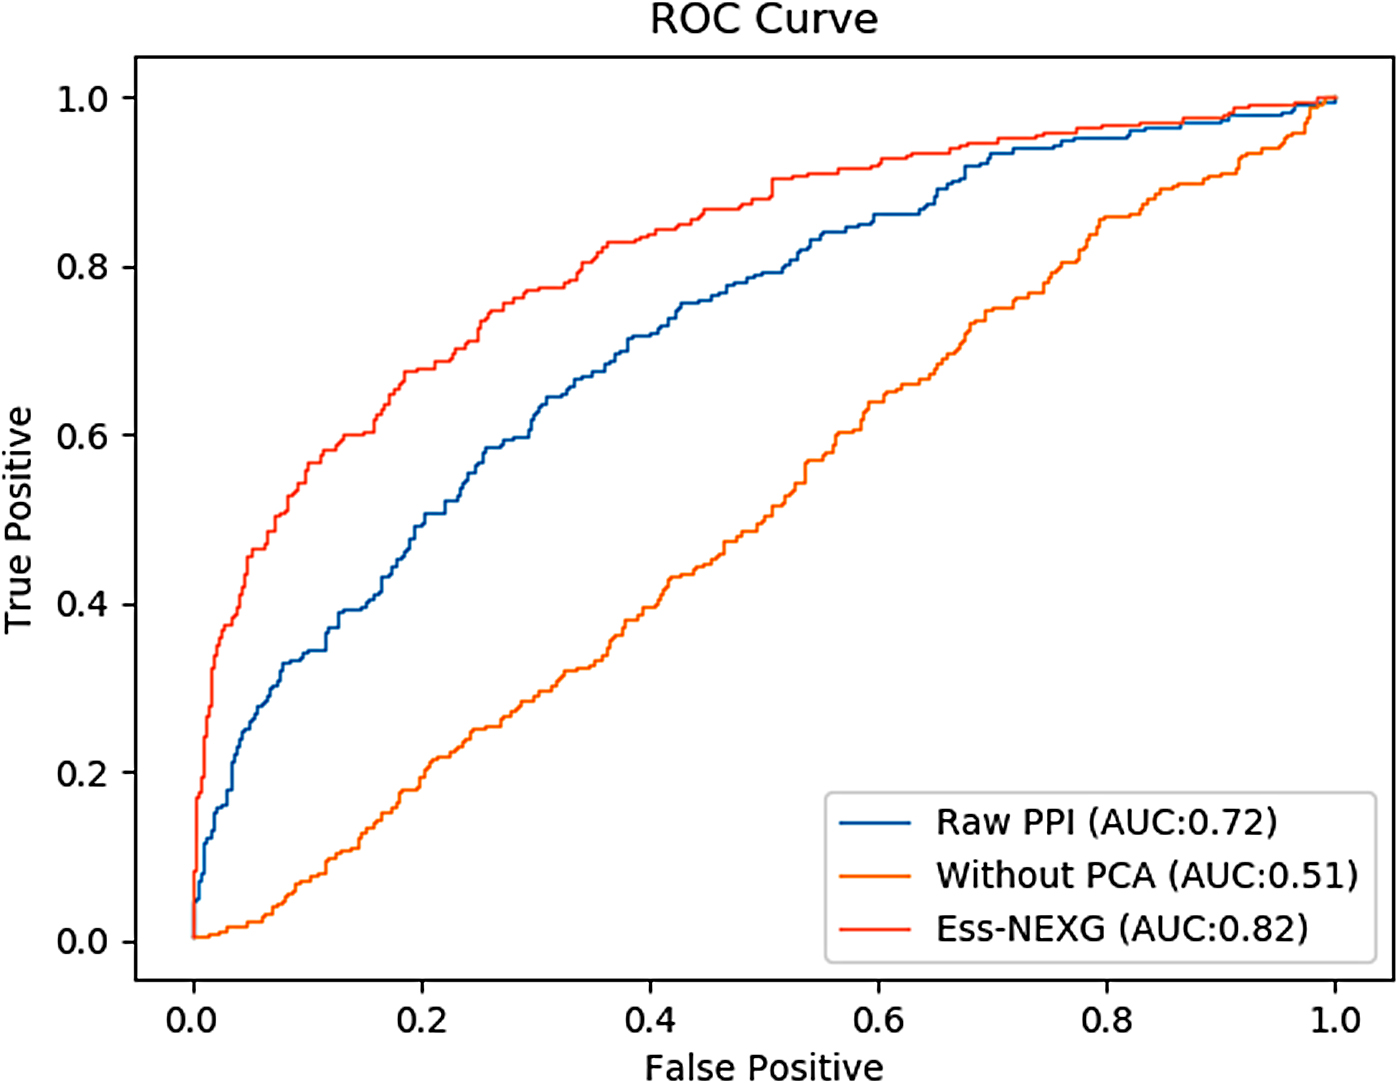
ROC curves of our model, the model without PCA, and the model using the raw PPI network.
Comparison of the Accuracy, Precision, Recall, F-Score, and Area Under Curve of Our Model, the Model Without Principal Component Analysis, and the Model Using Raw Protein-Protein Interaction Network
PCA, principal component analysis; PPI, protein-protein interaction.
4. Conclusion
Essential proteins are indispensable for the survival of organisms and cells. Developing an accurate computational method to identify essential proteins is very useful for biologists. In this study, we proposed a new model based on node2vec and XGBoost to predict essential proteins. It has been proved that there are a lot of noises in the raw PPI network; thus, we used RNA-Seq information, subcellular localization information, orthologous information, and the raw PPI network to construct a high-quality and reliable weighted PPI network. Then, we applied the node2vec technique to extract the topological features of proteins. Last, the XGBoost classifier is used to predict the essentiality of proteins. To evaluate the performance of our model, we compared it with several competitive computational methods. The experimental results show that our model outperforms them. To find the most suitable parameters and similarity calculation method in our model, we also carried out a series of experiments. By comparing with the model using the raw PPI network, our weighted PPI network greatly improves the performance of essential protein prediction. The results indicate that constructing a weighted PPI network is very helpful in the prediction of essential proteins. In the future, we would further improve the performance of essential protein prediction by using powerful deep learning techniques (Zeng et al., 2019b) and useful biological information (Zeng et al., 2019b; Zhang et al., 2019d).
Footnotes
Acknowledgment
Author Disclosure Statement
The authors declare they have no conflicting financial interests.
Funding Information
This work was supported in part by the National Natural Science Foundation of China under Grant (No. 61832019), Hunan Provincial Science and Technology Program (2019CB1007), and the Degree & Postgraduate Education Reform Project of Hunan Province (Grant No. 2019JGYB051).