
Abstract
Viral infectious diseases have been seriously threatening human health. The receptor binding is the first step of viral infection. Predicting virus–receptor interactions will be helpful for the interaction mechanism of viruses and receptors, and further find some effective ways of preventing and treating viral infectious diseases so as to reduce the morbidity and mortality caused by viruses. Some computation algorithms have been proposed for identifying potential virus–receptor interactions. However, a common problem in those methods is the presence of noise in the similarity network. A new computational model (Network Enhancement and the Regularized Least Squares [NERLS]) is proposed to predict virus–receptor interactions based on improving similarities by Network Enhancement (NE). NERLS integrates the virus sequence similarity, the receptor sequence similarity and known virus–receptor interactions. We compute the virus sequence similarity and known virus–receptor interactions to construct the virus similarity network. The receptor similarity network is constructed by the Gaussian interaction profile kernel similarity and the receptor sequence similarity. To obtain the final virus similarity network and the final receptor similarity network, NE is, respectively, applied for reducing the noise of the virus similarity network and the receptor similarity network. Finally, NERLS employs the regularized least squares to predict interactions of viruses and receptors. The experiment results show that NERLS achieves the area under curve value of 0.893 and 0.921 in 10-fold cross-validation and leave-one-out cross-validation, respectively, which is consistently superior to four related methods [which include Initial interaction scores method via the neighbors and the Laplacian regularized Least Square (IILLS), Bi-random walk on a heterogeneous network (BRWH), Laplacian regularized least squares classifier (LapRLS), and Collaborative matrix factorization (CMF)]. Furthermore, a case study also demonstrates that NERLS effectively predicts potential virus–receptor interactions.
1. Introduction
As a main part of the human microbiome, viruses are closely related to human health and disease. Previous studies showed that humans could get sick from hundreds of viruses (Geoghegan et al., 2016), especially emerging and epidemic-prone viruses, such as Severe Acute Respiratory Syndrome Coronavirus 2 (SARS-CoV-2; Zhou et al., 2020), Severe Acute Respiratory Syndrome Coronavirus (SARS-CoV; Ge et al., 2013), and Middle East Respiratory Syndrome (Breban et al., 2013). For example, a recent widespread outbreak of SARS-CoV-2 in Wuhan China (Zhou et al., 2020) has caused severe acute respiratory syndrome and spread quickly from person to person across more than one geographical region. Up to October 20, 2020, the world health organization reported that the world had disclosed 39,944,882 confirmed cases and 1,111,998 deaths of SARS-CoV-2 infection (WHO, 2020). This causes a great panic major scare around the world. Recent studies show that angiotensin converting enzyme 2 is a receptor of SARS-CoV-2 (Zhou et al., 2020).
The binding of a virus to its corresponding receptor is the initial event of viral infection (Baranowski et al., 2001). The specificity and affinity are the major factors of the viral attachment to various kinds of molecules (Casasnovas, 2013). An increasing number of studies suggest that these molecules (e.g., protein), which are also easy targets for viruses, are selected as receptors (Li, 2016). During this process of viral infection, interactions of viruses and receptors are dynamic and evolve while virus variants with distinct receptor-binding specificity and tropism can appear (Casasnovas, 2013).
To understand the mechanism of virus–receptor interactions, Zhang et al. (2019) presented a data set (viralReceptor) of mammalian virus–receptor interactions. Based on this data set, Yan et al. (2019) further selected human interactions of viruses and receptors as a benchmark data set. However, so far, a few models have been proposed to predict human virus–receptor interactions, and the performance needs to be improved. In addition, more biological information is also applied for improving the performance, such as protein domain, viral protein structure, and protein–protein interaction information.
In this study, a computational approach (Network Enhancement and the Regularized Least Squares [NERLS]) is presented for predicting virus–receptor interactions based on improving similarities through NERLS algorithm. In NERLS, the virus similarity network is constructed by integrating the virus sequence similarity and Gaussian interaction profile (GIP) kernel similarity. We construct the receptor similarity network by computing the amino acid sequence similarity and known virus–receptor interactions.
To obtain the final similarity network of viruses and receptors, Network Enhancement (NE) is, respectively, applied for reducing the noise of the similarity network of viruses and receptors. Finally, the regularized least squares (RLS) algorithm is employed for identifying the potential virus–receptor interactions. To assess the effectiveness of NERLS in identifying the interactions of viruses and receptors, the 10-fold cross-validation (10-fold CV) and leave-one-out cross-validation (LOOCV) are used for evaluating the ability of NERLS and four related models. Experimental results show that an average area under curve (AUC) values of NERLS (0.8930) outperforms other computational models [Initial interaction scores method via the neighbors and the Laplacian regularized Least Square (IILLS): 0.8675; Bi-random walk on a heterogeneous network (BRWH): 0.7959; Laplacian regularized least squares classifier (LapRLS): 0.7577; and Collaborative matrix factorization (CMF): 0.7128] in 10-fold CV. Furthermore, the LOOCV experimental results also show that NERLS achieves the AUC values of 0.9210, which is better than other computational models of 0.9061 (IILLS), 0.8105 (BRWH), 0.7713 (LapRLS), and 0.7491 (CMF). In addition, a case study further demonstrates that NERLS is an effective model to identify potential interactions of viruses and receptors.
2. Methods
2.1. Materials
As a popular database, viralReceptor is used to store the known mammalian virus–receptor interactions (Zhang et al., 2019). The human virus–receptor interactions were obtained from viralReceptor as the benchmark data set (Yan et al., 2019). These are 211 known interactions between 104 viruses and 74 receptors in this benchmark data set. In this study, 211 known interactions are chosen as the positive subset, and 7485 unknown interactions are chosen as the negative subset. Let  denote nv viruses in the set V and
  represent nr drugs in the set R, then
In addition, the U.S. National Center for Biotechnology Information (NCBI) stores many viral RefSeq genomes. We download these viral RefSeq genomes from NCBI and use the
2.2. Construction of the virus similarity network
2.2.1. Virus similarity based on oligonucleotide frequency measures
With the development of the sequencing technology, more and more viral genomic sequences have become publicly available. The viral genomic sequences can be used to compute the sequence similarity of viruses. There are some computational approaches of measuring dissimilarity to infer the correlation of viral genomic sequences based on genomic k-mer frequencies. According to the assumption that similar k-mer patterns are shared between similar viruses (Ahlgren et al., 2017), we can use the k-mer similarity to measure the correlation of the virus vi and the virus vj. The k-mer is the substring of length k, which can be represented as follows:
in which
where
When k is initialized to 6 according to the previous studies (Ahlgren et al., 2017), we can compute the correlation
2.2.2. Virus similarity based on Gaussian interaction profile kernel
GIP kernel was widely applied for computing the similarity between biological entities in biological networks (van Laarhoven et al., 2011). Based on the assumption that similar viruses incline to associate with similar receptors (Yan et al., 2019), the virus GIP kernel similarity
where
2.2.3. Construction of the integrated virus similarity network
As shown earlier, the GIP kernel similarity matrix
2.3. Construction of the receptor similarity network
Two main methods are used to compute receptor similarities based on amino acid sequences of receptors and known virus–receptor interactions. First of all, we download the amino acid sequences of receptors and use their normalized Smith–Waterman score to compute the similarity of receptors. Let
As in the approach of the virus GIP kernel similarity, the receptor GIP kernel similarity
According to the virus similarity integration method, we integrate the receptor sequence similarity
2.4. Network Enhancement
Aiming at the noise problem of the similarity networks, some methods have been proposed to reduce the noise of the similarity network, but cannot obtain an evident noise reduction effect. In this study, the NE (Wang et al., 2018) method is applicable for denoising the virus similarity network SV and the receptor similarity network SR, respectively. For example, we take the virus similarity network as the input network. The virus similarity network can be represented by G (V, E, W) where V is the set of nodes of G, E is the edges of G and W is the edge weights of G. Let D denote the diagonal matrix whose entries are defined as
The row-normalized transition probability matrix P can be expressed as follows:
Let Nm denote the set of K-nearest neighbors of virus m, and then a novel localized network
where
where t is the iterative step, the virus similarity network is set as the initial value of Wt, and
According to this diffusion process, we obtain the final virus similarity network
2.5. Initialized interaction profiles for the new viruses or the new receptors
Considering that a virus may not be associated with all the receptors or a receptor may not be associated with all the viruses, the known interactions profiles of all neighbors are introduced to initialize the interaction score for this new virus (or receptor). For a new virus vi, we can compute the initial interaction profile of it and a receptor rj as follows:
As mentioned earlier, the initial interaction profile of this new receptor rj and a virus vi are also computed by the same method as follows:
2.6. Regularized least square
The RLS are widely employed for identifying hidden interactions between biological entities. In this study, a new model (NERLS) is explored in identifying interactions of viruses and receptors based on the final virus similarity network
First, let DV and DR denote two diagonal matrixes, then DV and DR are defined as follows:
Second, we normalize the final virus similarity network and the final receptor similarity network to obtain two normalized Laplacian similarity matrixes LV and LR by the Laplacian operation, respectively.
Let
In this study, we set the trade-off parameters
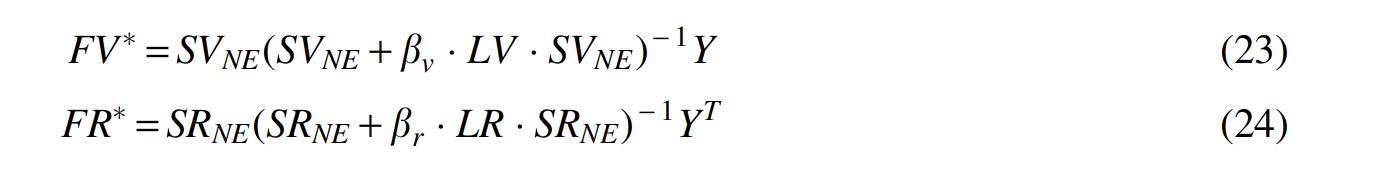
Finally, two prediction matrixes

4. Experiments and Results
4.1. Performance evaluation
The performance of NERLS is evaluated by two cross-validation approaches, including 10-fold CV and LOOCV. Known virus–receptor interactions are randomly divided into 10 exclusive subsets with the equal size in 10-fold CV. One of 10 subsets is chosen as the test data in sequence and the rest are selected as the training data. We run 10-fold CV 100 times and take the average as the final results.
For LOOCV, one of all known interactions is chosen as the test data in sequence and the rest known interactions are selected as the training set. Moreover, all the unknown virus–receptor interactions are used as the candidate interactions. After LOOCV is implemented 210 times, each known interaction is ranked relative to candidate interactions.
4.3. Comparison with highly related methods
To assess the performance of NERLS, 10-fold CV and LOOCV are applied. The capability of NERLS is compared with four related predictors, namely IILLS (Yan et al., 2019), BRWH (Luo et al., 2016), LapRLS (Xia et al., 2010), and CMF (Zheng et al., 2013). IILLS is the first method for identifying potential virus–receptor interactions based on RLS algorithm. In IILLS, the similarity between receptors is computed based on the amino acid sequence similarity and known virus–receptor interactions. As an effective method, BRWH can predict drug–disease association based on bi-random walk. LapRLS is often utilized to identify drug–protein interactions by RLS method. CMF is the classic methods to identify potential drug–target interactions.
Figures 1 and 2 show the performance of four related predictors, from which we can see that the NERLS outperforms four related predictors in terms of the ROC curves. As shown in Figure 1, the AUC values of NERLS is 0.893, which outperforms four related models (IILLS: 0.8675, BRWH: 0.7959, LapRLS: 0.7577, and CMF: 0.7128) in the 10-fold CV. As Figure 2 showed, the AUC value of NERLS is obviously higher than the AUC value of four related models in LOOCV. In Figure 2, NERLS can achieve 0.921, while IILLS, BRWH, LapRLS, and CMF were 0.9061, 0.8105, 0.7713, and 0.7491, respectively. So it is clear from the aforementioned that the prediction performance of NERLS is better than four related models both 10-fold CV and LOOCV.

The AUC curves of NERLS and four related methods in 10-fold CV. 10-fold CV, 10-fold cross-validation; AUC, area under curve; BRWH, Bi-random walk on a heterogeneous network; CMF, Collaborative matrix factorization; IILLS, Initial interaction scores method via the neighbors and the Laplacian regularized Least Square; LapRLS, Laplacian regularized least squares classifier; NERLS, Network Enhancement and the Regularized Least Squares.
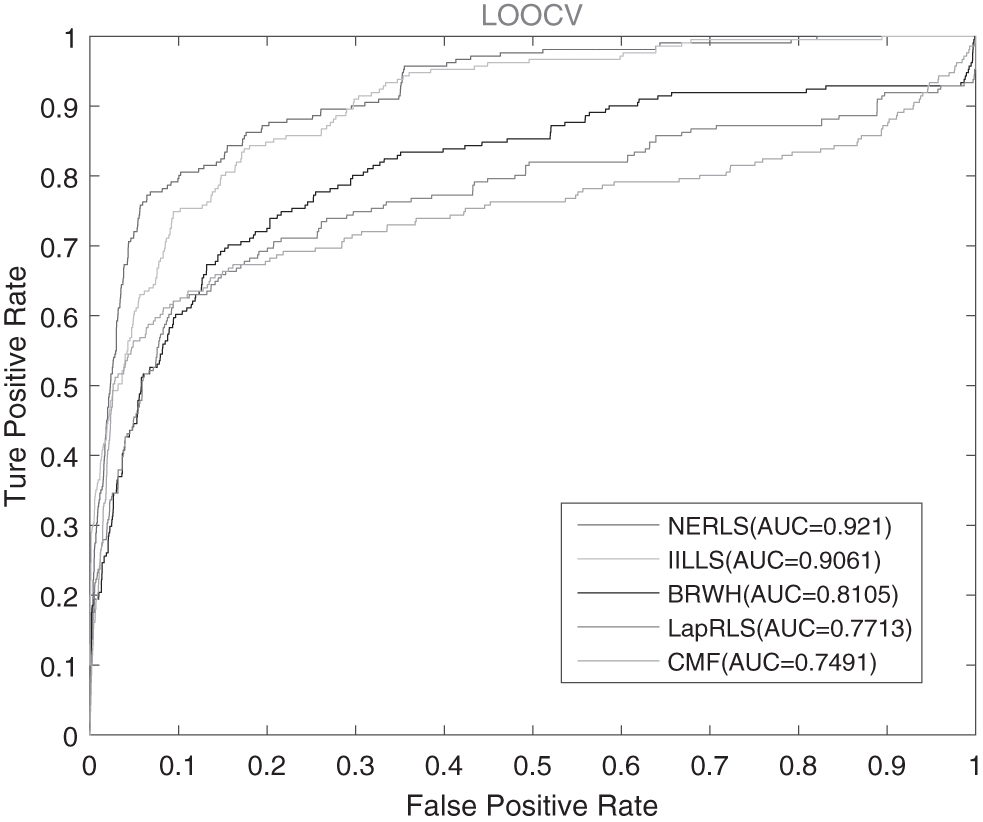
The AUC curves of NERLS and four related methods in LOOCV. LOOCV, leave-one-out cross-validation.
4.4. NERLS based on improving similarities and NE
In this study, NERLS integrates the virus sequence similarity, the receptor sequence similarity, and known virus–receptor interactions to construct the virus similarity network and the receptor similarity network. The NE method is also applicable for further reducing the noise of the virus similarity network and the receptor similarity network. To measure the noise-reduction effect of the NE on the NERLS model, we compare the abilities of NERLS (NE-based with virus and receptor SeqGIP), NERLS (NE-based with virus SeqGIP), and NERLS (NE-based with receptor SeqGIP) by two across-validation approaches of 10-fold CV and LOOCV. In this study, NERLS (NE-based with virus and receptor SeqGIP) is NERLS (NE-based with virus sequence similarity, receptor sequence similarity, and GIP kernel similarity), NERLS (NE-based with virus SeqGIP) denotes NERLS (NE-based with virus sequence similarity and GIP kernel similarity), and NERLS (NE-based with receptor SeqGIP) represents NERLS (NE-based with receptor sequence similarity and GIP kernel similarity).
Figure 3 shows that NERLS (NE-based with virus SeqGIP), NERLS (NE-based with receptor SeqGIP), and NERLS (NE-based with virus and receptor SeqGIP) can achieve AUC values of 0.8748, 0.8808, and 0.893 in 10-fold CV, respectively. As shown in Figure 4, NERLS (NE-based with virus and receptor SeqGIP) obtains AUC value of 0.921, while NERLS (NE-based with virus SeqGIP) and NERLS (NE-based with receptor SeqGIP) have 0.9072 and 0.9139 in LOOCV, respectively. It is obvious for NERLS to make a better performance based on the virus sequence similarity and the receptor sequence similarity.

The AUC curves of NERLS among different similarities in 10-fold CV. NE, Network Enhancement.
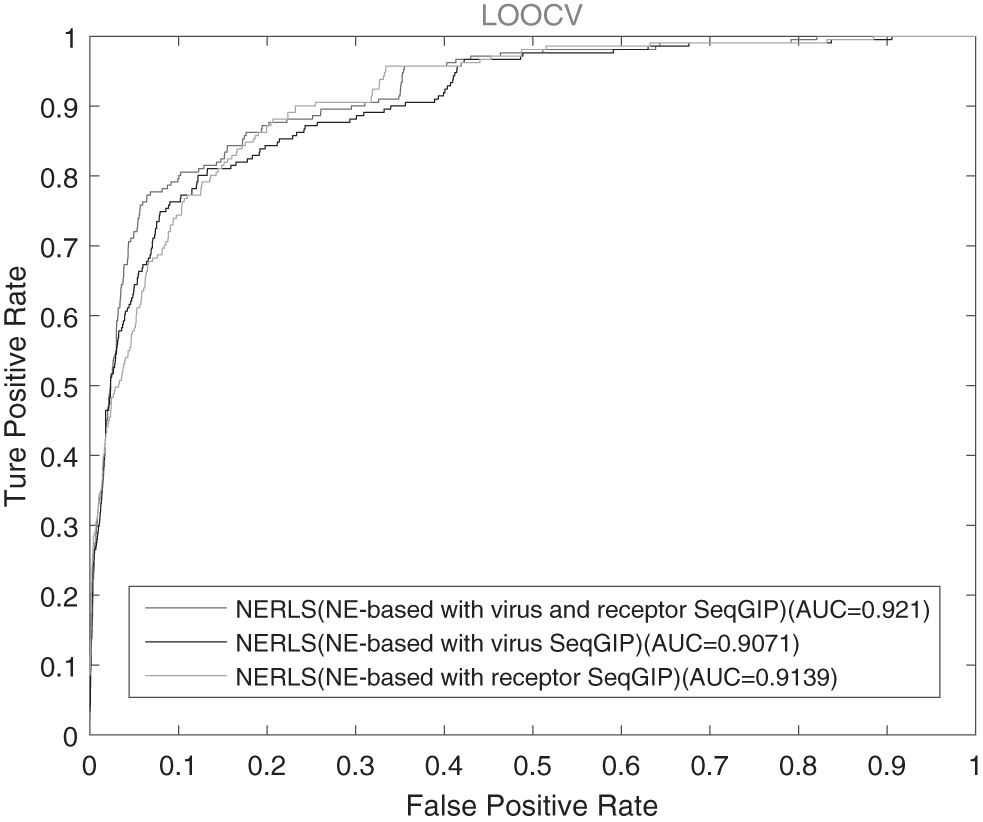
The AUC curves of NERLS among different similarities in LOOCV.
4.5. Case study
In the previous section, we confirm the prediction performance of NERLS by 10-fold CV and LOOCV. Next, we show a case study to further assess the capability of NERLS for identifying potential virus–receptor interactions. Current researches are used to confirm the predicted results of NERLS without independent virus–receptor interactions. A case study is selected to validate the predicted ability of NERLS by literatures in PubMed.
Table 1 shows the validated results of top 10 predicted interactions with highest interaction scores by NERLS. As shown in Table 1, 4 of top 10 potential interactions are validated by literatures in PubMed. For instance, C-type lectin domain family 4 member M is also known as L-SIGN or CD209L, and its carbohydrate recognition domain can mediate the recognition of fucose and high-mannose glycan in a Ca2+-dependent manner. These carbohydrate structures have been discovered in Lassa mammarenavirus and Ebola virus (Sakuntabhai et al., 2005; Garcia-Vallejo and van Kooyk, 2015). Coronaviruses, such as SARS-CoV, human coronaviruses, and 229E, use the same receptor CD209 for viral infection, but the disease caused by SARS-CoV is very different from the disease caused by human coronaviruses and 229E (Lo et al., 2006). L-SIGN is known to bind to Rift valley fever virus as a receptor (Sakuntabhai et al., 2005; Léger et al., 2016). Uukuniemi virus also uses the same receptor to infect cells of the expression lectin abnormally (Sakuntabhai et al., 2005; Léger et al., 2016).
Top 20 Potential Interactions by Network Enhancement and the Regularized Least Squares
5. Conclusion
As a main composition of the human microbiome, viruses are relevant to health and disease. The binding of a virus to its corresponding receptor is the initial event of viral infection. Predicting potential virus–receptor interactions is helpful for the prevention and treatment of viral infectious diseases. In this article, we propose a new computational model (NERLS) to identify virus–receptor interactions based on virus sequence similarity, receptor sequence similarity and known virus–receptor interactions. In NERLS, the virus similarity network is constructed based on the viral RefSeq genomes downloaded from NCBI and the virus GIP kernel similarity. We also construct the receptor similarity network based on the amino acid sequence similarity and known virus–receptor interactions. We employ NE to reduce the noise of the similarity network. Finally, the RLS algorithm is applied for predicting interactions viruses and receptors. The 10-fold CV and LOOCV experimental results show that NERLS was better than four other methods. In addition, a case study also confirms the effectiveness of NERLS in predicting potential virus–receptor interactions.
Simultaneously, the limitations of NERLS are also discussed as follows: (1) Some existing data fusion methods should be explored to integrate more relevant biological information to improve the prediction performance. (2) More computational methods should be used to enhance the prediction capability in the future.
Footnotes
Author Disclosure Statement
The authors declare they have no conflicting financial interests.
Funding Information
This study is supported in part by the National Natural Science Foundation of China (Nos. 61772552, 61832019, and 61962050), 111 Project (No. B18059), Hunan Provincial Science and Technology Program (No. 2018WK4001), Scientific Research Foundation of Hunan Provincial Education Department (No. 18B469), Hengyang Civic Science and Technology Program (202010031491), the Science and Technology Foundation of Guizhou Province of China under Grant No. [2020] 1Y264, and the Aid Program Science and Technology Innovative Research Team of Hunan Institute of Technology.