
Abstract
A gene can be spliced into different isoforms by alternative splicing, which contributes to the functional diversity of protein species. Computational prediction of gene–disease associations (GDAs) has been studied for decades. However, the process of identifying the isoform–disease associations (IDAs) at a large scale is rarely explored, which can decipher the pathology at a more granular level. The main bottleneck is the lack of IDAs in current databases and the multilevel omics data fusion. To bridge this gap, we propose a computational approach called Isoform-Disease Association prediction by multiomics data fusion (IsoDA) to predict IDAs. Based on the relationship between a gene and its spliced isoforms, IsoDA first introduces a dispatch and aggregation term to dispatch gene-disease associations to individual isoforms, and reversely aggregate these dispatched associations to their hosting genes. At the same time, it fuses the genome, transcriptome, and proteome data by joint matrix factorization to improve the prediction of IDAs. Experimental results show that IsoDA significantly outperforms the related state-of-the-art methods at both the gene level and isoform level. A case study further shows that IsoDA credibly identifies three isoforms spliced from apolipoprotein E, which have individual associations with Alzheimer's disease, and two isoforms spliced from vascular endothelial growth factor A, which have different associations with coronary heart disease. The codes of IsoDA are available at http://mlda.swu.edu.cn/codes.php?name=IsoDA
1. Introduction
Understanding the genetic mechanism and pathology of diseases helps to decipher the human genome and development of life sciences (Wang et al., 2019; Claussnitzer et al., 2020). The discovery of genetic disease association is very important for disease prevention, diagnosis, and treatment. Wet lab (clinical)-based methods or high-throughput biotechnologies can help us in identifying the candidate genes associated with a particular disease, but they are still limited by a low throughput or coverage, but high costs.
With rapid accumulation of multiomics data (i.e., genomics, transcriptomics, and proteomics) related to gene products and disease phenotypes, diverse computational methods have been proposed (Vanunu et al., 2010; Natarajan and Dhillon, 2014; Zhou and Skolnick, 2016; Luo et al., 2019). These computational solutions can save resources by excluding genes unlikely to be associated with diseases. These approaches build on different machine learning techniques (Sun et al., 2011; Zhou and Skolnick, 2016; Frasca, 2017), such as network propagation (Vanunu et al., 2010; Wang et al., 2011; Qian et al., 2014; Jiang, 2015), matrix factorization (Natarajan and Dhillon, 2014), data fusion (Pletscher-Frankild et al., 2015), and deep neural networks (DNNs) (Yang et al., 2018; Luo et al., 2019). They mainly use gene–disease associations (GDAs) collected from public databases [i.e., DisGeNET (Piñero et al., 2020) and OMIM (Hamosh et al., 2005)].
Integration of multilevel omics data is essential for development of high-precision predictive models. To achieve better performance, researchers further fused protein–protein interaction (PPI) data from BioGRID (Stark et al., 2006), functional gene network from HumanNet (Wu et al., 2010), RNA-seq datasets, and many others.
Existing computational solutions for predicting genetic disease associations still focus on the gene level. However, a gene can be associated with diverse diseases mainly caused by isoforms alternatively spliced from the same gene. It is reported that more than 90% human multiexon genes undergo alternative splicing (Pan et al., 2008; Wang et al., 2008), which greatly increases the transcriptome and proteome complexity (Smith and Kelleher, 2018). The preteoforms translated from different isoforms of the same gene have different amino acid sequences and structures, thus they may have different associations with diverse diseases. Diverse complex diseases have been found to be associated with alternative splicing, such as autism spectrum disorders (Skotheim and Nees, 2007), ischemic human heart disease (Neagoe et al., 2002), Alzheimer's disease (AD) (Holtzman et al., 2000), and so on. Apolipoprotein E (APOE) is localized in the senile plaques, congophilic angiopathy, and neurofibrillary tangles of AD. Strittmatter et al. (1993) reported that the pathogenesis of AD may be related to different bindings in APOE. They compared the difference of binding of the synthetic amyloid beta (beta/A4) peptide to APOE4 and APOE3 (two common isoforms of APOE) and observed that APOE4 is associated with increased susceptibility to disease. Neagoe et al. (2002) observed a titin isoform switch in chronically ischemic human hearts, with a 47:53 average N2BA-to-N2B ratio in severely diseased coronary artery disease (CHD) transplanted hearts, but a 32:68 ratio in nonischemic transplants.
Identifying isoform–disease associations (IDAs) enables a deeper view of the molecular basis of diverse genetic diseases and helps exploring precise strategies and drugs to treat diverse complex diseases. However, available IDAs are mainly detected by biological experiments and there is no public database storing sufficient IDAs for training. Therefore, traditional machine learning methods cannot be directly adopted for predicting IDAs. In fact, such a bottleneck also exists in isoform function prediction. To overcome this difficulty, some researchers have adapted multiple-instance learning (MIL) (Maron and Lozano-Pérez, 1998; Carbonneau et al., 2018) for isoform function prediction. They model the gene as a bag and the isoforms spliced from this gene as its instances and then identify the individual functions of isoforms by leveraging the known gene-level functional annotations, gene–isoform relationships, and multiple RAN-seq datasets (Eksi et al., 2013; Li et al., 2014; Chen et al., 2019; Shaw et al., 2019; Wang et al., 2020; Yu et al., 2020). These solutions mainly focus on using RNA-seq datasets and/or genomic/proteomic data, without accounting for latent correlations between functional labels, or fuse two types of omics data only.
In this study, we proposed a task of predicting IDAs. Compared with the canonical GDA prediction task, the IDA prediction task is more deeper and challenging due to the lack of IDAs and complexity of alternative splicing. With the advance of RNA-seq technology, large-scale, high-resolution, transcript-level expression data can be easily collected (Wang et al., 2009) and the isoform expression can be quantified at a more precise level. Therefore, IsoDA integrates multiple RNA-seq datasets to identify IDAs. Particularly, IsoDA introduces a regularization term to distribute known GDAs of a gene to its isoforms and reversely aggregate IDAs to gene-level using the gene-isoform relationships. Considering the incomplete GDAs, IsoDA leverages protein interaction data to replenish GDAs and constructs tissue-wise isoform coexpression networks using 298 RNA-seq datasets to account for the tissue specificity of alternative splicing. It further uses the isoform sequence data to construct another isoform functional association network and then combines these networks with adaptive weights to induce a network-regularized, multilabel linear classifier to predict IDAs. In addition, IsoDA introduces an indicator matrix into the unified objective function to differentiate the observed GDAs from unobserved ones and thus alleviates the bias toward observed ones. This study is an extension of our conference work (Huang et al., 2020), which as a showcase proposes the IDA prediction task and demonstrates the fusion of genomics and RNA-seq datasets, enabling the prediction of IDAs. In this extended version, we adopt a larger human dataset with more genes, isoforms, and diseases. We fuse more omics data (genomics, transcriptomics, and proteomics), explicitly model the interrelationships between diseases, give more details on optimizing the fusion of multilevel omics data, and conduct more comprehensive validations. Experimental results show that IsoDA achieves better results than other competitive approaches, including two approaches for predicting GDAs (Vanunu et al., 2010; Zhou and Skolnick, 2016) and three solutions for predicting isoform functions (Li et al., 2014; Wang et al., 2020; Yu et al., 2020).
2. Related Work
Due to the lack of IDAs in public repositories, there is almost no computational solution for identifying IDAs at a large scale. From the gene–isoform relationships, the prediction of IDAs can be modeled as an MIL problem (Zhou et al., 2012; Carbonneau et al., 2018), which has been extensively applied for isoform function prediction in recent years and has a close connection with the prediction of IDAs. Unlike the widely studied gene/protein function prediction, isoform function prediction is still a tough problem. The main difficulty is the lack of functional annotation at the isoform level and the complex relationships between genes and isoforms. Existing functional genome databases [i.e., Gene Ontology (Ashburner et al., 2000) and Kyoto Encyclopedia of Genes and Genomes (KEGG) (Kanehisa et al., 2016)] only record the functional annotation of gene products at the gene level, and contemporary molecule interaction databases [i.e., BioGRID (Chatr-Aryamontri et al., 2017) and STRING (Szklarczyk et al., 2015)] still record the interaction between proteins at the gene level.
Several teams tried to push the gene-level annotations to individual isoforms by adopting MIL (Eksi et al., 2013; Li et al., 2014; Luo et al., 2017; Chen et al., 2019; Shaw et al., 2019; Wang et al., 2020; Yu et al., 2020). These computational solutions model a gene as a bag and its spliced isoforms as instances. They typically follow the principle that a gene is positive for a functional label if at least one of its isoforms is positively annotated with that label, while if the gene is negative for a label, it means that none of its isoforms annotated with that label. To name a few, Eksi et al. (2013) adopted the multiple-instance support vector machine (miSVM) (Andrews et al., 2003) to differentiate functions of isoforms in mouse RNA-seq data. miSVM leverages the functional annotations of genes, isoform expression data, and gene–isoform associations to generate an isoform-level maximum margin classifier. Li et al. (2014) developed instance-oriented multi-instance label propagation (iMILP) to predict isoform functions. iMILP first constructs multiple isoform functional association networks, then uses gene ontology (GO) annotations of a gene to universally initialize the annotations of isoforms, and next, it updates the annotations of isoforms based on the greedy combination of multiple networks and label propagation on the combined network. Luo et al. (2017) proposed a novel, sparse, simplex projection-based approach, the Weighted Logistic Regression-based MIL method (WLRM), to differentiate the functions of isoforms within the MIL framework. WLRM specially takes the genes annotated with the function as positive bags and the genes without the function as negative ones and then maps the original bag space to a different feature space. To alleviate the lack of ground-truth annotations at the isoform level, Shaw et al. (2019) proposed a deep learning-based method (DeepIsoFun) that combines MIL with domain adaption to predict isoform functions, which provides additional labeled training data to transfer the knowledge of gene functions to prediction of isoform functions from GO annotations and RNA-seq data. Yu et al. (2020) recently introduced an approach (IsoFun) to predict isoform functions based on birandom walks on a heterogeneous network, which comprises the isoform functional association network, GO annotations of genes, gene–gene interaction network, and the gene–isoform relationships. Chen et al. (2019) presented the deep learning-based prediction of isoform functions from sequences and expression (DIFFUSE). In the first stage, DIFFUSE designs a DNN to capture features from isoform sequences and domains; in the second stage, it uses a conditional random field (CRF) to explore the relationship between isoforms and assigns GO annotations to isoforms based on initial scores computed by the DNN. DIFFUSE trains both DNN and CRF together under a novel, semisupervised learning setting. Wang et al. (2020) recently proposed DisoFun to differentiate isoform functions with collaborative matrix factorization. DisoFun complies with the main idea that the functional annotations of genes are aggregated from key isoforms, it jointly factorizes the isoform expression data matrix (derived from multiple RNA-seq datasets) and the gene-term association matrix (storing the GO annotations of genes) into low-rank matrices to explore the latent key isoforms, and it pushes the annotations to isoforms by enforcing the aggregated annotations from isoforms to be consistent with the known annotations of genes. DisoFun further leverages PPI networks and the GO hierarchy structure to replenish the annotations of genes and those of key isoforms. These solutions mainly focus on using RNA-seq datasets (Eksi et al., 2013; Li et al., 2014; Luo et al., 2017; Shaw et al., 2019), some of them additionally use genomic data (Chen et al., 2019) or PPIs (Wang et al., 2020; Yu et al., 2020). They neglect the important latent correlations between functional labels and simply fuse two types of omics data without differentiation.
Many studies reported that isoforms are indeed associated with many complex diseases (Holtzman et al., 2000; Neagoe et al., 2002; Latorre et al., 2018), but the study of computational solutions for IDAs is rarely reported, compared with the large-scale study of GDA prediction (Vanunu et al., 2010; Natarajan and Dhillon, 2014; Zhou and Skolnick, 2016; Luo et al., 2019). The recent progress on isoform function prediction sheds light on how to infer IDAs. In this study, we introduce a computational solution (IsoDA) by fusing multiomics data and MIL in a principled way. IsoDA integrates multiple isoform–isoform association networks derived from multiple RNA-seq datasets and the sequence similarity work derived from nucleotides with adaptive weights. It takes advantage of the PPI network to replenish the missing GDAs and then induces a linear classifier to push gene-level associations with individual isoforms in a coherent way. The experimental results show that IsoDA achieves better performance than not only representative, related, GDA prediction methods (Vanunu et al., 2010; Zhou and Skolnick, 2016) but also competitive, isoform function prediction solutions (Li et al., 2014; Wang et al., 2020; Yu et al., 2020). Further case study again corroborates the effectiveness of IsoDA and advantages of these compared methods.
3. The Proposed Method
3.1. Materials and preprocessing
Suppose there are n genes, the i-th gene produces
We adopt the widely used fragments per kilobase of exon per million fragments mapped (FPKM) values to quantify the expression of isoforms. Particularly, we downloaded 596 RNA-seq runs (of total 298 samples from different tissues and conditions) of humans from The Encyclopedia of DNA Elements (ENCODE) project (Consortium, 2012; access date: November 10, 2019). These datasets are heterogeneous in terms of library preparation procedures and sequencing platform. Following the preprocessing done by Li et al. (2014) and Wang et al. (2020), for each tissue, we control the quality of these RNA-seq datasets and quantify the expression values of isoforms as follows:
We first align the short reads of each RNA-seq dataset of the human genome (build GRCh38.90) from Ensemble using HISAT2 (v.2-2.1.0; Kim et al., 2015) and a GTF annotation file of the same build with an option of no novel junction. i) Then, we use StringTie (v.1.3.3b; Pertea et al., 2015) to calculate the relative abundance of the transcript as FPKM. We separately compute the FPKM values of a total of 57,964 genes with 219,288 isoforms for each sample. ii) The FPKM values of very short isoforms are exceptionally higher. Therefore, we discard the isoforms with <100 nucleotides. v) To further control the quality of isoforms, we use known protein coding gene names to map those genes obtained in step (iii). Finally, we obtain 15,204 genes with 137,910 isoforms. The expression values of these isoforms are stored in the data matrix
 . For convenience, we use the normalized
To get the available GDAs, we downloaded the GDA file and the mapping file Unified Medical Language System Unique Concept Identifier (UMLS CUI) to disease ontology (DO) (Schriml et al., 2012) vocabularies from DisGeNET (Piñero et al., 2020). Then, we directly use the available GDAs and DO hierarchy to specify the gene-term association matrix
We collected the gene interaction data from BioGRID (https://thebiogrid.org), which is a curated biological database of genetic interactions, chemical interactions, and post-translational modifications of gene products. Let
We further collected the nucleotide sequences of isoforms from The National Center for Biotechnology Information (NCBI) Nucleotide database, and we adopted the conjoint triad method (Shen et al., 2007) to extract the numeric feature of the nucleotide sequence, which considers three continuous bases as a unit and calculates the frequency of each triad type. The nucleotide sequence comprises adenine (A), guanine (G), cytosine (C), and thymine (T) and three continuous bases were considered as a unit, thus a
3.2. IDA prediction
The lack of IDAs makes it difficult to directly apply the traditional, supervised learning methods to predict IDAs. Within the MIL framework, we leverage the obtained gene–isoform relationships
where
where
By taking

where
A gene generates one or more isoforms by alternative splicing, and these isoforms have diverse expression patterns across tissues (Kandoi and Dickerson, 2019; Defer et al., 2000). Based on this observation, the association networks of isoforms should be constructed from the tissue level, and more appropriate fusion of these networks can help to accurately identify the IDAs. To make full use of tissue-specific patterns of multiple RNA-seq datasets, we advocate integrating multiple isoform functional association networks from the tissue level with weights. In addition, sequence data also carry important information for prediction of IDAs, so we also construct a sequence similarity-based isoform functional association network of isoforms. To this end, we integrate multiple isoform functional association networks and extend Eq. (3) as follows
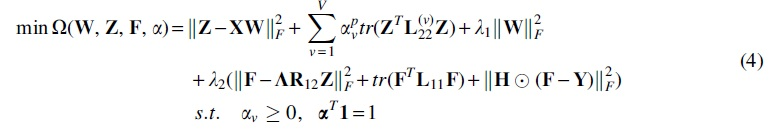
An isoform can be associated with different diseases and these diseases have some latent correlations. For example, the diseases are hierarchically organized by a directed acyclic graph in DO. It is recognized that the account of such hierarchical information can boost the performance of isoform function prediction (Wang et al., 2020; Yu et al., 2020). Here, we introduce a latent disease–disease correlation matrix
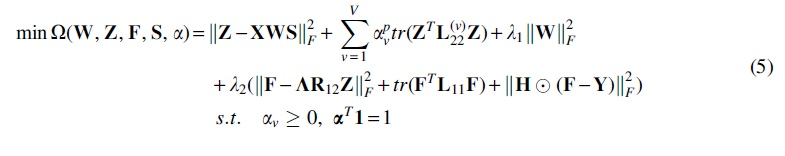
3.3. Optimization
The optimization problem in Eq. (5) is nonconvex with respect to
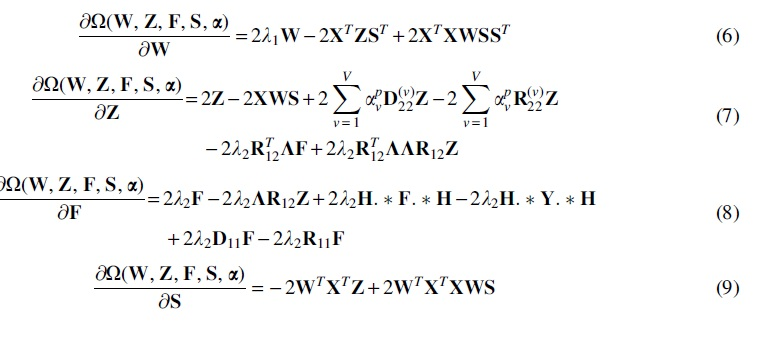
We can then use the Karush–Kuhn–Tucker conditions (Boyd and Vandenberghe, 2004) for the non-negativity of
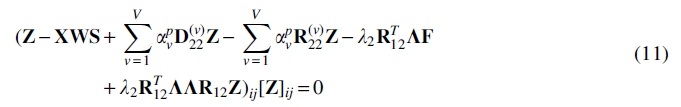
These non-negative constraints give the fixed-point relationship that the solution must satisfy. As such, we can update
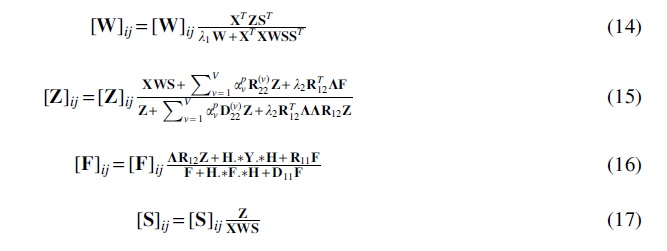
When
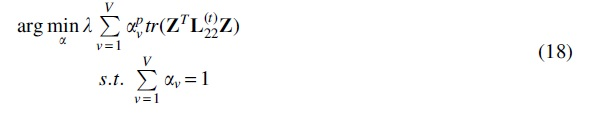
Here, we adopt the Lagrange multiplier method to optimize α:

where
Since
By iteratively updating
3.4. IDA/GDA prediction
Suppose
4. Experiment Results and Analysis
4.1. Experimental setup
In our article, we collect multiple RNA-seq datasets from the ENCODE project, GDA data from DisGeNET, gene interaction data from BioGRID, and sequence data of isoforms from NCBI for assessing the performance of IsoDA in predicting IDAs. The preprocessed GDAs and isoforms of the genes are listed in Table 1.
Statistics of Genes, Isoforms, and Gene–Disease Associations for Experiments
GDAs, gene–disease associations.
To comparatively study the performance of IsoDA, we take the state-of-the-art isoform function prediction methods [iMILP (Li et al., 2014), IsoFun (Yu et al., 2020), and DisoFun (Wang et al., 2020)], and two GDA prediction methods [PRINCE (Vanunu et al., 2010) and Know-GENE (Zhou and Skolnick, 2016)] as the compared methods. The input parameters of these compared methods are fixed/optimized as in the original articles or shared codes. For IsoDA, we choose
We adopt six evaluation metrics,
4.2. Result evaluation at the gene level
We adopt fivefold cross-validation at the gene level for the experiment. The GDAs in the validation set are considered as unknown during training and prediction and only used for validation. Table 2 reports the results of IsoDA and of compared methods. IsoDA achieves better results than the compared methods across all the six evaluation metrics.
Experimental Results of Fivefold Cross-Validation
/○ indicates IsoDA performing better/worse than the other comparing method, with significance assessed by pairwise t-test at the 95% level.
We also compare the performance of IsoDA with two GDA prediction methods, [PRINCE (Vanunu et al., 2010) and Know-GENE (Zhou and Skolnick, 2016)]. PRINCE uses a network propagation strategy to predict causal genes and protein complexes that are involved in a disease of interest. Know-GENE first quantifies gene–gene mutual information using the co-occurrence of genes in GDA data and then combines the mutual information with PPI networks using a boosted tree regression method to predict GDAs. Compared with PRINCE, Know-GENE makes better use of GDAs: it integrates gene–gene mutual information calculated from GDAs and the available PPIs to predict GDAs in a knowledge-driven way, so Know-GENE outperforms PRINCE by a large margin. For similar reasons, the performance margin between IsoDA and Know-GENE is smaller than those between IsoDA and other compared methods. From Table 2, we can observe that some isoform function prediction methods sometimes perform worse than the two GDA prediction methods. This is because isoform-level methods focus more on utilizing transcriptomics data, while the surrogate evaluations are made at the aggregated gene level instead of the target isoform level. We want to highlight that our IsoDA is an inductive approach that can directly predict the associations between diseases and a new isoform, whereas these compared methods are transductive solutions and they need this new isoform to be included for training before the prediction.
We further applied the signed-rank test (Demšar, 2006) to compare the results of IsoDA against those of the compared methods across the six evaluation metrics; all the p-values are smaller than 0.0313. In summary, these results indicate the effectiveness of IsoDA in identifying IDAs.
4.3. Result evaluation at the isoform level
In this subsection, we further assess the performance of IsoDA at the isoform level. Due to the lack of ground-truth IDAs, we take 5568 single-isoform genes, each of which produces only one isoform within our used dataset as the testbed, and take the rest of the genes and isoforms as the training set. We follow the same setting as previous experiments and report the results in Figure 1. PRINCE and Know-GENE do not consider the gene–isoform relationships and they can only predict the associations between genes and diseases, so their results are excluded.

Performance results of IsoDA and of compared methods on predicting IDAs of isoforms spliced from single-isoform genes. IDAs, isoform–disease associations.
IsoDA again achieves better performance than the three compared methods (iMILP, IsoFun, and DisoFun) at the isoform-level disease association prediction. iMILP universally distributes GDAs to all isoforms of a gene, then only propagates IDAs on the isoform coexpression network, so it has the lowest performance. IsoFun and DisoFun leverage the protein interaction data similar to IsoDA, but they do not consider the tissue specificity of multiple RNA-seq datasets and isoform sequence data, so they both perform worse than IsoDA. By referring to Table 2 and Figure 1, we can conclude that IsoDA is indeed effective in fusing genomics, transcriptomics, and proteomic data to handle the multiplicity of predicting IDAs at the isoform level.
4.4. Case study
To further explore the reliability of IsoDA in predicting IDAs, we collect some IDAs from PubMed literature (Strittmatter et al., 1993; Rebeck et al., 2002; Li et al., 2020). APOE2, APOE3, and APOE4 are three alternatively spliced isoforms of APOE, and AD is associated with different bindings with APOE (Strittmatter et al., 1993). It is recognized that the expression of APOE4 increases the risk of AD, while APOE2 decreases the risk. Accumulated evidences suggest the detrimental effect of APOE4, and APOE2 protects against AD through both amyloid-
Isoform–Disease Associations of Apolipoprotein E and Vascular Endothelial Growth Factor A
APOE, apolipoprotein E; VEGFA, vascular endothelial growth factor A.
We further investigate IDAs of the gene, vascular endothelial growth factor A (VEGFA), with respect to CHD. VEGFA undergoes extensive alternative splicing and encodes isoforms with both angiogenic and antiangiogenic potential through the differential use of an alternative splice site with exon 8 (Qiu et al., 2009). Some researches (Qiu et al., 2009; Kikuchi et al., 2014; Wang et al., 2017; Latorre et al., 2018) found that two isoforms (
Based on these case results, we can conclude that IsoDA has the potential to accurately identify IDAs of isoforms spliced from the same gene.
4.5. Ablation study
To further investigate the contribution components, we design seven variants of IsoDA, which are configured as follows:
IsoDA (nS) removes the disease correlation matrix
IsoDA (cS) uses the initial disease correlation matrix
IsoDA (RNA) only uses the isoform expression data derived from multiple RNA-seq datasets.
IsoDA (Seq) only utilizes the isoform sequence data.
IsoDA (RNA+Seq) concatenates the isoform expression profile feature vectors of different tissues and the isoform sequence feature vectors into a single one, and then directly constructs a single isoform functional association network using cosine similarity.
IsoDA (n
IsoDA (nH) removes the indicator matrix  in Eq. (5), and it does not consider the bias toward the observed GDAs.
All the other configurations of these variants are kept the same as IsoDA, unless specified otherwise. Figures 2–4 report the performance results of IsoDA and its variants. The experimental settings are the same as the evaluation at the gene level and we can easily observe that IsoDA achieves better performance than its variants.
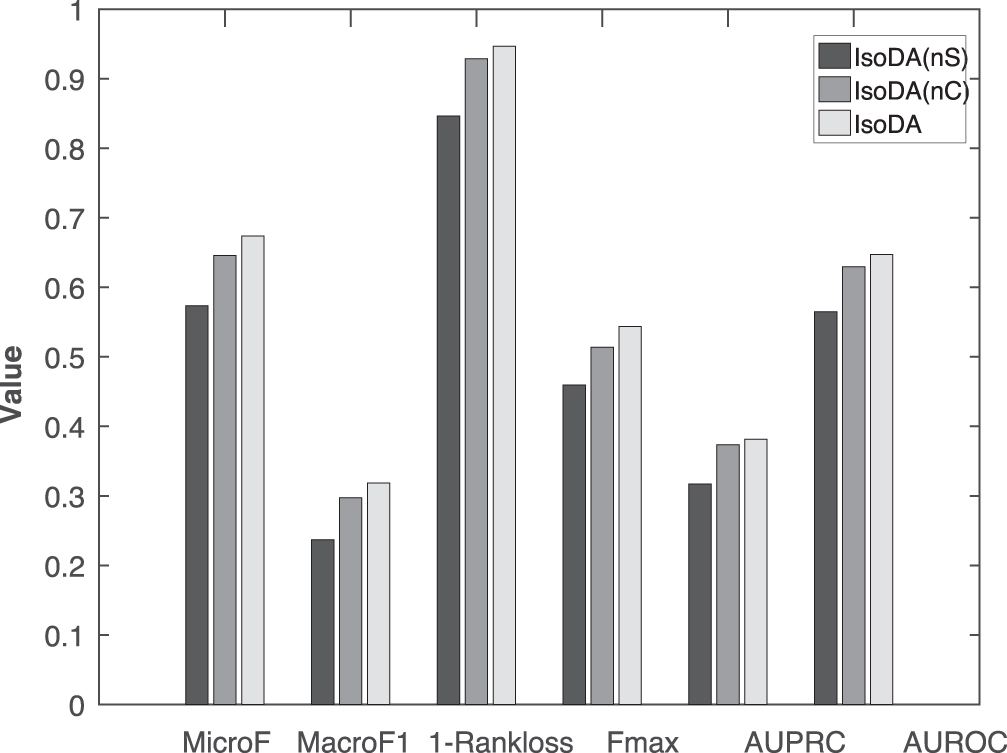
Performance results of IsoDA (nS), IsoDA (cS), and IsoDA. IsoDA (nS) disregards the disease correlations, and IsoDA (cS) directly uses disease correlations estimated from initial GDAs. GDAs, gene–disease associations.
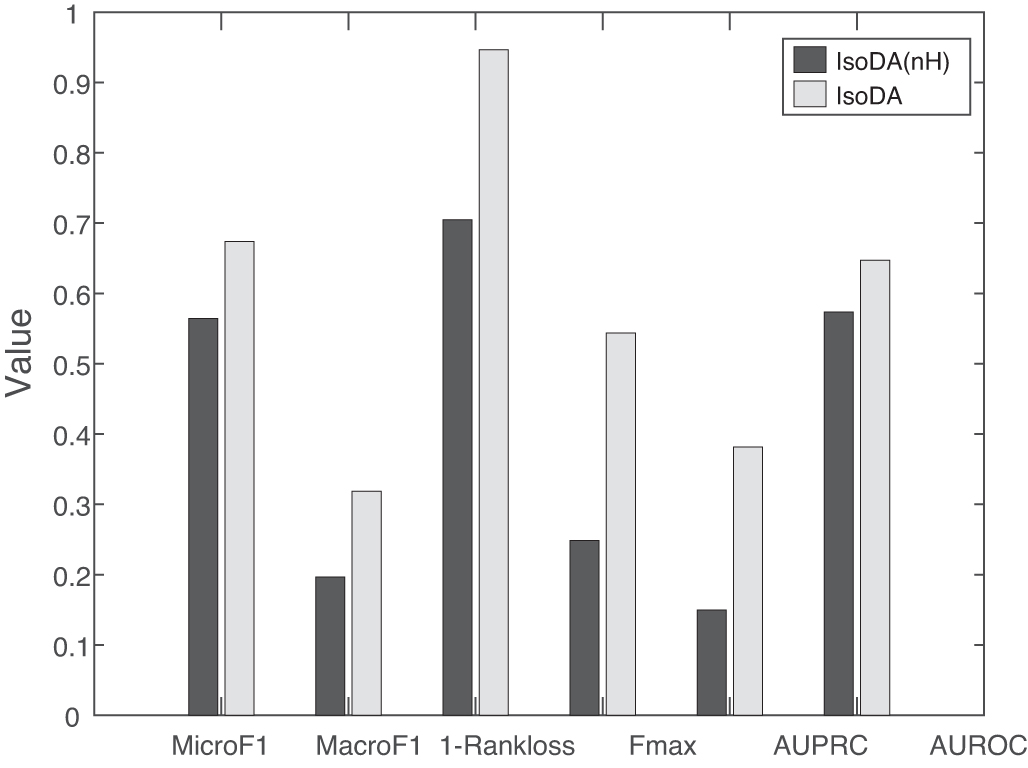
Performance results of IsoDA (nH) and IsoDA. IsoDA (nH) implicitly assumes that the observed GDAs are complete.
In Figure 2, IsoDA (nS) clearly has lower performance values than IsoDA, which considers disease correlations. This leads to the fact that exploring latent correlations between diseases can boost the performance of IDAs. IsoDA (cS) incorporates the estimated disease correlation
In Figure 3, IsoDA (RNA) performs worse than IsoDA (Seq), which shows that the isoform sequence data make more contributions for identifying IDAs (GDAs) than RNA-seq datasets since the sequence data include important functional sites and domains of isoforms. Both IsoDA (RNA) and IsoDA (Seq) have lower performance values than IsoDA (RNA+Seq), and not to mention IsoDA. This fact shows that fusing RNA-seq data and sequence data can boost the prediction of IDAs (GDAs). IsoDA (RNA+Seq) has lower performance values than IsoDA (n
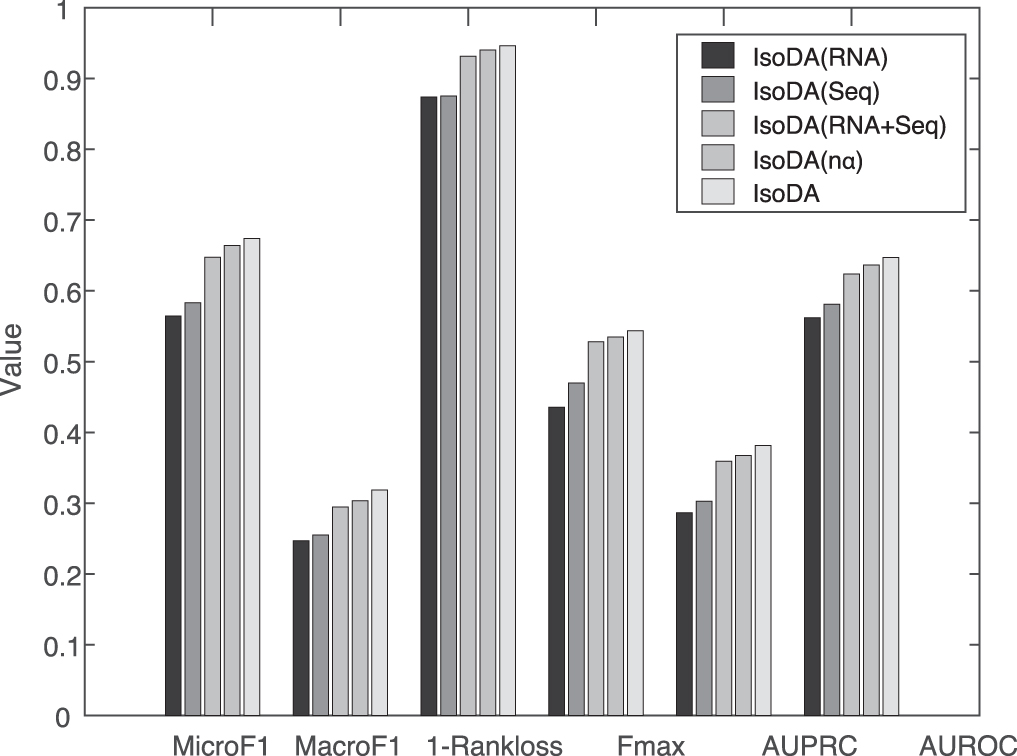
Performance results of IsoDA (RNA), IsoDA (Seq), IsoDA (RNA+Seq), IsoDA (n
From Figure 4, we can see that IsoDA shows an obvious improvement over IsoDA (nH), which implicitly assumes that the observed GDAs are complete. In contrast, IsoDA considers the incompleteness of observed GDAs and enforces latent IDAs to be consistent with the collected ones. At the same time, it differentiates the currently observed associations from the unobserved (potential) ones. As a result, IsoDA is less biased toward observed ones. In practice, the incomplete associations are implicitly ignored by most GDA prediction methods and isoform function prediction methods. As a result, these compared methods and IsoDA (H) perform worse than IsoDA.
In conclusion, the ablation study confirms the effectiveness of IsoDA in fusing genomics, transcriptomics, and proteomic data to more accurately predict IDAs. It also supports the importance of specifically considering the incomplete GDAs. IsoDA models these important factors and thus clearly obtains better performance results than these variants.
4.6. Parameter sensitivity analysis
There are two input parameters (
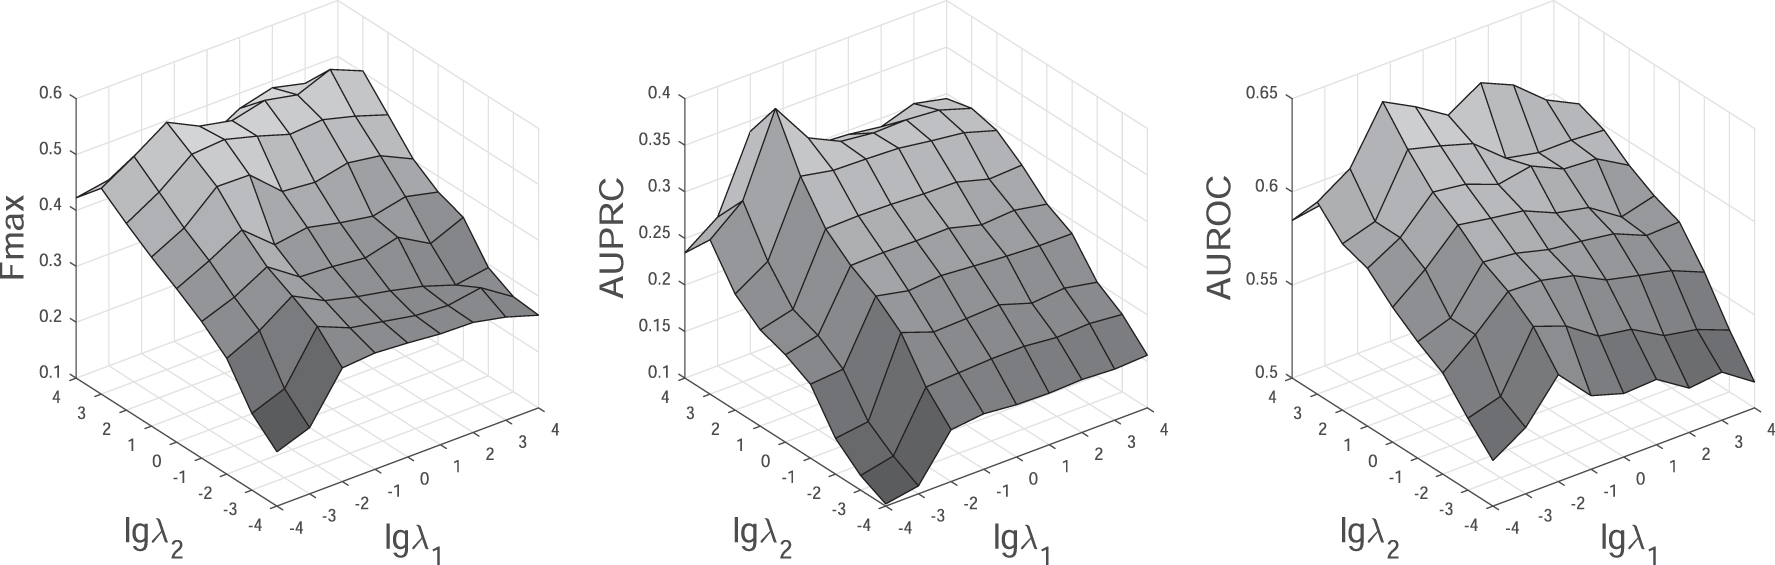
Performance results of IsoDA under different input values of
We observe that IsoDA increases clearly in Fmax, AUPRC, and AUROC when
5. Conclusion
In this study, we study how to computationally identify IDAs, which is an interesting important, but largely unexplored, topic that can uncover the disease pathology at a deeper level than the well-studied GDA analysis. Our proposed approach, IsoDA, leverages genome, transcriptome, and proteome data and MIL to bypass the lack of IDAs and to distribute GDAs with individual isoforms. IsoDA considers the incompleteness of available GDAs and incorporates PPI data and the indicator matrix to complete GDAs. It further takes into account the tissue specificity of alternative splicing and adaptively combines multiple isoform functional association networks induced from multiple RNA-seq datasets at the tissue level. IsoDA performs significantly better than related competitive methods that target identification of GDAs or isoform functions.
Footnotes
Author Disclosure Statement
No competing financial interests exist.
Funding Information
This research is supported by the National Natural Science Foundation of China (Grant Nos. 61872300, 62031003, and 62072380).