




Abstract
A biological pathway is an ordered set of interactions between intracellular molecules having collective activity that impacts cellular function, for example, by controlling metabolite synthesis or by regulating the expression of sets of genes. They play a key role in advanced studies of genomics. However, existing pathway analytics methods are inadequate to extract meaningful biological structure underneath the network of pathways. They also lack automation. Given these circumstances, we have come up with a novel graph theoretic method to analyze disease-related genes through weighted network of biological pathways. The method automatically extracts biological structures, such as clusters of pathways and their relevance, significance of each pathway and gene, and so forth hidden in the complex network. We have demonstrated the effectiveness of the proposed method on a set of genes associated with coronavirus disease 2019.
1. Introduction
Identifying the functional correlations among molecular components is very crucial to accurately deciphering the structure–function interdependencies. Usually, most of the biological activities are not stemming from a single molecule but a set of molecules interacting in a concerted way (for instance, polygenic disorders). Consequently, deciphering biology under the context of networks is very crucial and promising. From the perspective of graph theory, a biological network consists of a set of nodes representing specific biological entities. Two nodes are connected by an edge depicting an affiliation between them. Based on the characteristic of a network, an edge can be directed or undirected. The weight of an edge defines similarity or dissimilarity between the two participating nodes, such as semantic similarity and Pearson's coefficient. For instance, in protein–protein interaction (PPI) networks, nodes and edges represent proteins and physical interactions, respectively (Rual et al., 2005; Stelzl et al., 2005). For another instance, in metabolic networks, nodes serve as metabolites and edges are links for these metabolites engaging in the same biochemical reactions (Jeong et al., 2000; Duarte et al., 2007). In this context, accurately identifying functional modules (i.e., clusters) in a biological network is very critical because it helps us to figure out the underneath structure, interactions, and dynamics of cell functions (Bu et al., 2003; Spirin and Mirny, 2003).
Applying biological network analytics to a set of genes related to a specific disease has been done before by several researchers. For example, Hu et al. (2017) have taken a pathway-based approach and applied a network analysis method to understand the molecular features of Alzheimer's disease. Other researchers have proposed mining algorithms targeting PPI networks for Homo sapiens. Theses algorithms are designed to discover functional modules (clusters) of protein complexes. This is because such densely connected subgraphs usually lead to substantial biological knowledge at the molecular level. As an example, Sriwastava et al. (2017) have proposed a quasi-clique mining method for detecting these dense regions. Melo et al. (2016) have used a machine learning approach to detect such hot spots. In their study they used 27 algorithms with different cost functions and reported the best algorithm.
In this article, we have proposed a novel methodology for analyzing complex network of biological pathways. It is scale free, that is, there is no hard thresholding to discard edges based on weight. It runs in four stages. At first, it picks a set of enriched biological pathways for a given set of disease-related genes. Later, it constructs a weighted network where each pathway acts as a node. Two nodes are connected by an edge if they have some common biological entities and the weight of this edge refers to that similarity. In this study, our similarity score is well defined and its values are ranging from 0 to 1. At the third stage, it clusters the network into a set of nonoverlapping groups having highest modularity. Finally, it ranks the pathways based on their significance.
The rest of the article is organized as follows. Our proposed methodology is described in Section 2. Results and some relevant discussions are portrayed in Section 3 and Section 4 concludes the article.
2. Methods
Our proposed algorithm consists of four basic steps as stated earlier. At the beginning, we find a set of statistically significant biological pathways with respect to a curated list of disease-related genes. We then form a network of pathways by employing an innovative weighted network construction method. At the third step, we detect a set of subnetworks by clustering the entire network. Finally, we analyze each of the subnetworks based on closeness centrality. Pseudo code of our proposed method can be found in Algorithm 1. Next, we illustrate our proposed method in detail.
2.1. Identification of significantly enriched pathways
At first, we find a set of biological pathways from the database of pathways (Reactome, KEGG, etc.) with respect to a given set of disease-related genes (i.e., a set of genes known to be responsible for a specific disease, such as Alzheimer's, Parkinson's, or COVID-19). Later, we employ hypergeometric test that uses the hypergeometric distribution (https://en.wikipedia.org/wiki/Hypergeometric_distribution) to calculate the statistical significance of a biological pathway with respect to the given set of genes. Specifically, we computed a hypergeometric p-value for each of the biological pathways to assess whether a pathway is over-represented with those genes. Finally, we choose a set of enriched pathways having Bonferroni corrected p-value <0.05.
2.2. Construction of a weighted network
We build an undirected weighted graph to investigate interlinks and interactions among the enriched biological pathways. Let
2.3. Identification of subnetworks
Clustering is one of the most widely used techniques for exploratory data analysis. The goal here is to divide the biological pathways into several groups such that each group of pathways represents a specific and distinct biological event/theme. As the network of biological pathways often constitutes a small number of nodes ( , where n is the number of nodes in the network.
2.4. Identification of important pathways
In graph theory and network analysis, centrality is a very crucial notion in identifying influential nodes in a graph. It is used to measure the importance of distinct nodes in a graph. Applications include but are not limited to identifying the most influential person(s) in a social network, key infrastructure nodes in the Internet or urban networks, super-spreaders of disease, and so forth. Depending on the definition of centrality, it comes in contrasting essences. Simplest one is the degree centrality, which is defined as the number of edges incident on a particular node. A natural extension of degree centrality is closeness centrality. In a connected graph, closeness centrality of a node is a measure of centrality in a network, calculated as the reciprocal of the sum of the length of the shortest paths between the node and all other nodes in the graph (Bavelas, 1950). Consequently, the more “central” a node is, the more closer it is to all other nodes in the graph. Mathematically it is defined as
3. Results and Discussions
3.1. Data set employed
To demonstrate the effectiveness of our proposed methodology, we have performed rigorous experimental evaluations by considering a set of human protein-coding genes linked to SARS-CoV-2 infection and COVID-19 disease. These genes are curated from GENCODE (https://www.gencodegenes.org/human/covid19.html). The list consists of 560 genes extrapolated from recent publications and in collaboration with other projects, such as recently published drug repurposing studies by Zhou et al. (2020) and Gordon and Jang (2020). Throughout the article, we dubbed this set of genes as covid-genes.
3.2. Outcomes and relevant discussions
As stated in Section 2, our network analytics method runs in four stages. Next, we illustrate the experimental evaluations based on those stages in detail.
3.2.1. Pathway enrichment analysis
At first, we chose a set of enriched biological pathways from the database of pathways. In this study, Reactome (Croft et al., 2010) pathways were utilized to decipher the biological theme from the set of 560 covid-genes. Here is a brief review of Reactome database. Reaction is the “nucleus” of the Reactome data model. A set of entities, such as nucleic acids, proteins, complexes, and small molecules, engages in reactions to form a network of biological interactions that are ultimately assembled into pathways. Some notable examples of biological pathways in Reactome database consist of signaling, innate and acquired immune function, transcriptional regulation, translation, apoptosis, and classical intermediary metabolism.
After employing hypergeometric test, we detect 30 Bonferroni corrected (adjusted
Bonferroni Corrected Enriched Reactome Pathways
Gp refers to the number of genes a pathway contains. Gc refers to the common genes between a pathway and covid-genes.
DDX58, refers to the DExD/H-box helicase 58 gene; GRP, gastrin releasing peptide; IFIH1, interferon induced with helicase C domain 1; IRF, interferon regulatory factors; MHC, major histocompatibility complex; NEP/NS2, nuclear export protein; TLR, toll-like receptor; TRAF3, TNF receptor associated factor.
3.2.2. Entire network analysis
After finding the statistically significant pathways, we build a network as stated in Section 2. We found 243 covid-genes (out of 560) in the enriched 30 Reactome pathways. Enrichment analyses based on GO-BP and disease ontology (DO) terms have been performed with respect to those 243 covid-genes.
3.2.2.1. GO-BP enrichment analysis
One of the main uses of the GO terms is to perform enrichment analysis on a given set of genes. For instance, an enrichment analysis will find which GO terms are over-represented (or under-represented) using annotations for that set of genes. We have performed enrichment analysis on 243 covid-genes based on GO-BP terms and retained 163 GO-BP Bonferroni corrected (adjusted
Bonferroni Corrected Top 10 Enriched GO-BP Terms
GO-BP, “biological process” subontology of gene ontology.
3.2.2.2. DO enrichment analysis
Like GO, the DO is a formal ontology of human disease. We have performed enrichment analysis on the set of top 243 covid-genes as already noted based on DO terms and retained 7 DO Bonferroni corrected (adjusted
Bonferroni Corrected Enriched Disease Ontology Terms
3.2.2.3. Pathway significance
As noted earlier, after constructing the network, we compute the influence of each pathway based on closeness centrality. The corresponding network is shown in Figure 1. The influence of each pathway with respect to the entire network is proportional to the diameter of its representative circle. “Metabolism of proteins” and “Trafficking and processing of endosomal TLR” pathways possess the highest (0.91) and lowest (0.36) centrality scores, respectively.
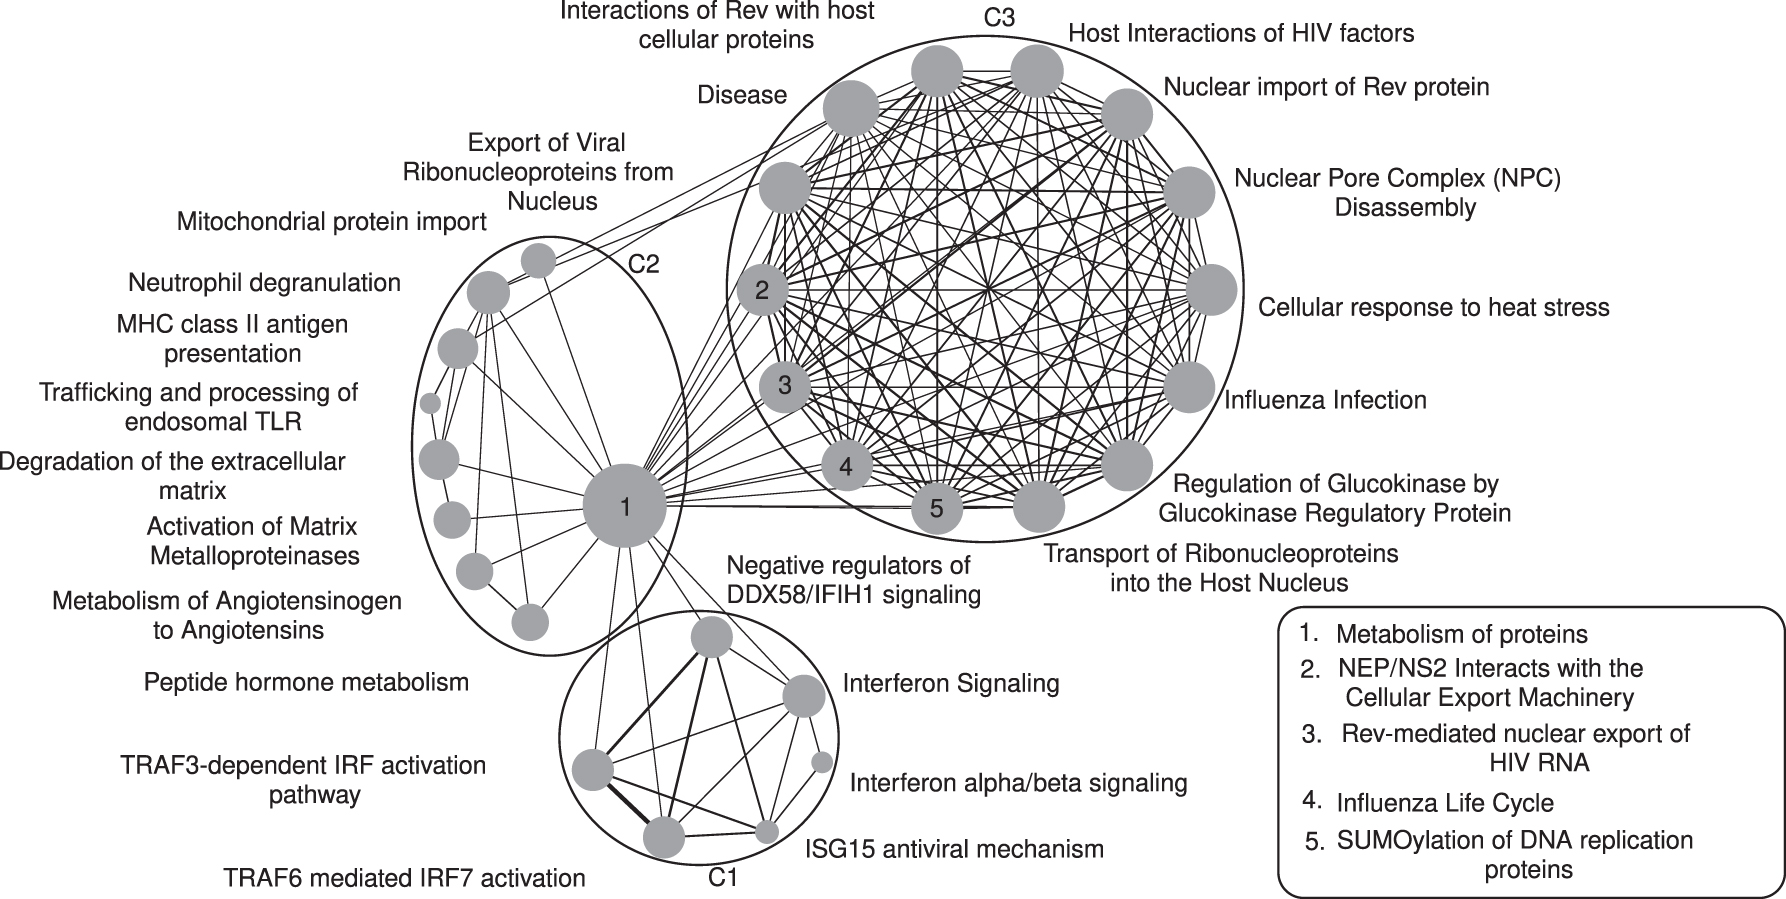
Entire network built from 30 statistically significant pathways.
3.2.3. Subnetwork analysis
After constructing the weighted network, we cluster the network to find functional modules. Since the weight of an edge corresponds to the functional similarity between two pathways, see Section 2, each of the subnetworks consisting of highly interconnected pathways should mimic a specific biological theme or functionality. Note that our network is scale free, that is, there is no thresholding on weights. Also we do not need to provide the number of clusters a priori. The clustering algorithm automatically dismantles the entire weighted network into three groups, namely C1, C2, and C3. Figure 1 shows the entire network along with cluster annotations. We have also computed pathway centrality scores for each of the subnetworks as shown in Figure 2.
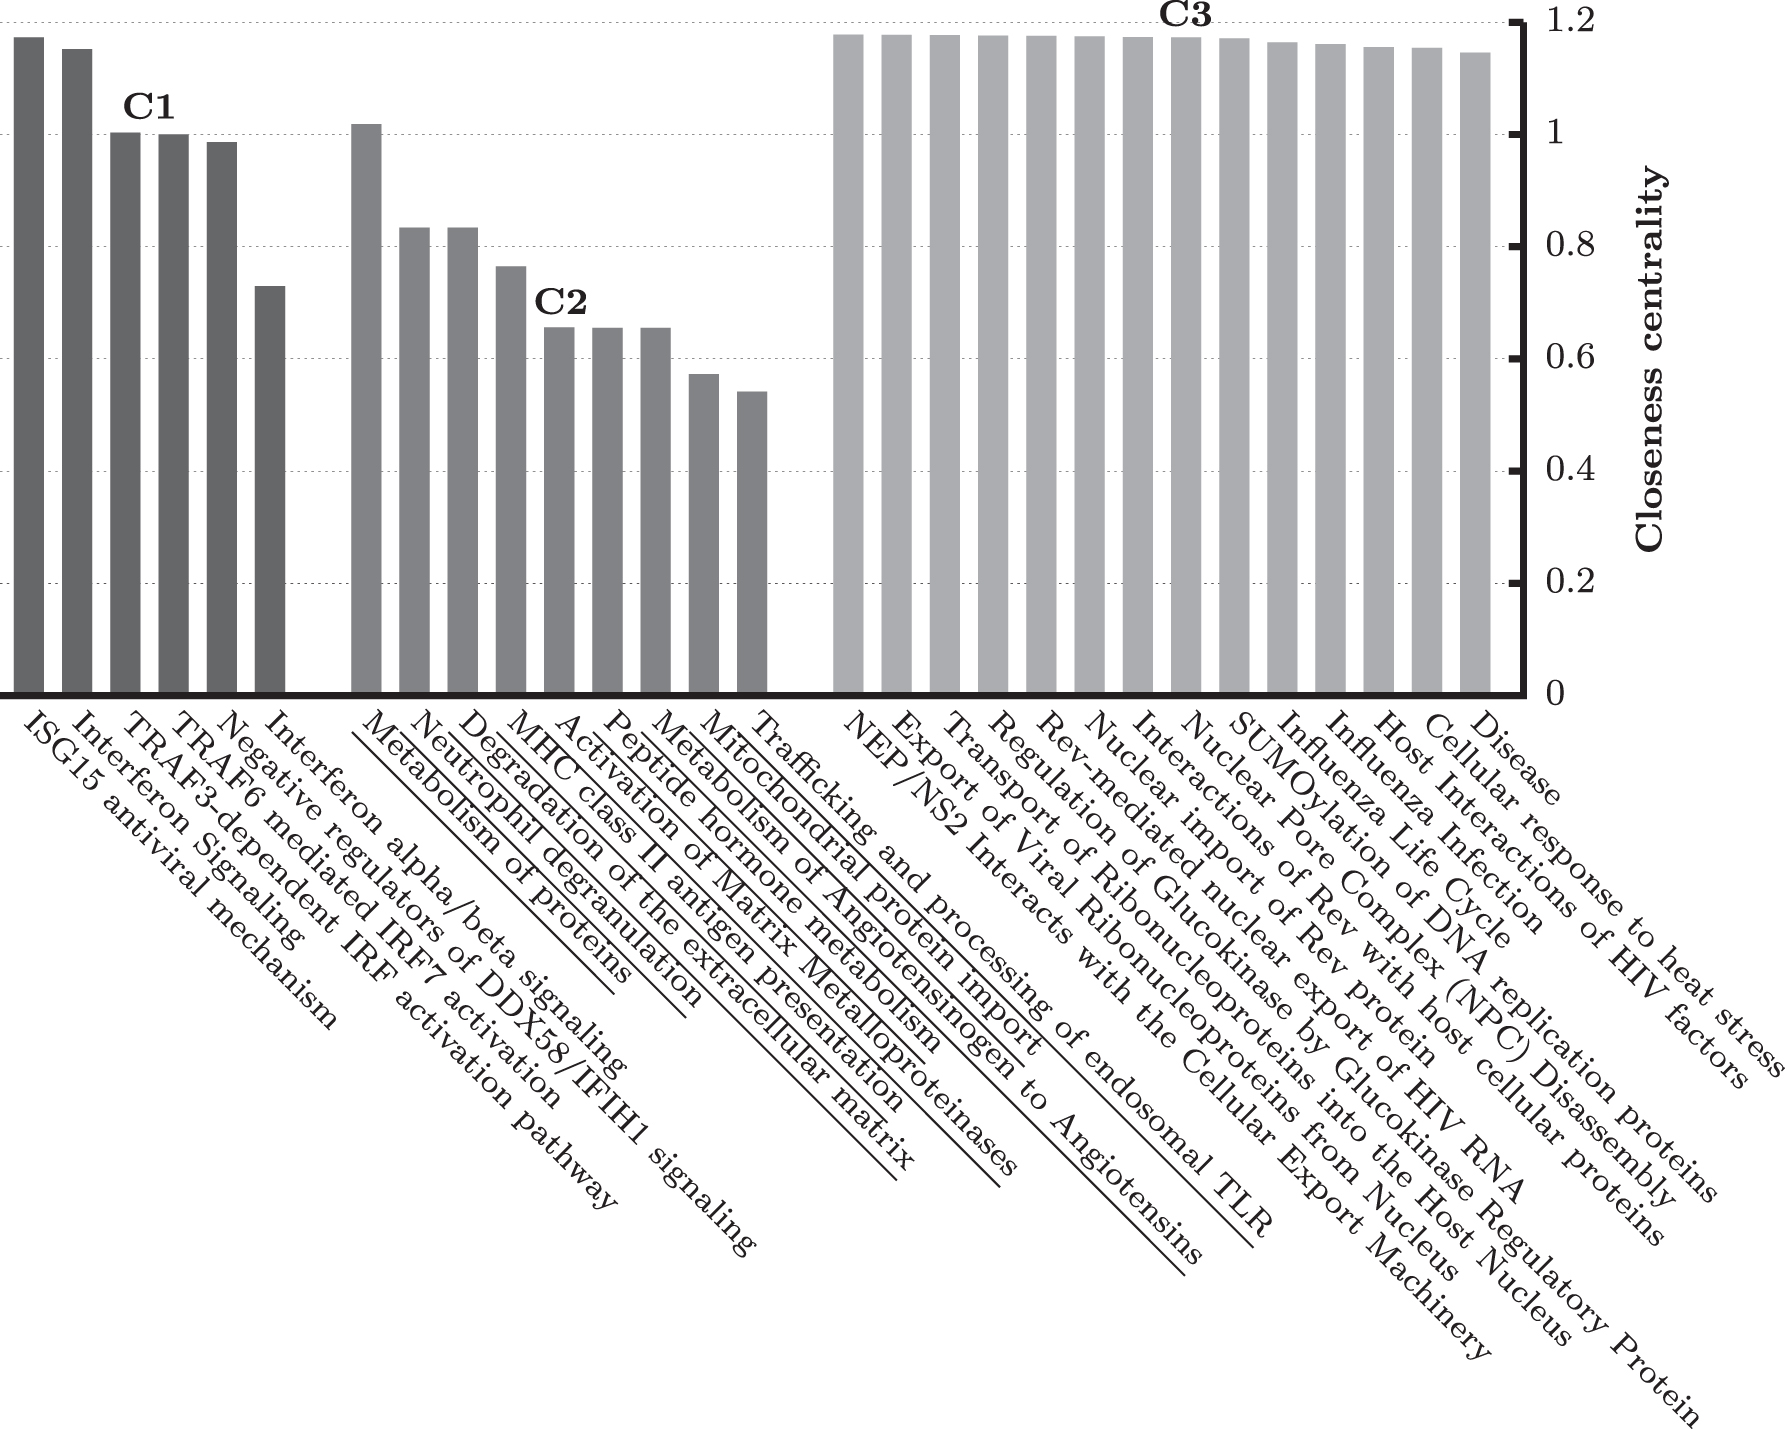
Closeness centrality values for pathways in clusters C1, C2, and C3.
At first, consider C1 cluster. It consists of six pathways and all of them are related to immune systems in humans. Therefore, our proposed method accurately classifies a set of interrelated and analogous pathways into a group. According to the centrality measure, “ISG15 antiviral mechanism” is the most influential pathway in this cluster. It is a potential regulator of the immune response from viral infection. As reported by Swaim et al. (2020), viral de-ISGylases, including SARS-CoV-2 PL
Top Six Most Occurring Covid-Genes in Each Cluster
NP refers to the number of pathways a specific gene is found.
C2 subnetwork contains nine pathways and is very interesting. It is a mixture of protein metabolism and immune system-related pathways. Several studies (such as Odegaard and Chawla, 2013) demonstrated the strong link between immune cell function and protein metabolism. Table 4 contains top six most occurring covid-genes in cluster C2. The Cathepsin G gene (CTSG) has been found in six (out of nine) pathways. According to Akgun et al. (2020), it was significantly altered in naso-oropharyngeal samples of SARS-CoV-2 patients.
Finally, C3 consists of 14 pathways. Almost all of them are related to some specific viral infections. See Table 4 for the top six most occurring covid-genes in cluster C3. All the top genes have been found in all the 14 pathways. As reported by Addetia et al. (2020), SARS-CoV-2 ORF6 disrupts nucleocytoplasmic transport through interactions with RAE1 and NUP98.
4. Conclusions
In this article, we have proposed a formal framework to decipher complex structure among the interacting biological pathways. To begin with, a set of enriched biological pathways is identified with respect to a set of disease-related genes. An innovative weighted network is then constructed. It is scale free, that is, there is no hard thresholding to discard edges based on weights. The weighted network is then disassembled to find a set of nonoverlapping and functionally different clusters. We have demonstrated its effectiveness by employing a set of genes potentially associated with COVID-19.
Footnotes
Author Disclosure Statement
The authors declare they have no competing financial interests.
Funding Information
This research has been supported in part by the National Science Foundation (NSF) grants 1743418 and 1843025.